Ramp's data grew more than 10x on Matia. See how Ramp runs 300 integrations into Snowflake & moved off a Postgres sync that caused multi-day outages.
Ramp is an AI-first finance company. Each week, about 1,500 people at Ramp work with Snowflake, either directly or through agents. Ryan Delgado, Head of Data Platform, says Matia is the team Ramp trusts to manage the pipelines into that warehouse.
A Postgres sync that kept failing
Ramp's previous ETL tool couldn't keep up with the throughput Ramp needed. Its most critical sync, from Postgres into Snowflake, failed unpredictably. Each failure meant a full historical restatement of the Postgres database, which sometimes caused outages lasting several days. The problem got worse as Ramp's data grew.
"Matia can sync data a lot faster and then also show more flexibility and resiliency in their sync. That was huge for us."
One tool for 300 integrations
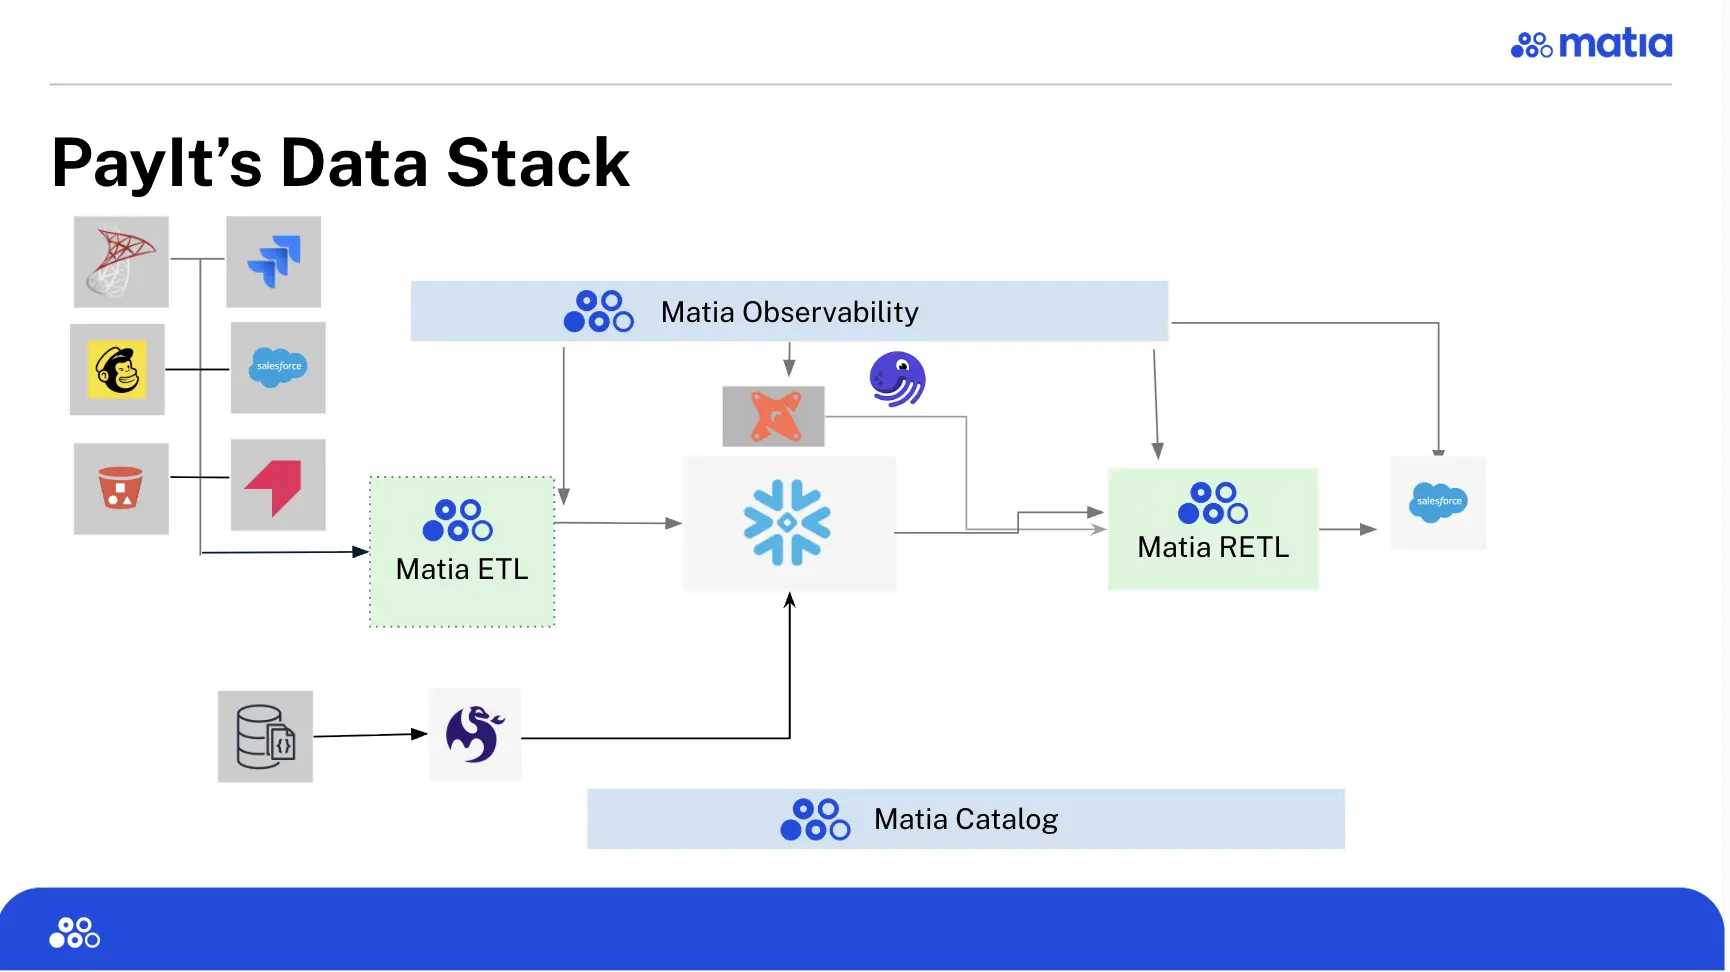
Ramp runs 300 integrations across 50 to 60 external data sources, including Salesforce, Zendesk, and other CRM systems. Matia is the single tool Ramp uses for all of them.
dbt docs that work at thousands of models
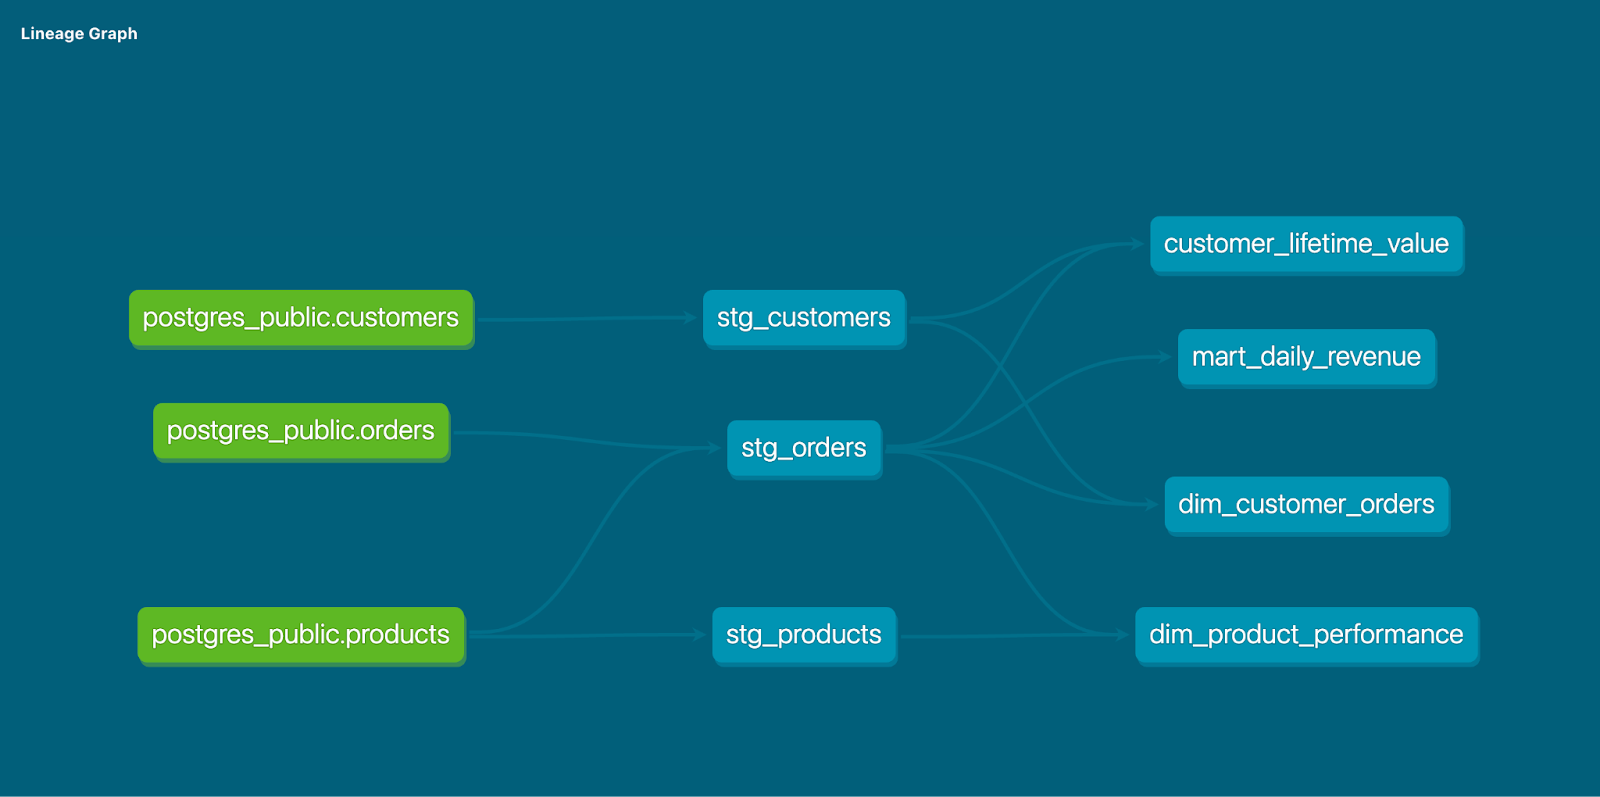
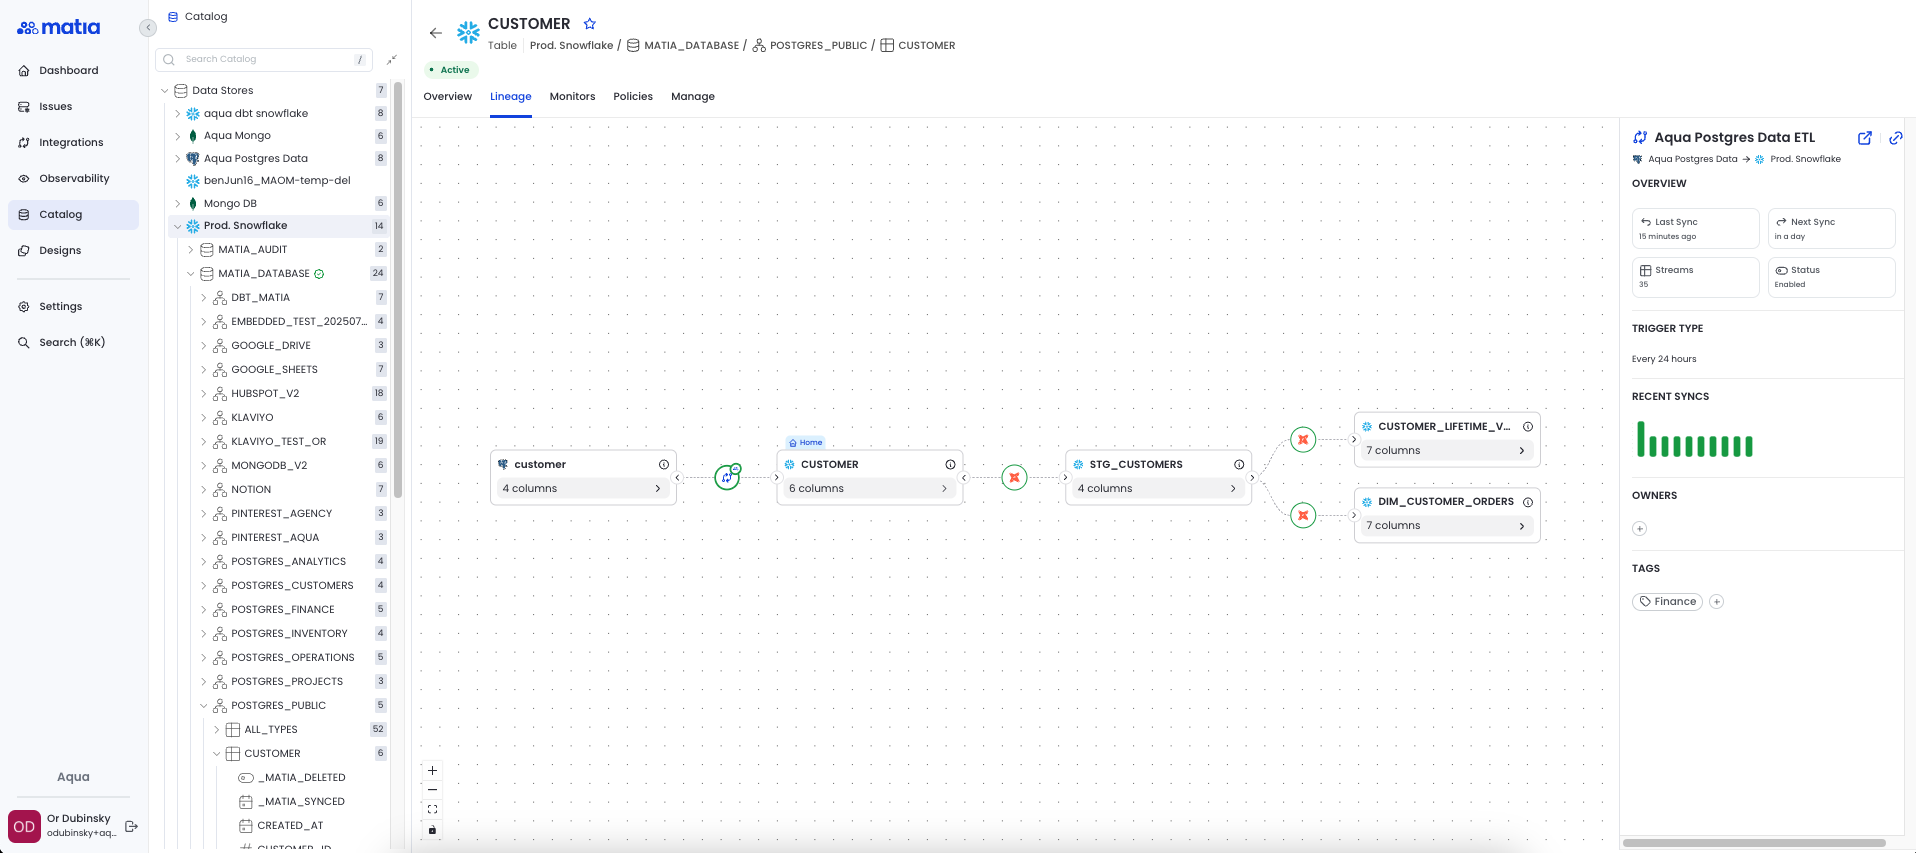
Ramp used to host its dbt docs internally. Once Ramp had thousands of dbt models, the docs stopped working. Ramp now loads its dbt docs metadata into Matia's catalog, where the team can see the full lineage of its dbt models. Ryan calls it "lightning fast," with intuitive views.
Keeping pace with 10x growth
Ramp started using Matia two and a half years ago. Since then, Ramp has grown more than 10x, both in how much data it holds and in how much new data arrives each day.
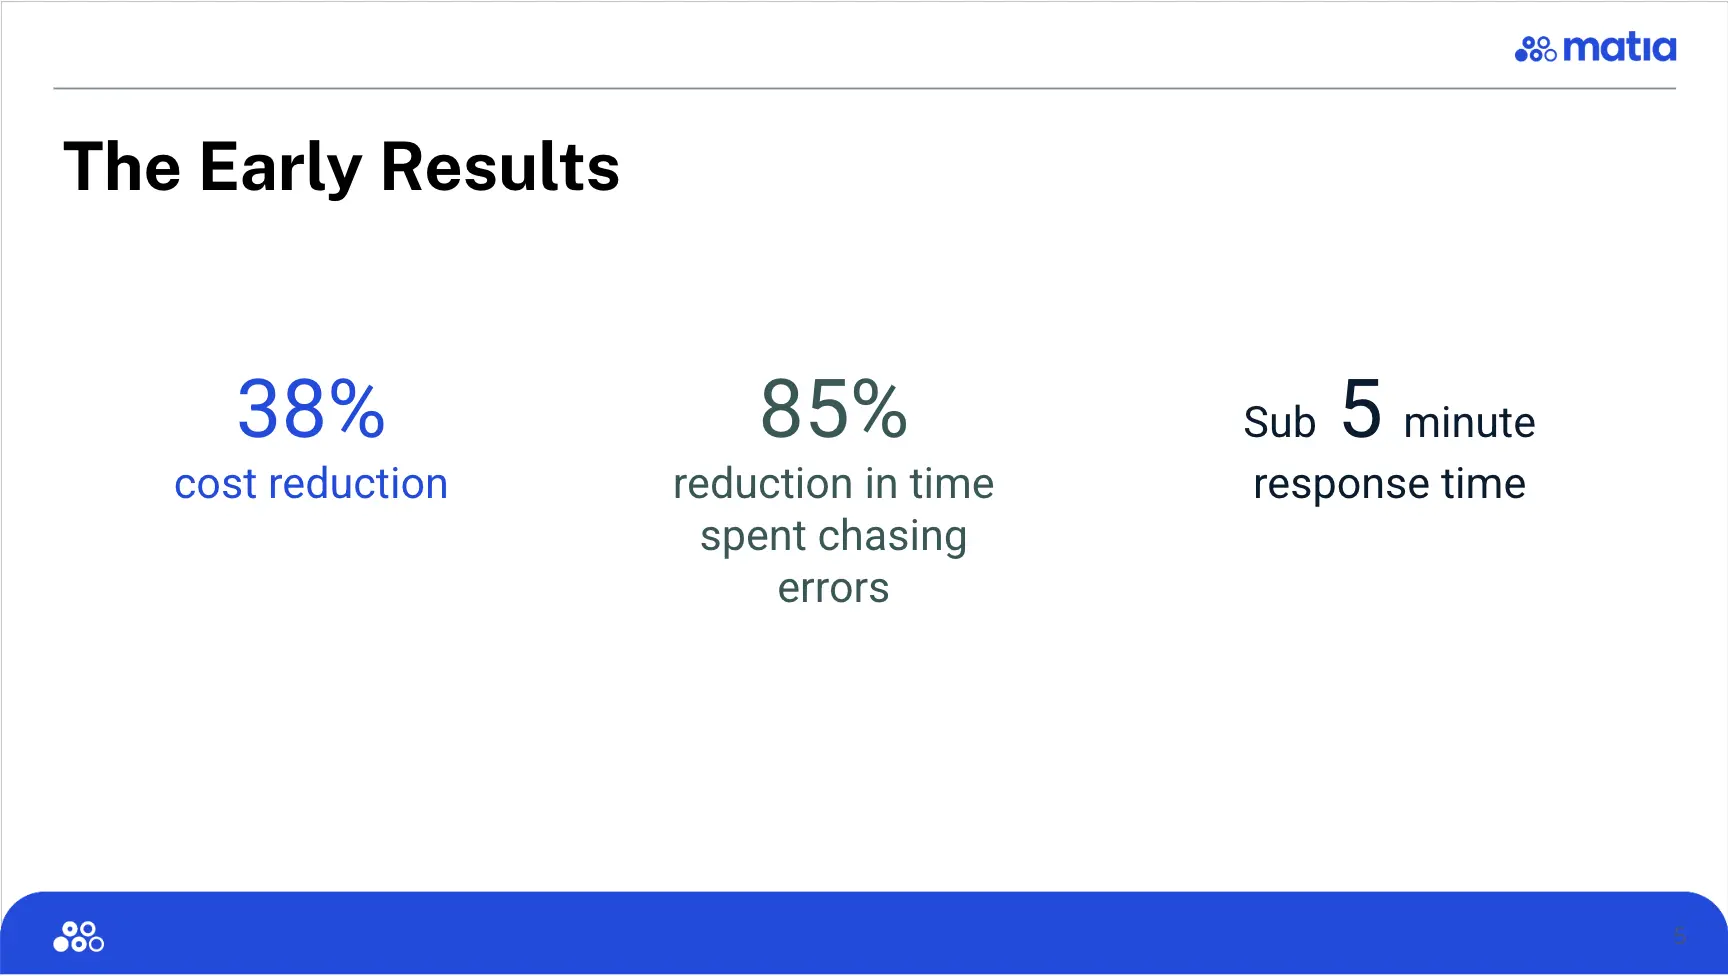
Ryan calls Matia cost-effective, but says the bigger savings come from reliability: the business misses fewer opportunities because the data behind its decisions is there when it's needed.
“When I say literally everyone in the company benefits from the reliability that Matia provides us, that’s not an exaggeration.”
With Matia running the syncs, Ryan's team spends more time building on top of the data and less time maintaining pipelines.
Ramp is an AI-first finance company. Each week, about 1,500 people at Ramp work with Snowflake, either directly or through agents. Ryan Delgado, Head of Data Platform, says Matia is the team Ramp trusts to manage the pipelines into that warehouse.
A Postgres sync that kept failing
Ramp's previous ETL tool couldn't keep up with the throughput Ramp needed. Its most critical sync, from Postgres into Snowflake, failed unpredictably. Each failure meant a full historical restatement of the Postgres database, which sometimes caused outages lasting several days. The problem got worse as Ramp's data grew.
"Matia can sync data a lot faster and then also show more flexibility and resiliency in their sync. That was huge for us."
One tool for 300 integrations
Ramp runs 300 integrations across 50 to 60 external data sources, including Salesforce, Zendesk, and other CRM systems. Matia is the single tool Ramp uses for all of them.
dbt docs that work at thousands of models
Ramp used to host its dbt docs internally. Once Ramp had thousands of dbt models, the docs stopped working. Ramp now loads its dbt docs metadata into Matia's catalog, where the team can see the full lineage of its dbt models. Ryan calls it "lightning fast," with intuitive views.
Keeping pace with 10x growth
Ramp started using Matia two and a half years ago. Since then, Ramp has grown more than 10x, both in how much data it holds and in how much new data arrives each day.
Ryan calls Matia cost-effective, but says the bigger savings come from reliability: the business misses fewer opportunities because the data behind its decisions is there when it's needed.
“When I say literally everyone in the company benefits from the reliability that Matia provides us, that’s not an exaggeration.”
With Matia running the syncs, Ryan's team spends more time building on top of the data and less time maintaining pipelines.
Genius AI's data stack was assembled over 10 years from a mix of vendors, and it was hard to maintain. Brady Allchin, VP of Engineering, wanted the team to deliver a reliable data pipeline to stakeholders inside and outside the company.
24 hours for the most complex pipeline, a few weeks to migrate
"We knew within 24 hours it was the right decision"
Their largest, most complex pipeline was up and running on Matia within 24 hours.
The broader migration took a few weeks. That covered pipelines from internal Postgres stores and external data sources. "
The timeline to migrate to Matia really did surprise me"
Time goes back to the business
Moving to Matia streamlined Genius AI's stack and saved money. It also changed how the data team spends its time. "It now goes to supporting the business instead of keeping our pipelines alive."
Lineage catches upstream changes
Matia's data lineage alerts the team when another part of engineering changes one of their data sources, before it causes a reliability problem for the analytics team. Teams in every department get data on a tight SLA, refreshed and up to date, so they can run the reports they need.
"If you're a data leader and you want to take your team from reactive work to one that's proactive and enabling the business, Matia is the partner that enables you."
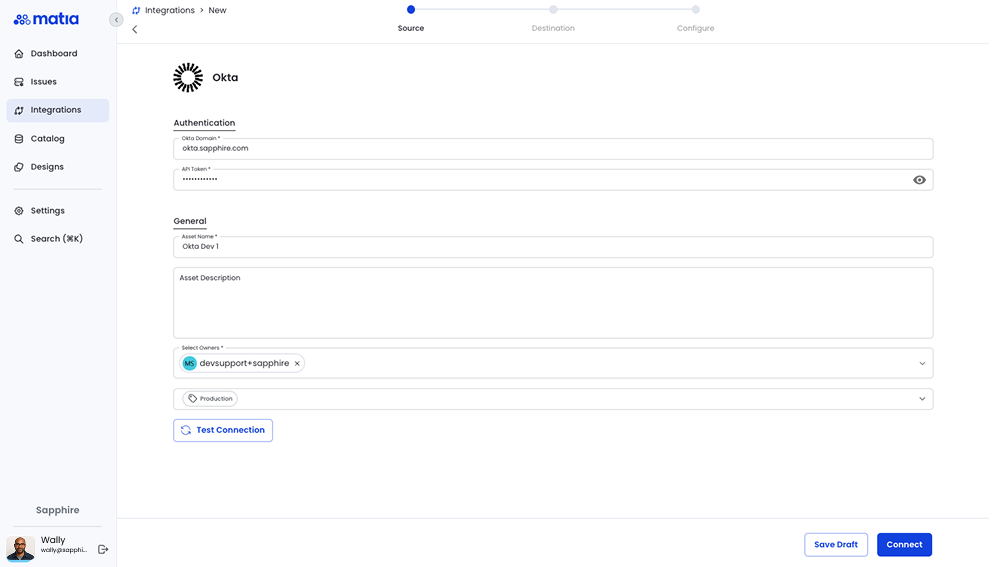
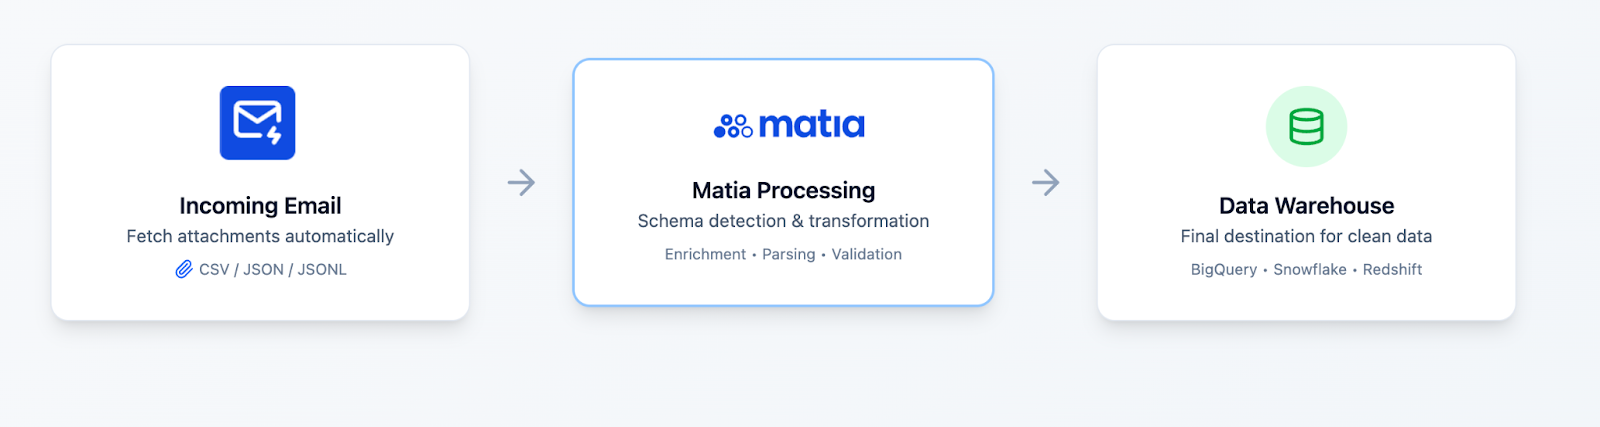
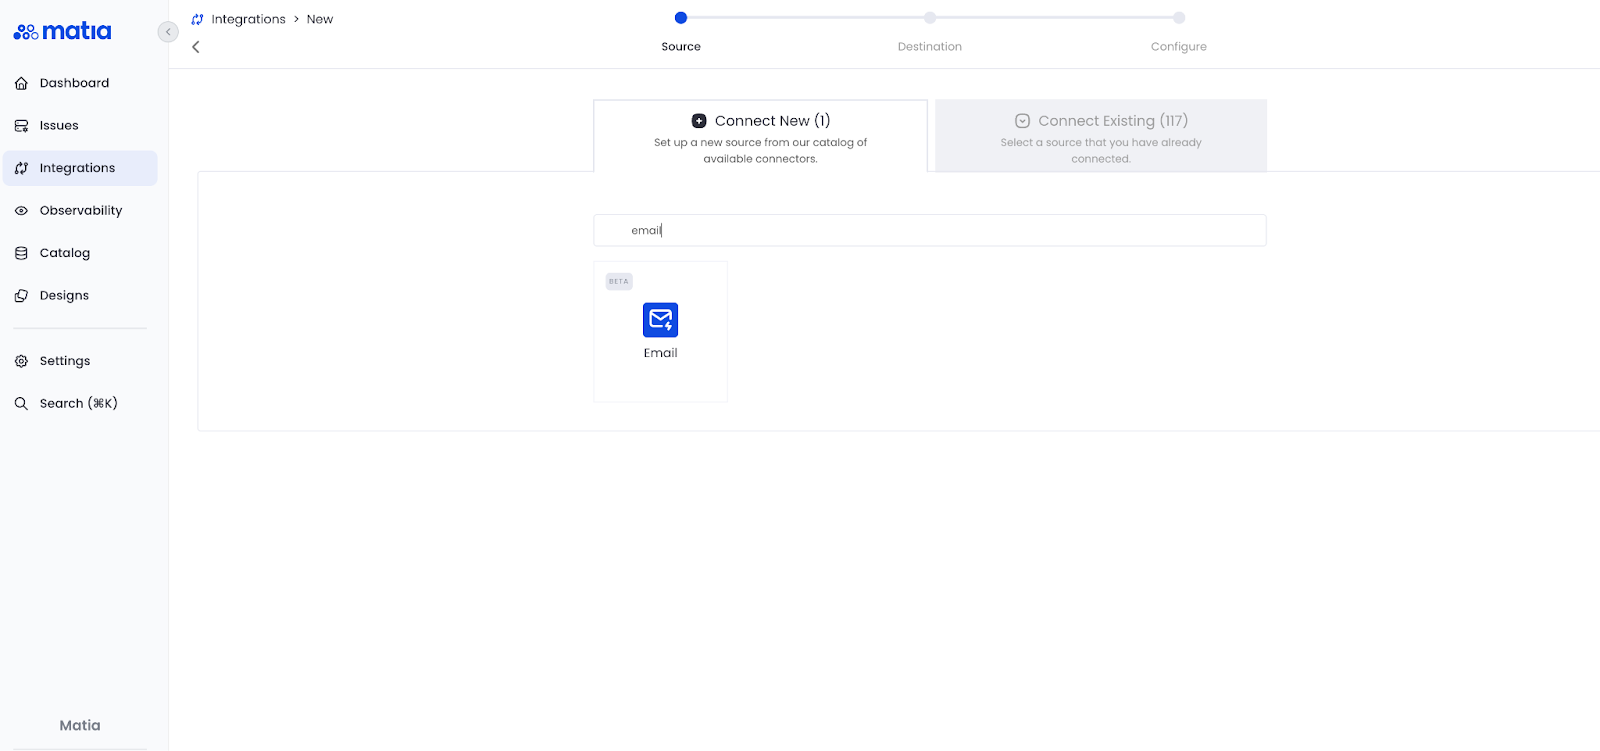
Over a dozen new source connectors shipped this quarter, covering AI ad platforms, enterprise search, survey and research tools, and HR systems. A few call outs, the email connector pulls attachments straight into your warehouse instead of requiring manual forwarding. And the Claude Platform connector lets teams leaning into Claude run analytics on their own usage data. Klaviyo is a new connector. StackAdapt now supports additional objects for ad-tech activation.
Meta Ads Destination lets you build a custom audience during setup instead of creating it separately first. And you can now use S3 as a reverse ETL source, so data landing there doesn't just sit unused.
Meta Ads Destination — Create a Custom Audience in Meta directly during setup. (Reverse ETL)
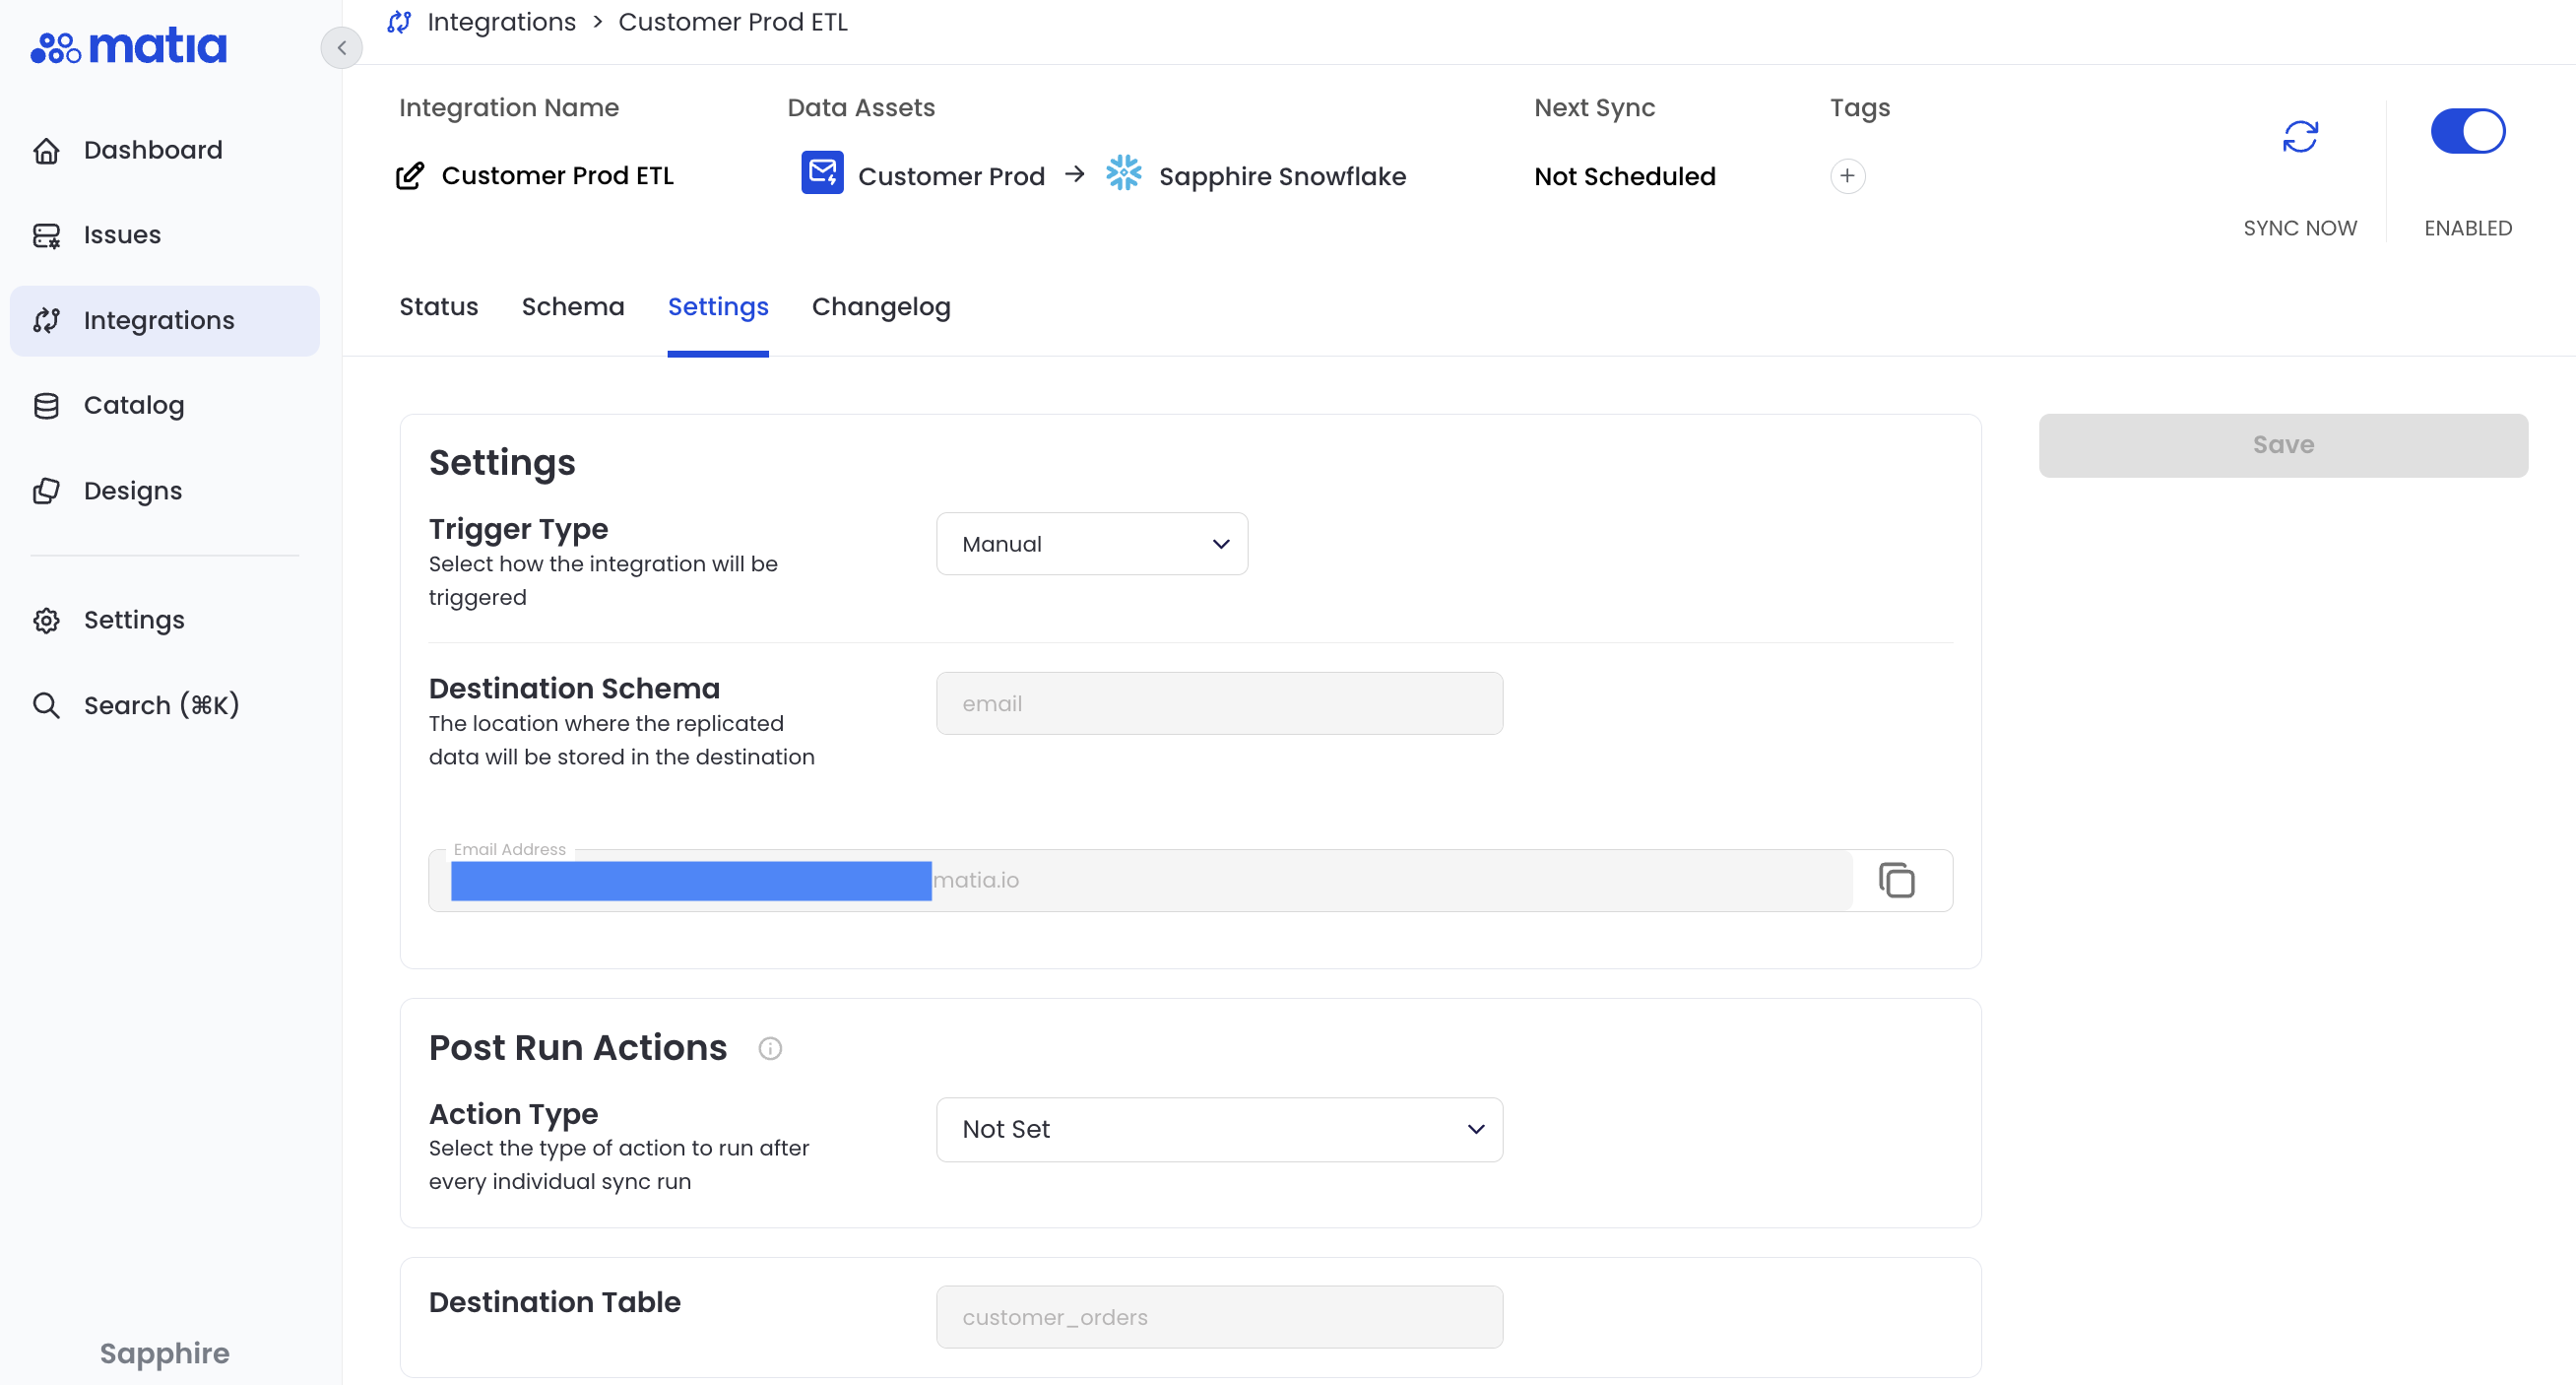
A completed Snowflake sync can now trigger a downstream Snowflake Task automatically. No separate orchestration tool required. And Datadog customers can filter what's ingested using Datadog's own native syntax, instead of pulling in all logs by default.
Snowflake Tasks as a post-run action — A completed sync triggers a Snowflake task automatically, no separate orchestration tool required. (ETL)
Datadog — Filter what gets ingested using Datadog's own native syntax, instead of ingesting all of it by default. (ETL)
Data Quality and Lineage
Custom SQL monitors now support investigation queries and breached row analysis, so you can see the specific rows behind an alert instead of just the fact that it alerted. Lineage error nodes help too: when a referenced node can't be found, usually a permissions issue, it now shows up as an error instead of failing silently. And if Omni is your BI layer, catalog lineage now extends into it, so you can trace a number on a dashboard back to the model that built it.
Custom SQL monitors: investigation queries and breached row analysis — See the exact rows that triggered a monitor breach. (Observability)
Lineage error nodes — When lineage can't find a node, it now shows up as an error instead of disappearing silently. (Catalog)
Omni — Catalog lineage extends into Omni. (Catalog)
BigQuery: Three Pillars, One Connector
BigQuery on Matia now also supports observability, lineage, and reverse ETL on top of ETL. This expansion enables full end-to-end visibility into your BigQuery data, from the moment it lands to the moment it's activated downstream, all without stitching together a separate tool for every stage. No more piecing together your BigQuery stack from three different vendors just to know where your data came from and whether it's still trustworthy.
Enterprise Security and Procurement
Matia now supports customer-managed encryption keys, for security reviews that start with who holds the keys. Matia is also available on Google Cloud Marketplace, so GCP customers can buy through existing procurement and committed spend.
CMEK support — Customer-managed encryption keys, for security reviews that start with who holds the keys. (Platform)
Google Cloud Marketplace — Buy Matia through existing GCP procurement and committed spend. (Platform)
Coming Soon: Matia MCP
Matia MCP connects your AI tools straight to your governed data, so a question becomes an answer without detouring through five systems. It's in private preview now, get Early Access.
We're a unified DataOps platform built for the AI era by combining the power of ETL, Reverse ETL, Observability, and Catalog, because it sucks to have disparate systems and no control over your data stack.
Want us to set you up with a free trial or demo? Reach out here.
More and more teams are standardizing on Snowflake as the foundation for analytics and AI. And once you've done that, the next instinct is sensible: stop juggling a dozen point solutions and consolidate the systems that move, monitor, and activate your data.
Being on Snowflake Marketplace removes the friction from that journey. Instead of standing up four separate tools through four separate procurement cycles, you get unified ETL, observability, reverse ETL, and catalog running in a fraction of the time, with the same trust and governance you already rely on in Snowflake.
In other words: the tool your data team picked in May can actually ship in May.
Better together: Matia + Snowflake
Here's what the partnership unlocks for joint customers:
Streamline the stack. Replace fragmented point solutions with a single platform that runs ETL, observability, catalog, and reverse ETL on top of Snowflake.
Get AI-ready, faster. Trusted, well-governed data with end-to-end lineage, purpose-built for Snowflake Cortex AI and the applications built on it.
Spend less. Customers consolidating onto Matia report up to 61% lower data infrastructure spend compared to maintaining separate tools.
Skip the procurement marathon. Streamlined deployment through Snowflake Marketplace for new and existing Snowflake customers alike.
As our co-founder and CEO Benjamin Segal put it:
"Snowflake is the center of gravity for modern data teams, and customers have been asking for the simplest possible path to run Matia right alongside it. Joint customers can now stand up unified ETL, observability, reverse ETL, and catalog in a fraction of the time, with the trust and governance they already count on in Snowflake."
Speaking of unified foundations…
If "give your data the full picture" sounds familiar, that's because we are on a roll this week. Just yesterday we shared Matia MCP, now in private preview: the fastest path from a data question to an answer, built on the same unified foundation that makes a launch like this possible. The theme is consistent: less tool sprawl, more trust, and a data stack that works with your AI instead of tripping over it.
Trusted by teams who don't have time for tool sprawl
Matia already runs data operations at scale for teams at Ramp, Drata, Honeybook, and Lemonade. This Marketplace listing builds on our mission to unify the modern data stack, helping teams streamline their tools, accelerate collaboration, and operate data systems with the same reliability you'd expect of any modern production infrastructure.
Snowflake Marketplace, for its part, helps companies expand what's possible with data and AI through third-party data, apps, and AI products. With on-platform purchasing and immediate access, it lowers integration costs and streamlines procurement, delivering products directly to the customer's data. You can learn more about finding, trying, and buying third-party products here.
Heading to Snowflake Summit? Stop by Booth 1603 to see the platform firsthand and explore the latest in unified ETL, reverse ETL, observability, and catalog.
You can also catch Snowflake Summit 2026 keynotes live or on-demand here, and follow the latest from Snowflake on LinkedIn and X.
Want to see what unified data operations looks like on top of Snowflake? Book a demo and we'll show you.
Matia now traces lineage through transformations you run inside Snowflake, including stored procedures and dynamic tables. Through Matia MCP, Cortex Code (CoCo) and Cortex Agents can use it too.
It's rolling out now for Snowflake Enterprise edition and above.
Snowflake transformations in Matia lineage
A lot of data teams transform inside Snowflake. A stored procedure merges yesterday's orders into a reporting table. A dynamic table keeps a daily revenue rollup fresh. Until now, those steps were a gap in Matia's lineage graph. You could see the table a procedure wrote to, but not how the data got there.
Matia now reads lineage directly from Snowflake Horizon, with no SQL parsing on our side. Each transformation shows up as its own node between the tables it reads and writes. Column-level edges run through it, so you can follow a single field from source to output. Views and dynamic tables get their own badges, which makes a transformation output easy to tell apart from a plain table.
Impact analysis runs through these nodes too. Change a source table and Matia shows what sits downstream, including everything the procedure feeds.
Check impact before CoCo changes a transformation
MCP is an open standard, so Matia MCP works in any client that supports it. CoCo and Cortex Agents both do.
Say an engineer asks CoCo to rewrite the procedure that builds fct_orders. Before it touches the code, CoCo can ask Matia what depends on that table. Matia comes back with the monitors watching it and the reverse ETL sync that pushes it to Salesforce. It also lists the dashboards that read from it. The engineer approves the change knowing exactly what it touches.
Matia MCP recommends. You confirm every action before anything happens.
Trace a bad answer back to its source
Now the other direction. A Cortex Agent answers a revenue question with a number that looks off. The table it queried was built by a stored procedure.
Matia follows the path back from the output table, through the procedure, to the source table and the Matia sync that loaded it. That's where it finds the freshness monitor that failed at 8 a.m. The agent gets root cause and downstream impact in one answer, instead of piecing it together from separate tools. In our testing, workflows that took an agent ten or more tool calls against single-vendor MCPs took one or two against Matia.
When a question needs live numbers, Matia calls Snowflake MCP and combines the results with its own context.
The operational layer around Snowflake
Matia is the operational data infrastructure around Snowflake. It brings ETL, Reverse ETL, Observability, and Catalog together in one Unified DataOps Platform. Data comes in reliably and gets checked before it lands. Then it goes back out to the tools your business runs on. Snowflake stays your source of truth.
Your favorite AI tools can now ask Matia a question and get a real answer back, right from where you already work.
Matia MCP is now available, Power BI's lineage integration is live, and we've added new connectors to bring even more of your stack into one place.
Our goal is to help you unify your data stack, cut tool bloat, and make it simple to see what's broken, where it started, and how to fix it. This month's releases do exactly that.
Matia MCP Is Live
Plenty of companies are now using an MCP to bolt their tools together after the fact. Matia didn't have to. Our platform was unified from day one: ETL, reverse ETL, observability, and catalog in one place. This month, we launched Matia MCP, which is now available to any customer. Because Matia MCP sits on top of the unified platform, it’s not calling four separate data tools, which means less room for error and more accurate information in one central place.
What the Matia MCP does:
Traces downstream impact: Follow a failing connector through the transformation and the sync to the dashboard it breaks, all in one conversation
Find root causes: Ask about your broken dashboard, and it traces back to the source so you know where the issue started
Flags what's at risk: Ask what a change will affect before you make it, so you see the impact before you decide
Waits for your approval: Matia surfaces the recommendation. Running a sync or toggling a monitor still needs your confirmation, every time.
Matia MCP has rolled out to our customers now, connecting through OAuth with permissions enforced by RBAC, so your agent only sees what your own system access already allows.
Read the full launch post for how it works and what teams are already doing with it, or go straight to matia.io/mcp to book a demo to see it live.
Power BI Lineage Is Live
Power BI joined Matia's Catalog last month, alongside Tableau, Omni, and Hex. Once you connect a Power BI workspace, Matia picks up:
Descriptions. Asset descriptions carry over from Power BI, so you don’t redocument what a report already explains
Lineage. Native Power BI lineage traces relationships between datasets, reports, and dashboards down to the column level, running upstream through Snowflake and Databricks so you can follow a column back to where it started
Usage. Usage metrics land in the Catalog's usage tab, so you can see what's actually being read, not just what exists
If you run change data capture (CDC) on Postgres, you already know the tradeoff everyone quietly accepts: real-time sync is great until it starts competing with your production database for memory, I/O, and CPU. The faster you pull changes out of the Write-Ahead Log (WAL), the more pressure you put back on the database your app depends on.
We shipped a change to how Matia's Postgres connector reads the WAL that breaks that tradeoff. It's faster, a lot faster, but the bigger story is that it's lighter. It asks less of your database while doing more work. Here's the plain version of what changed and why it matters.
A Quick Primer: How CDC actually reads postgres
Postgres doesn't hand you a live feed of every insert, update, and delete out of the box. Every change first lands in the WAL, an append-only log Postgres already uses internally for durability and crash recovery. CDC tools like Matia "tail" that log, translate each entry into a structured event, and ship it downstream to your warehouse, lake, or wherever the data needs to go.
There's more than one way to read that log, and the method you choose has a big effect on both speed and how much load you put on the source database.
The Old Way: Querying the WAL through a cursor
The traditional, widely used approach treats the WAL like a big table you can query. It repeatedly asks Postgres, "Give me the next chunk of changes," and Postgres opens a cursor to hand them back page by page.
It works, and it's the industry-standard approach for good reason: it's simple and predictable. But it has a structural cost. To serve each request, Postgres has to decode a meaningful portion of the log on its own CPU, hold that decoded data in memory, and manage the cursor's state for as long as you're reading. On a quiet database, that's barely noticeable. On a busy, high-write production database, it adds real memory pressure and I/O load to the same machine your application is using.
It can also get in the way of routine maintenance, like building a new index, while a long read is in progress. This is manageable. With careful attention to lock behavior, you can reduce how much a long-running read interferes with other database activity. But it's an extra layer of operational care that the cursor-based approach requires and the streaming approach doesn't.
The New Way: Streaming the WAL directly
Instead of repeatedly asking Postgres for the next batch, Matia's new approach opens a single continuous stream using Postgres's built-in replication protocol. That's the same core mechanism Postgres uses to replicate data to standby servers. Changes flow to Matia continuously as they happen, rather than being fetched in a request/response loop.
This is a fundamentally different relationship with the source database. Postgres decodes and forwards each change once, as part of a lightweight, ongoing conversation, rather than through a series of discrete, resource-intensive queries. The database isn't asked to materialize a large batch of decoded changes and hold it while a client slowly works through them. It just keeps handing off what's new.
We built it as a custom streaming plugin, and it's now available in the Matia Postgres connector.
The Results: Faster, and lighter on the database
We benchmarked both approaches in two environments, a local Postgres instance and Aurora (Postgres-compatible, cloud-managed), each processing change events.
On a local database:
Cursor-based reads: ~124,000 events/sec
Streaming: ~247,000 events/sec, roughly 2x faster
On Aurora, a more realistic, production-like environment:
Cursor-based reads: ~3,000 events/sec (about 5.5 minutes to process 1 million changes)
Streaming: ~12,800 events/sec (about 1.3 minutes for the same volume), over 4x faster
The gap widens in the cloud-managed environment because that's where the old approach's resource overhead hurts most. Network round trips and per-batch decoding compound each other under real-world conditions.
Why This Is More Than a Speed Story
It would be easy to stop at "4x faster" and call it a day. But the more meaningful shift is how that speed is achieved.
The cursor-based approach is fast the way a delivery truck making a hundred separate trips is fast. It gets there, but it burns fuel on every trip. Because it works by having Postgres decode and stage batches of changes for a client to page through, the database has to keep more decoded data in memory and manage more open state, for longer, no matter how quickly the client on the other end consumes it.
For large transactions or backfills, Postgres can end up holding a substantial chunk of decoded WAL in memory at once, just to serve the read.
The streaming approach never asks Postgres to do that. There's no large decoded batch sitting in memory waiting to be paged through. Changes are handed off as a continuous flow and don't need to be staged. That means:
Lower memory footprint on the database, even under sustained high-write load.
Reduced I/O overhead, because the read pattern lines up with how Postgres already produces WAL data, instead of layering extra query-and-fetch cycles on top.
No interference with concurrent database maintenance, like index builds, which the old approach could block during long-running reads.
Faster recovery from replication lag, so if your sync ever falls behind (a deploy, a network blip, a traffic spike), it catches up quickly without leaning harder on the database.
In other words, this isn't just the same job done quicker. It's the same job with a meaningfully smaller footprint on the production system you care most about protecting. For teams running Postgres as a live, business-critical database, not just a batch source, that distinction matters as much as raw throughput, if not more.
The Bigger Picture: Postgres CDC That Respects Your Database
This work is part of a broader investment in how Matia handles Postgres, historically one of the trickiest sources to replicate reliably at scale without disrupting the source system. We've seen customers cut full-database sync times from days to hours by parallelizing large syncs. This streaming change follows the same philosophy for ongoing, real-time CDC: move data fast, but never at the database's expense.
If you're running Postgres CDC today and watching replication lag or database load creep up under write-heavy workloads, this change was built for you.
Want to see how Matia's Postgres connector performs on your workload?Get in touch. We're happy to walk through the benchmarks in more detail.
A revenue dashboard is wrong. The first alert points to a failing dbt test, but the model itself looks healthy. An engineer checks the warehouse and finds a row-count drop. Another team says a source-system release went out earlier that morning. Someone else asks whether the sales audience and customer-facing product are affected too.
At this point, the technical fix may be straightforward. The difficult part is finding it.
Most data incidents do not take a long time to resolve because the team lacks technical skill.
They take a long time because the evidence is scattered. The data engineer has the orchestration logs. The analytics engineer knows which model looks wrong. The application team understands the upstream source. The business owner knows which report cannot be trusted. The information exists, but it lives in separate tools, separate systems, and separate people’s heads.
That fragmentation turns every incident into a scavenger hunt. Responders lose time asking basic questions: What changed? Which table is actually broken? Is the failure upstream or downstream? Who owns the affected dataset? What else depends on it? Can we safely rerun the pipeline, or will we push bad data farther into the stack?
Reducing time to resolution begins by removing those questions from the critical path. Data lineage shows how data moves and what depends on it. Operational context explains how the data is behaving right now. When the two are available together, teams can move from a vague symptom to a tested root-cause hypothesis with much less guesswork.
Why Data Incidents Become Long Investigations
A data incident rarely arrives with a clear root cause. More often, it starts as a signal: a freshness breach, a failed test, a volume anomaly, a schema change, or a stakeholder reporting that a number looks wrong. That first signal tells the team something is unusual, but not necessarily where the problem began or how far it has spread.
A broken dashboard may be caused by a source delay, an ingestion failure, a transformation issue, a permission change, a schema update, or a downstream semantic layer problem. A reverse ETL audience that looks incomplete may reflect a failed model, a changed field value, a late source, or an issue in the activation workflow. The visible symptom is often several steps away from the original failure.
The first source of delay is therefore identification. Before anyone can fix the issue, they need to identify the precise asset that is unhealthy and the data product or workflow that is exposed. The second source of delay is context gathering. Responders pull logs from one tool, inspect dbt artifacts in another, query the warehouse, search for recent pull requests, and message people who might know the owner or business impact. The third source is safe decision-making.
Even after the likely cause is known, the team must decide whether to pause a sync, rerun a job, backfill data, add a warning to a dashboard, or wait for an upstream correction.
These are not separate problems. They are part of the same incident. A fast technical fix is not helpful if the team still does not know who was affected, whether the bad data propagated, or how to prove the system is safe again.
Lineage Shows the Path From Symptom to Cause
Lineage is often introduced as a governance or documentation capability. It is also one of the most practical tools an incident responder can have.
When an alert fires on a dataset, a model, or a metric, the first question is usually, “What feeds this?” Backward lineage gives the team an immediate path from the affected asset to its upstream sources and transformations. Instead of checking every pipeline in the stack, responders can follow the dependency chain: this dashboard uses this semantic model, which depends on this dbt model, which reads from this warehouse table, which is fed by this ingestion sync.
That path narrows the investigation quickly. If the upstream source is fresh and the ingestion sync completed normally, the team can focus on transformation logic or downstream behavior. If the source is late, or the ingestion run shows an error at the relevant time, the investigation can move toward the real cause without spending an hour debugging a healthy downstream model.
Matia’s data lineage capabilities give teams column-level visibility across pipelines, transformations, dbt models, BI tools, and downstream dependencies. For incident response, the value is not simply seeing a graph. It is being able to trace the specific path that connects a bad metric or failed check to the source, transformation, and execution history most likely to explain it.
Lineage also helps teams avoid a common mistake: fixing the first broken asset they can see instead of resolving the issue at the source. Restarting a downstream transformation may make a model look healthy for a moment, but it will not correct a late, incomplete, or structurally changed upstream dataset. A root-cause investigation should begin with the symptom, then follow the lineage until the team finds the smallest plausible cause supported by evidence.
Operational Context Turns a Dependency Map Into an Investigation Workspace
Lineage by itself is not enough. A dependency graph can show that one asset feeds another, but it cannot tell you whether the upstream table is fresh, whether the last run failed, which test started failing, or whether a code change altered the transformation logic.
That is where operational context matters. The most useful information for an active incident includes the last successful update, current freshness status, row counts, recent data-quality results, execution history, errors, transformation definitions, ownership, certification status, and recent changes. These signals help the responder separate a plausible dependency from the dependency that is actually failing right now.
Consider a volume anomaly in an executive revenue model. Lineage may show five upstream inputs. Operational context lets the team see that four inputs updated on time and one source table has not received new records since the previous day. Or perhaps every source is fresh, but the latest dbt run began failing a uniqueness test after a new join was introduced. The graph establishes the search space. The current operational evidence identifies where to look first.
Matia combines lineage with last-updated timestamps, row counts, freshness expectations, code definitions, execution history, data-quality tests, dependency context, and transformation logic. This is what makes operational lineage different from a static documentation artifact. Responders are not asked to jump from a dependency graph into five more tools to understand the event. The information needed to test the leading hypothesis is closer to the incident itself.
Start the Investigation With the Right Questions
When the first alert arrives, it is tempting to ask, “Why did this job fail?” That question is sometimes useful, but it can be too narrow. The better starting point is: What decision, workflow, or customer experience is at risk, and what is the earliest asset that explains the problem?
Begin by confirming the symptom. Is the affected dashboard, data product, audience, or application actually wrong, late, or unavailable? Record the last point at which it was known to be healthy. This gives the investigation a time boundary and prevents the team from chasing unrelated historic issues.
Then identify the specific asset and consumer. “The warehouse is broken” is not an actionable incident statement. “The customer-health model is stale, and the customer-success dashboard and renewal-prioritization workflow depend on it” is. Naming the asset and consumer establishes the scope of the response before the technical details become overwhelming.
Next, trace backward through lineage. Look for recent upstream changes, failed or delayed runs, schema updates, source lag, and changes in transformation behavior. Use execution timestamps, test history, freshness signals, and logs to rule possible causes in or out. The goal is not to inspect everything. It is to reduce the investigation to the shortest chain of evidence that explains the symptom.
This kind of process becomes more important as data powers automated operations. In 2026, a stale or incomplete dataset may affect more than a dashboard. It may feed a sales workflow, a customer communication, a recommendation engine, or an AI assistant. Matia’s 2026 guidance on AI pipeline reliability explains why teams need to investigate the underlying data when an AI workflow begins producing weaker, stale, or inconsistent results. The application may still appear healthy while its inputs have already degraded.
Trace Forward Before You Decide How to Fix It
Once the likely source of an incident is identified, the next question is not automatically “How do we rerun it?” It is “What else depends on this, and what is the safest next action?”
Forward lineage reveals the blast radius. It shows which downstream models, dashboards, reverse ETL syncs, applications, and AI workflows consume the affected asset. That information changes how the team responds. A delay in an isolated staging table may require no action beyond a tracked fix. A delay in a core customer table may mean pausing a downstream activation workflow, labeling a dashboard as stale, and notifying a business owner before the issue causes a bad decision.
Forward impact analysis also helps teams communicate with precision. Instead of sending a generic notice that “data is delayed,” the team can say which workflows are affected, whether a workaround exists, and whether downstream outputs should be trusted. This reduces the noise that surrounds an incident and gives stakeholders the context they need to act responsibly.
Matia’s data-lineage overview describes this backward-and-forward approach in practical terms. Teams can trace from a dashboard, metric, or AI model back to the source and see what breaks when a table, dbt model, or schema changes. In an incident, that turns a vague concern into a concrete impact statement.
Route Alerts So Lineage Gets Used Right Away
Faster investigation is only useful if the right people respond. An alert routed to a shared channel without ownership or impact context often creates a different kind of delay: everyone sees it, but no one is sure who should act first.
Alerts should be routed by data product, severity, and owner, and each one should name the affected asset, the breached condition, and the most relevant downstream impact. A finance model that misses its morning window may need a defined escalation path, while a low-impact anomaly can simply be tracked. With that context in hand, the responder can open the lineage and operational context directly instead of starting from a blank page. Matia’s January 2026 product updates extend this into established on-call workflows, so severity and resolution status stay in sync with the tools the team already uses.
Speed also has to end in a trustworthy result. Resolution is not the moment an alert clears; it is the moment the affected data product is safe to use again. The same lineage paths used to assess the blast radius make it easy to confirm that every downstream model, dashboard, and activation workflow has recovered. For a full walkthrough of validation, closure notes, and post-incident reviews, see our practical guide to data incident management.
Build a Faster System Instead of Relying on Faster Heroics
The goal is not to turn every data engineer into an incident specialist. It is to make the correct path easier to follow when something goes wrong.
Start with the data products where resolution time matters most. A revenue dashboard, a finance model, a high-value customer audience, a critical operational workflow, or an AI-facing feature table are good places to begin. Map the upstream and downstream dependencies. Confirm the owner. Define meaningful freshness, quality, and availability expectations. Make sure the responder can see run history, tests, row counts, recent code or schema changes, and operational lineage from one place.
Then test the process deliberately. Simulate a late source, a failed transformation, a schema change, or a volume anomaly in a safe environment. Measure how long it takes the team to identify the affected asset, find the likely cause, assess the downstream impact, choose a safe action, and validate recovery. The gaps are valuable. They reveal the missing ownership, unclear alert, undocumented dependency, or disconnected tool that is extending resolution time.
Matia’s data observability platform provides the proactive monitoring layer that helps teams detect freshness, volume, schema, and custom business-rule issues early. Combined with operational lineage, it gives responders a clearer path from an initial signal to a verified resolution.
The Fastest Incident Is the One With a Clear Path to Evidence
Data teams cannot eliminate every source outage, schema change, delayed feed, or transformation failure. They can eliminate much of the uncertainty that makes those events expensive.
Lineage provides the route from symptom to source and from source to impact. Operational context provides the evidence that tells responders which part of that route matters now. Alerts and clear ownership bring the right people into the response. Recovery validation confirms that the business is no longer operating on data it cannot trust.
When those pieces are connected, the team spends less time switching tools, asking around, and rerunning pipelines blindly. It can identify the root cause faster, communicate the actual impact with confidence, and make safer decisions about mitigation and recovery.
A dashboard is stale. A revenue metric stops reconciling. A customer audience is missing thousands of records. An AI workflow starts returning weaker results even though the model itself has not changed.
These are not just frustrating data bugs. They are data incidents: moments when data is late, incomplete, incorrect, inaccessible, or otherwise unfit for the decision, workflow, or product that depends on it.
For many teams, the response is still improvised. Someone notices that a number looks wrong, posts a message in Slack, and pulls in whoever might know what changed. The team opens warehouse queries, orchestration logs, dbt artifacts, ingestion tools, and dashboard settings in parallel. Eventually, the issue gets fixed, but the business has already spent hours working around data it could not trust.
A better approach is to treat data reliability as an operational practice. Data incident management gives a team a repeatable way to detect, triage, investigate, mitigate, resolve, and learn from failures in data systems. In practice, that means agreeing on what counts as an incident, detecting it early, assigning clear ownership, following a consistent investigation path, restoring trust before declaring success, and learning from the event without blaming the people involved.
Why Data Incidents Need Their Own Operating Model
A traditional production incident is often obvious. An application is down, a page returns errors, or users cannot complete a workflow. Data incidents can be harder to see. A pipeline can finish successfully while loading yesterday’s data. A model can still materialize after a source field changes, even though an important downstream metric is now wrong. A reverse ETL sync can technically run while delivering an incomplete audience to a customer-facing tool.
That is why “the job is green” is not a meaningful reliability standard. The important question is whether the data arriving at a decision, workflow, dashboard, or model is still trustworthy.
Modern data teams also manage a broader incident surface area. A problem may begin in ingestion, transformation, orchestration, warehouse permissions, a semantic layer, a BI tool, or an activation workflow. It can spread through dependencies before anyone sees the first symptom.
Without a defined process, every incident becomes a search problem: Who owns this table? What changed upstream? Which assets are exposed? And when can stakeholders use the numbers again?
The incident-management discipline used by mature engineering organizations offers a useful starting point: alerts should be timely and actionable, roles should be explicit, communications should be clear, and post-incident learning should improve the system rather than assign fault.
What Counts as a Data Incident?
Not every monitor breach needs an incident channel, and not every failed job affects the business. The practical line is impact. A data incident exists when a problem with quality, availability, freshness, or access affects, or creates a credible risk to, an important downstream consumer.
Freshness incidents occur when data misses its expected window. They can leave finance, operations, or leadership working from stale reporting even when the pipeline itself has not visibly failed. Completeness and volume incidents occur when records are unexpectedly missing, duplicated, or wildly different from a normal range. A sales audience might shrink, a KPI may underreport, or a model may receive incomplete inputs.
Schema and contract incidents happen when a field is added, removed, renamed, or changes type. These are especially dangerous because they can break a transformation outright or quietly degrade a downstream report. Validity and distribution incidents emerge when null rates, value ranges, categories, or business-rule checks drift from expectations. Pipeline-availability incidents occur when ingestion, transformation, or activation workflows cannot complete or reach a dependency. Governance and access incidents arise when ownership, permissions, classification, or connectivity prevents data from being safely used.
These categories give the team a shared vocabulary for triage. They also make it easier to decide which health signals require monitoring. Freshness, volume, schema, and custom business rules are distinct signals; teams that watch only for job failures will miss many of the issues that erode trust most quietly. Matia’s data observability capabilities are built around this broader view of data health, including automated freshness, volume, and schema monitoring alongside custom SQL rules.
Build the Process Before the Next Incident
The goal of an incident process is not to create bureaucracy around every anomaly. It is to remove uncertainty when a problem is real. A reliable process gives the team a consistent answer to four questions: What do we do now? Who decides? What needs to be communicated? And how do we know the data is trustworthy again?
Start by identifying the data products that materially affect the business. This may include revenue and billing models, executive dashboards, customer-facing product data, marketing audiences, operational workflows, and AI feature tables. For each asset, document an owner, an expected update cadence, an acceptable delay, known dependencies, and a short definition of what “healthy” means.
You do not need a perfect catalog before you begin. Focus first on the assets that create the most disruption when they are wrong. A short, practical runbook is more valuable than a long policy document no one opens during an incident. For a freshness failure, the runbook should tell the responder where to check the last successful ingestion, who owns the source, what downstream assets are exposed, when propagation should be paused, and which validation proves recovery. For a schema failure, it should distinguish breaking changes from compatible additions and define the approval path for each.
Matia’s guide to building a schema drift alert system in Snowflake provides a useful technical pattern. It explains why teams need a known schema baseline, a way to categorize changes by impact, an open-and-closed alert lifecycle, and a method for assessing downstream dependencies.
Detect Problems in the Data, Not Only in the Job
Good detection answers one question quickly: Does someone need to act now? An alert that cannot lead to a meaningful next step is noise, not observability.
A balanced monitoring strategy starts with the signals most likely to reveal real data problems. Freshness tells you whether an asset arrived when it was supposed to. Volume and row-count checks reveal missing records, duplicate loads, and implausible spikes. Schema monitoring identifies structural changes before they become silent downstream failures. Custom SQL checks protect the business rules that cannot be left to a statistical baseline, such as a required consent field, a reconciliation threshold, or a critical join-match rate.
The placement of the alert matters as much as the alert itself. A single shared channel may be workable for a small team, but it becomes unmanageable as the asset estate grows. Alerts should be routed by asset ownership, business domain, severity, and integration so that the people who can act receive the signal without overwhelming everyone else.
Matia supports granular notifications and PagerDuty workflows, allowing teams to scope notifications to specific assets, databases, schemas, or tables and connect material events to established on-call processes. That gives the data team a path to escalation without turning every schema update or expected backfill into an emergency.
Triage by Impact Before You Hunt for a Root Cause
When a monitor fires, the temptation is to jump straight into debugging. Resist that instinct. First determine the incident’s scope. Is the issue isolated to a noncritical table, or does it affect an executive dashboard, customer workflow, or external-facing model? Are downstream consumers receiving bad data now, or is there still time to contain the failure?
A simple severity model keeps this decision consistent. A critical incident exists when a customer-facing or business-critical workflow is using data that is unavailable or untrustworthy. A high-priority incident affects a widely used data product but has a safe workaround. A lower-priority incident is contained to a limited group or a noncritical asset. An observed anomaly may still need tracking, but it does not require the same immediate coordination if no consumer is currently exposed.
The labels matter less than a shared definition. The team should be able to say, in plain language, who is affected, whether the data can still be used, and what response is expected. Severity should also change as the evidence changes. A schema issue that first appears isolated may become urgent if lineage shows it feeds financial reporting, customer activation, and an AI feature store.
Assign Clear Roles So the Investigation Does Not Become a Crowd
During a small incident, one person may coordinate, investigate, and communicate. As the impact or complexity grows, separating those responsibilities prevents the response from becoming an unstructured conversation.
The incident lead owns priority, coordinates the response, and decides when to escalate or close. The technical lead directs the investigation and mitigation work. The communications lead keeps affected stakeholders informed with concise updates. The data-product owner explains the business meaning of the asset, acceptable degradation, and the criteria for validation. Additional subject-matter experts can provide warehouse, source-system, dbt, BI, or activation context when there is a clearly defined question to answer.
The key is not the job title. It is clarity. Everyone involved should know who is making the next decision, who is investigating the technical cause, and who is updating people outside the incident channel.
A useful status update is simple: state the impact that is known, the immediate workaround if there is one, the action currently under way, and the time of the next update. Avoid broadcasting untested theories. Stakeholders need to know whether they can act on the data and when they will hear more; they do not need every debugging detail.
Investigate From the Symptom to the Smallest Plausible Cause
A weak investigation opens every available tool and searches for anything unusual. A strong investigation narrows the search using a repeatable path.
First, verify the symptom. Confirm that the dashboard, data-quality check, or downstream workflow is actually affected, and record the last time it was known to be healthy. Then identify the affected asset and consumer. Name the table, model, metric, dashboard, audience, or AI workflow at risk. Avoid vague reports such as “the warehouse is broken.”
Next, trace backward. Use lineage and run history to identify immediate upstream dependencies, recent deployments, schema changes, and failed or delayed jobs. Then trace forward to estimate the blast radius. Determine which downstream tables, dashboards, reverse ETL syncs, or models rely on the affected asset. This helps the team separate the visible symptom from the true scope of the event.
Once the likely path is clear, test the leading hypothesis with evidence. Look for a source lag, changed column type, failed test, permissions change, replayed batch, or transformation regression. Then select the safest mitigation: correct the source, pause propagation, restore a known-good state, rerun a partition, or backfill only after you understand the cause well enough to avoid reintroducing bad data.
Data lineage in Matia is particularly useful during this stage. It helps teams move from a broken downstream metric to the upstream table or transformation that likely caused it, while showing the dashboards, models, and activation workflows exposed to the same change. That is the difference between fixing the first visible symptom and resolving the incident at its source.
Contain the Problem Before It Creates More Cleanup Work
The first instinct in a data incident is often to rerun the pipeline. That can be the right answer, but only after the team decides whether it will reproduce or propagate the bad state.
Containment protects downstream consumers while the investigation continues. Depending on the failure mode, that could mean pausing a suspect ingestion or reverse ETL sync, holding a dashboard refresh, adding a visible data-quality notice, preventing a stale table from flowing into an AI workflow, or restricting access until a governance issue is resolved.
The right containment action is the one that reduces risk without creating a larger recovery problem. If a source is known to be incomplete, rerunning the pipeline may only push the same bad state farther downstream. If a schema change has broken an important transformation, a controlled hold can be safer than allowing an incomplete table to refresh downstream dashboards. The team should record the decision, the decision owner, and the time the action was taken so recovery is easier to validate later.
Matia’s data ingestion platform connects pipeline behavior with observability signals, helping teams detect anomalies as data moves and investigate relevant operational logs without treating ingestion and quality as entirely separate problems. Matia’s Issues & Notifications approach also brings integration, observability, and catalog issues into a centralized workflow, making it easier to see whether many alerts share one upstream cause.
Restore Trust, Not Just a Green Status
A job’s successful completion is an operational milestone, not necessarily a resolution. An incident is resolved only when the team can demonstrate that the affected data product meets its agreed expectations again.
Validation must match the original failure mode. After a freshness problem, confirm that the data has arrived within its expected window and that downstream dependencies have caught up. After a completeness issue, reconcile counts and business keys against a reliable source. After a schema incident, confirm the intended contract, transformation behavior, tests, and downstream consumers. After a reverse ETL issue, verify the delivered audience or operational record set—not only the sync status.
A strong closure note captures the final impact statement, the technical cause, the containment and recovery actions, the validation performed, and any follow-up work that remains. This prevents “resolved” from becoming shorthand for “the alert stopped.”
Learn From the Incident Without Looking for Someone to Blame
The post-incident review should ask how the system and process can improve, not who deserves blame. Data incidents commonly emerge from reasonable local changes interacting with undocumented dependencies, unclear ownership, incomplete monitoring, or a workflow that made the safe choice difficult.
Keep the review proportionate to impact. A critical incident may warrant a structured review with affected stakeholders. A recurring low-impact alert may require only a short written analysis and a monitoring adjustment. In either case, assess whether detection came early enough, whether responders had the context they needed, whether containment was safe and fast, and whether stakeholders received accurate updates.
Useful follow-up work often falls into a few patterns. You may add a freshness or custom business-rule monitor, tune an anomaly threshold, improve asset ownership, tag critical data products, document a data contract, clarify a rollback step, or define a communication template. The action item should have a clear owner and a completion date; otherwise, the same incident will return as an unwelcome surprise.
A modern data catalog supports this work by centralizing metadata, ownership, tags, and column-level lineage alongside operational context. The result is not merely a better incident response. It is a team that can make changes with more confidence before an incident occurs.
Start With One Critical Data Product
You do not need a fully staffed data reliability function to build this practice. Choose one business-critical data product and work through the process end to end. Define its owner and service expectation. Add freshness, volume, schema, and one meaningful business-rule check. Establish one route for material alerts. Write a one-page runbook. Then practice with a safe test scenario: delay a feed, introduce a schema change in a nonproduction environment, or simulate a volume drop.
The exercise will expose the gaps quickly. You may discover that no one owns a critical dashboard, lineage stops at the warehouse, an alert has no clear action, or stakeholders need a more predictable communication cadence. These are valuable findings. Each one is an opportunity to turn data reliability from a heroic response into a system the whole business can trust.
Data Incident Management Is How Data Teams Earn Trust
Reliable data is not the absence of anomalies. It is the ability to recognize a meaningful problem early, understand who and what it affects, respond with discipline, and restore confidence with evidence.
For modern data teams, that requires more than a ticket queue or another Slack channel. It requires observability that sees data health, lineage that reveals dependencies, ownership that clarifies decisions, and an incident process that turns those signals into action.
Matia brings ETL and ingestion, data observability, catalog context, and lineage closer together so teams can spend less time assembling evidence across disconnected tools and more time protecting the data products their business relies on.
If your team is ready to make data incidents easier to detect, investigate, and resolve, book a demo with Matia to see the unified DataOps platform in context.
A revenue dashboard can be polished, well-governed, and technically available while still leading the business in the wrong direction. The numbers may be from yesterday when leadership believes they are from this morning. A sales team may prioritize accounts using a customer list that missed the latest product activity. A marketing audience can look complete while excluding new high-intent buyers. An operations team can respond to an inventory or support issue after the moment to act has passed.
None of these failures necessarily begin with an error message. The pipeline may be green. The table may exist. The dashboard may load in seconds. The problem is that the data is no longer current enough for the decision being made.
That is the hidden cost of stale data. It rarely announces itself as an outage. Instead, it quietly changes the quality of decisions, creates workarounds across teams, and weakens confidence in the systems the business depends on. By the time someone asks why a number looks wrong, the decision may already have been made.
For modern data teams, freshness is not simply a technical metric. It is an agreement about how current a dataset needs to be before it can safely support a particular use case. A daily finance close has a different freshness requirement than a real-time fraud workflow. An executive report may tolerate a two-hour delay during the day but not before a board meeting. A customer-support copilot can be technically online while still being harmful if it summarizes yesterday’s queue instead of today’s.
The job is not to make every dataset real time. It is to define what “current enough” means for the data products that matter, detect when that expectation is no longer being met, and make the impact visible before stale data turns into a business problem.
Why Stale Data Is More Dangerous Than a Failed Pipeline
A failed pipeline creates an obvious interruption. The team sees the error, opens an incident, and begins to investigate. Stale data is more subtle because the underlying workflow can continue to appear healthy.
A source system may stop publishing updates on schedule. A replication process may start lagging. A sync may run successfully while reading an older snapshot than expected. A downstream transformation can still complete and a BI tool can still refresh. Every individual component may report success even though the final output no longer represents the current state of the business.
This gap between operational success and decision readiness is where stale data creates risk. A dashboard is not valuable merely because it renders. A customer audience is not useful merely because it loads. An AI workflow is not reliable merely because it returns an answer. Each one is useful only if the underlying data meets the freshness expectation of the decision it is meant to support.
This distinction has become more important as data moves beyond reporting into automated and semi-automated workflows. Account prioritization, customer communication, inventory decisions, revenue forecasting, recommendation engines, and internal AI assistants can all act on data without waiting for a human to notice that a pipeline has drifted behind. A delay that once caused a frustrated analyst can now affect an entire operating process.
Matia’s data observability platform helps teams monitor freshness alongside volume, schema, and custom business rules, giving them a view of data health that goes beyond whether a job completed.
The Cost Does Not Show Up as One Line Item
The most expensive consequence of stale data is rarely an obvious infrastructure bill. It appears in the decisions people make while assuming the data is current.
For finance teams, freshness failures can distort close processes, cash planning, budget monitoring, and revenue reconciliation. A number that is only a few hours late may appear small in isolation, but it can create a chain of manual checks, conflicting explanations, and delayed reporting across the organization. The direct issue is late data. The larger cost is the time spent figuring out which number is trustworthy.
For sales and customer-success teams, stale data creates a different problem. Reps may work outdated account lists, miss recent intent signals, or act on customer attributes that no longer reflect the relationship. Customer-success teams can prioritize the wrong accounts because a product-usage feed or support signal arrived too late. These are not always visible as data failures; they may look like a weaker campaign, lower conversion, or a missed renewal opportunity.
For marketing teams, stale data can produce both waste and missed opportunity. An audience may exclude people who just converted, include customers who should have been suppressed, or miss newly qualified prospects. The campaign may still launch and the automation may still run, but the business is spending effort and budget based on an old version of reality.
Operations teams feel the impact in timing. When demand, fulfillment, support, or inventory data arrives late, the team loses the chance to respond early. A delay changes the decision window. The business may still make a reasonable choice, but it makes that choice later, with less context, and often with more manual coordination.
The same pattern now extends to AI. An internal assistant may confidently summarize stale tickets. A recommendation system may miss recent customer behavior. An account-intelligence workflow may use an older customer profile even though the application itself seems healthy.
Matia’s 2026 perspective in When AI Quality Drops, Look at the Data Pipeline First is especially relevant here: a pipeline can be green while the downstream system is already working from an outdated view of the world.
Freshness Is a Business Expectation, Not One Universal SLA
Teams often make freshness difficult by treating it as a single platform-wide objective. In reality, the right freshness expectation depends on the data product and the decision it supports.
A product analytics dataset used for weekly trend analysis may be healthy with a daily refresh. A sales-routing workflow may need updates within minutes. A finance model may require data to be complete and reconciled by a specific time each morning. A customer-facing AI workflow may need both low latency and a clear policy for what to do when a critical dependency is late.
The important step is to make the expectation explicit. For each critical dataset, teams should define the expected arrival cadence, the latest acceptable availability time, the timestamp that represents freshness, and the consumer or workflow that is exposed if the data is late. This creates a common language between the data team and the business. Instead of debating whether a pipeline is “slow,” the team can identify whether a particular data product has crossed the point at which it is safe to use.
A good freshness definition also distinguishes between a small delay and a decision-blocking delay. A dataset may be late but still usable for some purposes. Another may need to trigger a visible warning, halt an activation workflow, or route to an on-call responder as soon as it crosses the agreed threshold. The response should match the business consequence, not merely the duration of the delay.
This is where data teams can avoid a common mistake: chasing real-time performance where it has no business value while under-monitoring the data products where a modest delay creates real risk. Freshness management is a prioritization exercise. It is about protecting the moments when the business cannot afford to operate on an old view of reality.
Monitor the Data Timestamp, Not Just the Last Successful Run
A last-successful-run timestamp is useful, but it is not enough. It tells you that a workflow finished, not that the right data arrived.
Consider an hourly ingestion process that completes on time but reads a source that has not published new events since the previous day. The run status is green. The data volume may even look normal if the pipeline reprocesses existing records. But the event time inside the dataset reveals the real issue: the data is old.
For freshness monitoring to be meaningful, teams need to identify the timestamp that best represents the availability of the business event. In some cases, that is an event timestamp from the source. In others, it is the time a record was updated, an ingestion watermark, a warehouse load time, or the completion time of a transformation that produces the final data product.
The choice should be intentional. Monitoring warehouse load time alone can make a late source look fresh. Monitoring event time alone may make a healthy batch process look late if the data naturally contains older events. The right signal reflects both the type of data and the promise made to the consumer.
Once the signal is defined, compare it with the expected cadence and grace period. A freshness monitor should answer a practical question: Is this dataset current enough for the workflow that depends on it right now? That question is more useful than a generic “did the pipeline run?” check because it connects data operations to a business decision.
Make Freshness Alerts Actionable or Do Not Send Them
An alert is valuable only when the receiver can do something with it. If every small delay is sent to a shared channel without context, people stop trusting the signal. Eventually, the alert system becomes another source of noise and the critical freshness issue gets buried among expected backfills, planned maintenance, and harmless timing variations.
Actionable freshness alerts begin with ownership. The person or team receiving the notification should have enough information to investigate the source, verify the effect, or escalate to the right owner. The notification should identify the affected data product, the expected freshness threshold, the observed lag, the likely downstream consumers, and the first place to look for context.
Routing matters too. A delay in a marketing audience should not necessarily wake the same responder as a delay in a financial close dataset. Notifications should be scoped by asset, business domain, severity, and operational responsibility. That makes it possible to protect critical workflows without turning every normal variation into an incident.
Matia’s enterprise notification upgrades are built around this need for precision, allowing data teams to scope notifications to specific assets, databases, schemas, or tables and connect material issues to established on-call processes. The goal is not more alerts. It is faster, clearer action when a freshness promise is actually at risk.
Use Lineage to Measure the Real Blast Radius
The immediate question after a freshness breach is often, “What is late?” The more important question is, “What decisions and workflows are exposed because it is late?”
A customer table may feed a dashboard, a dbt model, a sales audience, a support workflow, and an AI feature table. If the source misses its cadence, the effects are not limited to the table itself. Each downstream consumer may have a different tolerance for delay and a different safe response. The dashboard may need a visible warning. The activation workflow may need to pause. The AI system may need to stop using a stale input or fall back to a safer response.
Matia’s data lineage overview shows how lineage can connect dependency analysis with execution history, data-quality context, freshness indicators, and other operational evidence. That makes it easier to move from a raw alert to a meaningful impact statement: this source is late, these workflows are exposed, this is the safe action, and this is who needs to know.
Decide in Advance What Happens When Data Is Late
The most mature response to stale data is not always to rerun a pipeline. It is to choose the safest action based on the use case.
For an executive dashboard, the right response may be to display a clear “data current through” timestamp and a visible notice that the latest update is delayed. That gives leaders the context they need to interpret the numbers instead of assuming false precision.
For a marketing or sales activation workflow, the right response may be to hold the sync until the source data is current. Sending an incomplete audience or overwriting current account information with stale records can be more damaging than delaying the workflow for a short period.
For a financial or operational process, the response may be to use a known-good snapshot with explicit labeling while the team resolves the delay. For AI or automated decision systems, the response may be to prevent the system from relying on a stale dependency, reduce the scope of the output, or route the user toward a safer fallback. The key is that the team decides these behaviors before the incident, not in the middle of a high-pressure investigation.
This is why freshness must be connected to ownership, lineage, and operational runbooks. A threshold without a response plan is only an alarm. A freshness standard with clear actions becomes a reliability practice.
Build Trust by Making Freshness Visible
The goal of freshness management is not to persuade every stakeholder to think like a data engineer. It is to make the state of the data clear enough that people can make better decisions.
That begins with transparency. If a business-facing dashboard is based on data through a certain time, show it. If a metric is delayed, say so before someone builds a strategy around it. If a workflow has been paused to prevent bad data from spreading, communicate the reason and the expected next update. These practices may feel small, but they protect trust because they replace hidden uncertainty with useful context.
The data team also earns trust by closing the loop. When a freshness issue is resolved, validate that the data is truly current, that downstream models have caught up, and that the affected workflows have returned to a safe state. A successful rerun is not always a resolution. The business needs evidence that the data product is ready to use again.
Over time, this creates a healthier relationship between data teams and their stakeholders. Rather than being pulled into reactive questions about why a report looks different, the team can set clear expectations, surface risks early, and help the business understand when a number is decision-ready.
Stale Data Is a Reliability Problem, Not Just a Timing Problem
A few minutes of delay may be harmless for one dataset and costly for another. The difference is not the clock alone. It is the decision that depends on the data and the consequence of acting on an outdated version of reality.
The hidden cost of stale data is the compound effect of misdirected effort, delayed responses, manual reconciliation, lower confidence, and automated systems acting without current context. Those costs are difficult to see when every pipeline is evaluated only by whether it completed. They become clear when freshness is treated as a reliability standard for the data products the business relies on.
Matia brings observability, lineage, alerting, and data movement closer together so teams can identify freshness issues earlier, understand the affected workflows, and prevent stale data from quietly undermining business decisions.
If your team is ready to make freshness visible and actionable across the data stack, book a demo with Matia to see the unified DataOps platform in context.
dbt Is the Transformation Layer, Not the Whole Health Signal
dbt gives analytics engineers a disciplined way to define transformation logic, manage dependencies, and validate data through tests. It is foundational to a reliable analytics stack. Yet the transformation layer is only one part of the operating picture.
A dbt project can run successfully while the data it produces is still not fit for use. A source may arrive late. A model may take far longer than normal to complete. A volume change may indicate a broken ingestion process even when the job itself reports success. A downstream dashboard, activation workflow, or executive report may already be affected by the time a team sees the issue.
That is why dbt data observability matters. It brings dbt tests, model runs, freshness, data behavior, and downstream impact into one operating view. The objective is not to generate more alerts. The objective is to help the person responding to an issue understand what changed, how serious it is, where it started, and what needs to happen next.
In practice, dbt data observability means monitoring tests, models, execution patterns, freshness, data behavior, and lineage context together so teams can identify and resolve issues before unreliable data reaches the business.
Why dbt Tests Alone Do Not Define Pipeline Health
dbt tests are essential. They allow teams to encode expectations about data, such as whether a field must be present, whether a key must be unique, whether a value is accepted, or whether a record should match a related model. These assertions make data-quality expectations explicit and repeatable.
But a passed test does not necessarily mean that the pipeline is healthy. Tests validate the conditions they were designed to validate. They may not tell you whether source data arrived within the expected window, whether model runtime has degraded, whether a data-volume change is unusual, or whether a schema change will affect a downstream process.
A complete view of pipeline health includes quality, execution, freshness, behavior, and impact. Quality signals explain whether declared expectations were met. Execution signals show whether models and jobs completed successfully and within an expected timeframe. Freshness signals establish whether the data is current enough for the use case. Behavioral signals surface unexpected changes in volume, schema, or business metrics. Lineage explains where an issue began and which downstream assets could be affected.
That broader view answers a question that a test result alone cannot: is the data product actually safe to use right now?
Make Test Monitoring Operational
The best place to begin is with the tests that protect your most important data products. Revenue reporting, finance close, customer-facing applications, sales activation, and operational workflows usually require a higher standard of coverage and response than lower-risk exploratory work.
A failed test should be more than a red status. The responder needs to know which test failed, what model or source it applies to, when the issue started, how many records are involved, and whether the failure is getting worse. If a failure represents a business-critical condition, the alert should route to an owner who is prepared to investigate. If the issue is lower risk, it may be better handled as a ticket or scheduled follow-up instead of an immediate interruption.
This distinction is important because alert fatigue reduces trust in every monitoring program. When every test failure creates the same level of urgency, teams eventually stop treating alerts as meaningful. Severity should reflect the impact of the affected data product, not simply the existence of a failed assertion.
For high-priority tests, make the next step obvious. The responder should be able to move directly from the alert to the affected dbt model, the failing records, the recent run history, and the upstream data source. That is how test monitoring becomes an operational workflow rather than a report someone checks after users notice a problem.
Matia’s dbt integration helps bring model and job metadata, test results, run history, and orchestration dependencies into a shared operational context. With that context in place, teams can distinguish a data-quality failure from a transformation failure and route the issue to the right owner more quickly.
Treat Model Runs as a Reliability Signal
A dbt job status is useful, but it does not tell the whole story. A job that succeeds late can be just as damaging as a job that fails if a downstream dashboard, report, or activation workflow depends on a timely result.
Monitor model status, runtime, error patterns, retry behavior, and job history for critical workflows. Establish a baseline for normal performance, then investigate meaningful deviations. A model that typically completes in five minutes but suddenly requires twenty minutes may point to an upstream data spike, warehouse pressure, a new dependency, or a transformation pattern that needs attention.
This approach helps teams move from reactive debugging to early detection. Instead of waiting for a hard failure, they can identify a pipeline that is becoming slower, less predictable, or more fragile. Over time, model runtime becomes a useful indicator of the health of the data system as a whole.
It also helps to distinguish between failure types. A failed model may require an analytics engineer to resolve a SQL error, warehouse permission issue, or broken dependency. A failed data test may require a source owner or business stakeholder to validate a genuine change in the data. Good monitoring makes this difference clear so alerts reach the right person with the right context.
Monitor Freshness and Data Behavior, Not Just Hard Failures
Some of the most damaging data incidents are not caused by a failed query. They are caused by late source delivery, an incomplete ingestion run, duplicated batches, missing records, a changed schema, or a key metric that shifts far outside its normal range.
Freshness is especially important for time-sensitive data products. A dashboard can look correct while still presenting yesterday’s information. A customer segment can be technically valid while missing today’s activity. An activation workflow can continue running while it is based on stale data. For each critical source and model, define what “current enough” means for the business use case and monitor against that expectation.
Then extend coverage to behavioral signals. Monitor volume when sudden increases or drops could indicate an upstream issue. Monitor schema when a removed or altered field could interrupt downstream transformations. Monitor business-critical metrics when a change in data distribution could represent a pipeline issue rather than a real business event.
Not every variation should become an urgent alert. The goal is to create thresholds that identify changes worth investigating. A useful alert includes the affected resource, the observed behavior, the expected range or threshold, the time of detection, the likely owner, and a direct path to the context needed for diagnosis.
Reliable freshness monitoring starts upstream. Connecting your transformation monitoring to the health of your data ingestion workflows helps teams see whether a stale model is caused by dbt itself or by a source that never arrived as expected.
Use Lineage to See Impact and Find the Root Cause Faster
When something breaks, the first question is often not how to fix it. It is where to start. Without lineage, teams may have to reconstruct dependencies manually across ingestion jobs, source tables, transformation models, business intelligence tools, and activation destinations.
Lineage provides the investigation path. It shows whether a problem originated in an ingestion sync, a source table, a transformation model, or a downstream delivery step. It also reveals the blast radius. That means a responder can quickly see which dashboards, models, audiences, or applications may inherit the issue.
This is particularly valuable when your data workflow spans several systems. Ingestion may complete in one product, dbt transformations may run in another, and data activation may happen on a separate schedule. When the dependencies are disconnected, incident response depends on manual context switching. When the dependencies are visible together, the team can diagnose the workflow as it actually operates.
Matia Data Lineage gives teams a clearer path from an alert to the upstream dependencies and downstream assets that matter. Combining lineage with run history, logs, and ownership information turns a generic failure into an investigation that can begin with context instead of guesswork.
A Practical Framework for dbt Data Observability
Start by identifying the data products that cannot tolerate bad or late data. These are often the models and workflows connected to executive reporting, financial processes, customer experience, sales operations, marketing activation, or other time-sensitive decisions.
Assign an accountable owner and define the freshness, quality, and availability expectations for each one.
Next, classify your dbt tests by business impact. Critical tests should represent conditions that require prompt action. Informative tests should still be visible, but they may not need an immediate alert. This simple prioritization helps teams focus on issues that could materially affect the business.
Then establish normal execution behavior for priority workflows. Track job completion, model runtime, failures, and retries. The goal is to recognize when a pipeline is degrading before it misses an agreed delivery window.
Add freshness and behavioral monitoring for the conditions that static tests do not fully cover. Source freshness, model freshness, volume, schema, and custom business metrics all help catch issues that may otherwise remain invisible until a downstream user notices them.
Finally, connect every alert to lineage, logs, run history, and ownership. A responder should not have to search through multiple tabs to determine which asset is affected or who is responsible. The monitoring workflow should make the next action clear from the moment an issue is detected.
How a Unified View Changes Incident Response
Consider a common scenario. A revenue dashboard is missing today’s activity. In a fragmented stack, an engineer may begin by checking the dashboard, querying the warehouse, inspecting the latest ingestion run, opening dbt logs, checking test history, tracing a model dependency, and messaging the team that owns the source. Each handoff adds time and uncertainty.
In a unified monitoring view, the investigation begins with the operational signal. The responder sees that a freshness threshold was missed, the dependent dbt job did not run, and the downstream revenue model is stale. The lineage context identifies the dashboard and any connected activation destination. The team can move directly to the upstream ingestion workflow instead of debugging the dbt model that merely reflected the delay.
This is the difference between collecting monitoring data and operating with observability. The aim is not to create another dashboard that someone has to remember to check. The aim is to shorten the path from detection to root cause and, ultimately, restoration of trust.
Matia brings this operating model together with proactive monitoring, data-health dashboards, alerting, root-cause analysis, and performance context. For dbt users, this means the answers to common operational questions are available within the same workflow: what broke, whether the data is fresh, which models are affected, who owns the issue, and what depends on the result.
Avoid the Most Common dbt Monitoring Mistakes
The first mistake is treating every dbt test as equally urgent. This creates noise and reduces responsiveness. Build a severity model that reflects the business impact of the affected data product.
The second mistake is monitoring only hard failures. A job may complete successfully while still arriving too late, running too slowly, processing too little data, or producing a subtly broken result. Freshness, runtime, volume, and schema signals are often the earliest indicators that something is wrong.
The third mistake is separating alerts from lineage and ownership. An alert that states a model failed is useful. An alert that also shows the upstream dependency, downstream impact, current owner, run history, and relevant error context is actionable.
The final mistake is treating observability as a one-time implementation. As models, sources, consumers, and business priorities change, so should your tests, thresholds, ownership model, and incident runbooks. Each issue is an opportunity to make the next response faster and more precise.
Bring dbt Monitoring and Pipeline Health Together
dbt tests are the foundation of trustworthy transformations, but they are only one part of reliable data operations. Teams also need visibility into execution, freshness, behavior, and downstream impact. When these signals are disconnected, incident response is slower and more uncertain. When they are visible in one place, teams can understand what failed, why it matters, and where to investigate next.
Matia helps teams monitor dbt tests, models, pipeline health, lineage, and orchestration dependencies as part of a unified DataOps workflow. Instead of diagnosing incidents across disconnected tabs and tools, teams can bring the context needed for detection, diagnosis, and resolution into a single operating view.
If your team is still piecing together dbt health across separate systems, it is time to make pipeline health visible in one place. See how Matia Data Observability brings monitoring, lineage, and root-cause context together, then book a demo with Matia to explore a more reliable way to support your dbt workflows.
My first post at Matia was “What I Learned Moving from Software Engineering to Data Engineering”. Since then, I’ve had more conversations with software developers who are interested in data engineering but are concerned about how foreign the data world will feel. I took all the questions I was hearing and tried to create a conference talk that answered all of their questions.
I recently gave the talk at KCDC, one of the largest independent software conferences in the Midwest. You can watch the recording, check out the slides, or read my summary of the talk below.
My first impression of data engineering was not great
The first big data environment I spent time around, 20 some odd years ago, was built heavily on SQL Server Integration Services, or SSIS. If you've never had the pleasure, SSIS is a visual programming environment where you drag boxes onto a canvas, connect them with arrows, dig through layers of properties, and eventually produce something that looks like the conspiracy wall from a detective show.
The weird thing is that I never thought the actual work was boring. Moving data between systems is interesting. Reconstructing the history of a business is interesting. Figuring out why two departments have different numbers for the same supposedly simple metric is very interesting. What bothered me was that the engineering practices around the work felt years behind the rest of software development.
I wanted the “DevOps” stuff. Put the pipeline in source control. Give me a diff. Let somebody review it. Run tests before the change reaches production. Give me an environment I can throw away and rebuild. If a deploy fails, make it obvious. If someone changes something, give me a history.
I wanted data engineering to feel like software engineering.
The funny part is that my wish list turned out to be a pretty good description of modern data engineering.
Not everywhere, obviously. Somewhere out there a 4,000-line stored procedure is still quietly holding together a Fortune 500 company, and everybody is afraid to touch it. But the tools and practices around data engineering have changed a lot, and the modern version looks much more familiar to a software engineer than the version I first encountered.
So if you're a software engineer who has spent years vaguely aware that “data engineering” exists but has never really understood what those people are doing all day, here's the mental model I wish I'd had earlier.
Orchestration: it’s not just cron
A data platform is usually made up of a lot of jobs that depend on other jobs. Maybe you need to pull yesterday's orders from a production database, load them into a warehouse, transform them, run some tests, publish the finished tables, and only then refresh the dashboards that depend on them.
The order of operations matters, otherwise you get unpredictable results. You definitely do not want the executive revenue dashboard refreshing from half-updated tables because one job finished while three upstream dependencies were still broken or hadn’t finished.
This is where orchestration comes in. One common term you’ll encounter is “DAG,” or directed acyclic graph, which is a wonderfully computer-science-y way of saying “a dependency graph where the arrows point forward.”
Cron can run something at 2:00 AM, scheduling was never the problem. The problem is that if run tests fails, publish should never start, which means the dashboard refresh doesn't start either. The failure stays contained instead of quietly contaminating everything downstream.
Tools like Airflow and Prefect are popular orchestration tools today. They understand dependencies, retries, failures, reruns, and all the annoying real-world things that happen around schedules. Modern orchestration tools also increasingly define this stuff in code. Your pipeline can live in a repository. You can review it, diff it, revert it, and use git blame to participate in one of software engineering's oldest traditions.
That was one of the first things that made modern data engineering click for me. The weird visual pipeline hidden on a server was disappearing. The dependency graph had become code.
First you have to get the data
Before you can transform or model anything, you have to get the data out of wherever it currently lives. This is ingestion, and the main challenge is that data lives basically everywhere, from internal databases, to third party API’s, to files and events, and everything in between.
An enterprise data platform usually has to deal with many, many of these at the same time, and eventually all of that data needs somewhere to land.
This is where you run into terms like data warehouse and data lakehouse. A warehouse is generally the more structured, SQL-first side of the world: Snowflake, BigQuery, Redshift, and similar systems. They're optimized for analytical queries that scan large amounts of data rather than application-style queries that fetch a few records by primary key.
A lakehouse starts from cheap object storage and layers table-like behavior on top of it. You can keep enormous quantities of raw or semi-structured data in formats like Parquet and still query it in useful ways. Databricks, Delta Lake, and Apache Iceberg all live somewhere in this neighborhood.
The boundary between warehouse and lakehouse has gotten pretty blurry, and unless you're building one of these systems yourself, you probably don't need to develop a strong tribal identity around either camp. Most companies have an analytical home for data that is separate from the transactional database your application is using.
The much more interesting change, at least to me, is the move from ETL to ELT.
Old-school ETL means Extract, Transform, Load. You pull data out of a source system, transform it while it's moving, and then store the finished result.
ELT changes the order: Extract, Load, Transform. You pull the source data out, land the raw version first, and do the transformation later inside the warehouse or lakehouse.
Changing the order of two letters doesn't sound revolutionary, but it represents a huge change in how these systems are designed. Storage got cheap enough that you don't need to immediately throw the source away, and compute got elastic enough that rebuilding large amounts of historical data is much less frightening than it used to be.
That means you can keep an immutable copy of what the source system actually said. If you discover six months later that your revenue logic was wrong, you fix the transformation and rerun history from the original input. You don't have to reverse-engineer what you think the source probably contained before an old pipeline destructively changed it.
Modeling is where this starts looking a lot like software
Raw data is useful, but raw data is shaped around the applications that created it, and businesses generally don't think in application schemas.
Your product database might have six tables spread across three services, internal IDs that mean nothing outside the application, status codes that made perfect sense to the team in 2021, and four different timestamps that are all named some variation of created_at.
Nobody in Finance wants to understand any of that. They want customers, orders, subscriptions, revenue, churn, inventory, and whatever other concepts the business actually uses to think about itself.
Data modeling is the layer where you turn source-shaped data into business-shaped data.
This is where a tool like dbt comes in, and dbt was probably the thing that made modern data engineering feel most familiar to me. A dbt model can be nothing more than a SQL file containing a SELECT statement:
-- models/marts/customers.sqlwith orders as (
select customer_id,
count(*) as order_count,
sum(amount) as lifetime_value
from {{ ref('stg_orders') }}
groupby1)
select c.customer_id,
c.email,
coalesce(o.order_count, 0) as order_count,
coalesce(o.lifetime_value, 0) as lifetime_value
from {{ ref('stg_customers') }} c
leftjoin orders o using (customer_id)
The double braces are Jinja templating, but the more interesting piece is ref(). Instead of hard-coding the physical location of another table, the model declares that it depends on another model. dbt can use those references to work out build order, point the same code at different environments, and construct lineage between models.
The file lives in Git. You change it in a branch. Someone reviews it. It gets built and tested before merge. The final output might be a table or a view, but the thing you actually maintain is code.
Most dbt projects also develop a layered structure. Staging models do the boring cleanup: rename columns, normalize types, standardize timestamps. Intermediate models handle joins, deduplication, and reusable business logic. Marts expose finished concepts that people and applications actually want to consume.
That sounds pretty straightforward until somebody asks a seemingly innocent question like, “What's our revenue?”
Then you discover that “revenue” is not really a column, it’s a definition.
Does revenue mean paid orders, shipped orders, or completed orders? Gross revenue, or net of refunds? Before tax or after tax? Do discounts count before or after the number you're reporting? If you operate internationally, which exchange rate applies? Which timezone determines whether something happened yesterday or today?
You can write several perfectly reasonable SQL queries and get several different numbers. And none of them are wrong. They are just using different definitions of “revenue.”
This is the part of data engineering I underestimated the most. I assumed most of the complexity would be plumbing, but a lot of it is semantic. Somebody has to decide what the company means by “revenue,” turn that definition into code, and make sure everybody else builds from the same definition.
If Product and Finance are using two different definitions, there isn't an infrastructure purchase on earth that's going to make those numbers agree.
Yes, you can test data
Testing was probably the thing I wanted most when I was working around older data systems. I hated the idea that validation could amount to “run it and look at the result for a while.”
Modern data tooling is much better about this.
One of the useful concepts is a data contract, which is an explicit promise about the shape and meaning of a dataset. Software engineers already live with this idea. OpenAPI schemas, protobuf definitions, typed interfaces, and JSON Schema are all ways of saying, “If you depend on this thing, here's what you can assume about it.”
A data contract applies that same thinking to a table. Maybe order_id must always be present and unique. Maybe status is only allowed to contain paid, refunded, or canceled. Maybe every customer_id in the orders table has to correspond to an actual customer.
You can also go beyond simple assertions and write tests with SQL for business rules. The convention is delightfully backwards: write a query that returns the rows that violate the rule. Zero rows means the test passes. If rows come back, those are the failures.
So you can write a test that says modeled daily revenue must stay within one percent of the raw payment total. You can test cross-table relationships, tolerances, reconciliations, or pretty much anything else SQL can express.
Then you put the whole thing in CI.
That feels so normal from a software engineering perspective that it's almost boring, which is exactly why I like it. It should be boring. “We automatically test changes before deploying them” is not supposed to be an exotic idea.
But data can be wrong while everything is green
Tests help a lot, but data systems have a failure mode that takes a little while to get used to if most of your background is in application development. Software tends to fail in ways we're good at noticing. A process dies, latency spikes, requests start returning 500s, a queue backs up, or PagerDuty finds a creative new way to ruin dinner.
Data often fails without any of that.
Maybe yesterday's row count dropped by 90 percent because an upstream export was incomplete. Maybe a source column suddenly became null. Maybe a webhook was delivered twice and duplicated thousands of records. Maybe a vendor simply didn’t update their database.
The computation can be completely correct given the input it received. The problem is that the input itself is bad or incomplete.
You can't solve that entirely with unit tests because the thing you're processing changes every day. Instead, data platforms also monitor the behavior of the data. This is where data observability comes in.
The most common signals are things like freshness (did today's data arrive?), volume (is the amount of data roughly what we expect?), schema changes (did a column disappear or a type change?), and distribution (did the null rate on an important field suddenly jump from almost nothing to 40 percent?).
This is one place where application engineering instincts need a slight adjustment. A successful application operation is usually decent evidence that the operation worked. In a data pipeline, successful execution mostly proves that the computation completed. It doesn't prove the result is sensible.
Once you have enough data, nobody knows where anything is
There's another problem that shows up as a data platform gets larger: eventually nobody knows what tables exist, and what fields came from what sources.
This is what a data catalog is for. A catalog is essentially a searchable index of the datasets in the organization. You search for “revenue” or “customer” and see what's available, who owns it, when it was last updated, what the columns mean, whether it contains sensitive data, and what downstream systems are using it.
Closely related to cataloging is lineage, which is probably my favorite concept in this whole stack because it makes the invisible dependencies around data visible.
Lineage is the family tree of a number.
Suppose an executive dashboard says yesterday's revenue was $1.4 million. With good lineage, you should be able to trace that value backward through the model that produced it, through intermediate and staging models, all the way back to the application database and payment API that supplied the original records.
That's obviously useful when you're debugging something. If the dashboard looks wrong, walk upstream until you find where reality diverged from expectations.
But lineage is just as useful in the other direction. Suppose you're about to change stg_payments. Before you break the downstream executive report, you can ask what depends on it and ensure that the data is migrated fully.
When shared data breaks, figuring out what failed is only half the incident. You also need to know who consumed the bad result.
Put it together and you get something that looks suspiciously familiar
At this point we have version control, automated tests, CI/CD, reproducible environments, dependency management, monitoring, metadata, and safer deployment practices.
We've seen this movie before.
The broad term you'll hear for applying these ideas to data is DataOps, and the DevOps comparison is pretty obvious. Like DevOps, it's more useful as a set of practices than as a rigid job title. Not every data engineer owns every part of the system, just like plenty of excellent application engineers would prefer never to learn what a Helm chart is.
The cultural move is the same, though. Take a fragile manual process and make it reproducible. Put important artifacts in source control. Automate the boring parts. Make failures visible. Shorten the distance between introducing a problem and finding out that you introduced it.
Once I started looking at data engineering this way, the field became much less mysterious. It wasn't an alien branch of computing with its own incomprehensible rules. It was engineering applied to a different kind of system, where the thing you're managing is not just code or infrastructure but the historical record the business uses to understand itself.
The stakes are higher because data isn't just feeding reports anymore
It's easy to think of data engineering as a back-office reporting function because, for a long time, that's how a lot of companies treated it. Run jobs overnight, refresh dashboards, produce the monthly report, make sure Finance gets the spreadsheet.
Those things still matter, but data pipelines increasingly feed actual product behavior: pricing, recommendations, fraud detection, inventory systems, experimentation platforms, personalization, and machine learning.
If those pipelines break, the product also breaks. AI makes this even more obvious, hallucinating answers and giving demonstrably false answers.
For decades, a human was usually somewhere near the end of an analytical pipeline. Humans are pretty good at noticing when a result is obviously ridiculous. If the dashboard says the company made fourteen dollars last quarter, somebody will probably ask a question.
A model is less likely to complain.
A training pipeline will happily ingest bad data, optimize against it, and hand you a worse model. The problem might be subtle enough that you spend days tuning prompts, changing model parameters, or blaming the algorithm when the real bug happened three transformations upstream.
This is because AI products are data products.
This is why you need a DataOps platform
I work at Matia, which you can probably tell from where this post is published, and a lot of the questions above are a big part of why. ETL, observability, catalog, and lineage are often separate tools with separate views of the same data. You spend far more time than you might expect connecting separate products, ensuring that everything is communicating and has the right level of visibility. Is the lineage platform connected to everything? Can the observability platform inspect all your data sources and destinations? It’s a lot of overhead.
Matia brings those pieces into one platform built around shared metadata, giving you a single place to handle all of your DataOps needs. A unified platform means an ingestion issue, an observability alert, the upstream source, and the downstream models or dashboards are already connected. At Matia, we don’t want to replace your data architecture; we want to help you move your data from the sources to where you need it, and give you all the operational details around your data to ensure it’s accurate and timely.
None of the ideas in this post depend on using Matia. You can build a great data platform from separate tools. I just find the unified approach compelling because all of these systems are ultimately trying to answer the same questions: where did this data come from, is it healthy, and what depends on it? If you’re interested in learning more, click here to schedule a short demo!
The wish list wasn't a fantasy
For a long time, I assumed data engineering was inherently messy because the version I had seen was messy: no source control, manual deployments, giant stored procedures, visual pipelines nobody could meaningfully diff, and testing that involved staring at the output until everyone felt brave enough to ship.
What I found is that none of those things were fundamental properties of data engineering. They were engineering problems the industry hadn't solved yet, or at least hadn't solved in a way that was widely adopted.
Today, if I walk into an unfamiliar data platform, I don't care that much about the logos on the architecture diagram. I care about the shape of the system.
How does work get orchestrated? Where does the source data come from, and do we preserve the original? How do raw source schemas become shared business concepts? What gets tested before a change ships? How do we detect bad data when every job still reports success? Can I take an important number and trace it backward to its sources and forward to the systems that depend on it?
If you can answer those questions, you already understand a lot of what matters.
Application engineering makes data true in the moment. Data engineering takes those events and makes them useful over time. It preserves them, combines them, gives them meaning, and moves them into the places where people and systems can actually use them.
Every number on a dashboard has a supply chain. So does every metric in a quarterly report, every feature in a machine learning model, and every AI system whose behavior depends on the data we fed it.
Your application writes a row somewhere. That's not the end of the story. It's where the next system starts.
If you're bolting your data platform together one piece at a time, you already know the cost: more hours spent stitching tools together than actually using them.
It doesn't have to work that way.
Matia has been unified from day one: ETL, reverse ETL, observability, and catalog, in one platform. Dare we say, before it was cool?
That's why Matia MCP is easier to trust than the alternative. Plenty of vendors are now using an MCP to bolt their tools together after the fact. Matia didn't have to. Our platform was unified from day one. It isn't calling four separate data tools and that means less room for error and more accurate information in one central place.
Today, Matia MCP is available, meeting you where you work in your AI tool.
The challenge: 4 data tools bolted together
Over the last year, most of the data stack got its own MCP server: catalog vendors, observability platforms, warehouses, BI tools. Most of those MCP servers only see a single domain. Fine, until errors occur and you are trying to chase the root of the issue across multiple disconnected interfaces.
Say your nightly ETL to Snowflake fails and you want to know why. The real answer touches four separate systems: the Postgres connector it started from, the dbt model built on top of it, the ETL itself, and the revenue dashboard and exec report that depend on it downstream.
An agent working across four or five separate point-solution MCPs has to guess how those systems connect. None of them were built knowing the others existed. That's where there is more room for error, AI hallucinations and less efficiency.
We hear this directly from teams evaluating their own stacks. Many describe connecting together separate systems for ETL, monitoring, and cataloging by hand before an agent can use any of it.
The solution: one MCP on top of a unified foundation
Matia MCP doesn't need to stitch anything together. ETL, reverse ETL, observability, and catalog have lived on one platform since 2024, with lineage connecting all of it.
One MCP instead of four. Fewer systems to secure, fewer access points to manage.
Here's what it actually does:
Understand downstream impact. Follow a failing connector through the transformation and the sync to the dashboard it breaks, in one conversation, so you know what's actually affected before you act.
Find root causes. Give the MCP a broken dashboard and it traces back to the source, so you know how to resolve the problem.
See what's at risk. Ask what a change will affect before you make it, so you catch the ripple effects before they hit something downstream.
See Matia's recommendations. Matia recommends the monitors. Nothing runs until you approve.
Approve the fix. Run an integration sync or toggle a monitor, with your confirmation required every time.
Matia's MCP was built with the entire data team in mind. Here's how some customers are already using it.
Data engineers. Pipeline breaks at 2am? Trace the failure from the connector to whatever it touched downstream, using your AI assistant of choice. Less time spent figuring out which system has the answer.
Analytics engineers. Before you deprecate a table or refactor a model, ask what dependencies exist. Get the blast radius with the recommendation, not after you've shipped the change.
Data and analytics leaders. One place to check the health of the stack instead of several dashboards. Easily filter where you want to focus.
Customers are using (and loving) it
When we launched in private preview, we had some ambitious and AI forward customers raise their hands to try it out, and they liked what they saw:
We can share all of the impact, but we think our customers who are using it live share it best!
"I don't want five different MCPs for five different systems just to answer one question. Matia's the only one that can trace a problem from the pipeline all the way to the dashboard in a single pass, that's the whole point of it being unified." Adam Barrilleaux, Chief Technology Officer at Jones Capital
"I already had a pipeline health skill built in Claude. Now that the Matia MCP is available, I just plugged it into the process I'd already built. I didn't have to build a new workflow. The Matia MCP just made the one I already had better, giving me all the context I need from where I am working every day." Fernando Ruiz, Sr. Data Engineer, Drata
Matia MCP surfaces issues, you control what's next
Every vendor building an AI layer into their data stack right now is racing past that step. Agents that guess. Agents that act on stale context. Agents that quietly break something downstream because no one built the confirmation step first.
Matia MCP keeps a human in the loop. Matia recommends the monitors, but you are the final decision maker. Every new tool call here runs against the same lineage graph and the same unified data, not a bolted-on integration with its own quirks.
Try out Matia MCP
Ready to stop stitching together four different systems just to get one answer?
Matia MCP is rolling out to existing customers now. The unified platform was always the plan. Now it's built into the AI assistant you already use.
Not a Matia customer, want to see it in action? Book a Demo →
A wrong number on a dashboard shouldn't send you digging through four different tools to find out why.
That's the thread running through August: lineage that reaches into the BI tools you already use, and new connectors that bring more of your stack into Matia instead of leaving it scattered across four tools.
Know Where the Numbers Come From
When a report looks off, "what changed" is rarely the hard part. "Where do I even start looking" is. Column-level lineage into your BI layer answers that directly: click the number, see the model that built it, and work backward from there instead of jumping between tools with no shared context.
Power BI. A number on a report traces back through your models to the source system it came from, in one view.
Hex. Same idea for teams building in Hex: work backward from a chart or notebook cell to the models and columns feeding it.
Matia's lineage already covers Omni and Tableau. Wherever your dashboards live, the goal is the same: one place to trace a number back to its source, not four.
New Places to Pull Data From
Hark. Customer feedback and CX insights sync from Hark into your warehouse, so support teams don't export survey data by hand.
Hibob. Employee records sync straight from Hibob into your warehouse, so headcount and org reporting don't mean a separate pull every time someone asks.
Coupa. Invoices, purchase orders, suppliers, and approvals sync automatically, so finance isn't exporting CSVs out of Coupa by hand.
Forethought. AI-assisted support conversations and QA insights sit alongside the rest of your support data, so you can analyze them together instead of pulling a separate report.
iSpot.tv. Ad airings, brands, shows, and creatives sync from iSpot.tv, so marketing can measure TV alongside the rest of their ad data.
Confluence. Spaces, pages, and comments sync from Confluence into your warehouse, so wiki content sits alongside the rest of your data.
Coming Soon
dbt test monitoring: Right now, dbt test results stay siloed inside dbt, so a failing test can go unnoticed until it turns into a real downstream problem. Matia will surface dbt test results as monitors, alerts, and issues in the same place you already track the rest of your pipeline, no separate check required.
PlanetScale: A new ETL source for PlanetScale (built on Vitess), supporting both full syncs and incremental replication, so if PlanetScale is your production database, that data can get into your warehouse without a workaround. Coming soon.
Matia MCP: Your AI tools, connected straight to governed data instead of four systems in between. In private preview now. Get early access.
Want us to set you up with a free trial or demo? Reach out here.
Kiva replaced its legacy ETL provider after 10 years with them, completing a migration with zero business-critical downtime and a custom Snowplow connector no other vendor could deliver.
Connectors used: Google Sheets, MySQL, DynamoDB, Salesforce, Iterable, Snowplow, mobile (iOS) events
The Company
Kiva is a nonprofit that connects individual lenders directly to borrowers around the world, expanding financial access for underserved communities through crowdfunded microloans.
Greg Wilson has led Kiva's data function for 5.5 years, running data as a one-person team. Every tool decision has to hold up against a nonprofit's budget constraints and a lean, generalist workload. There's no room for surprises.
I didn't feel like I was giving up quality or reliability to find a price that worked for my organization with Matia. Our costs are 20-25% lower this year compared to our legacy provider. — Greg Wilson, Staff Data Engineer, Kiva
The Challenge
Kiva had spent over ten years with its previous ETL provider and faced numerous challenges:
Repeated pricing model changes. The provider restructured pricing multiple times, and each renewal brought a significant increase despite Kiva's usage staying flat.
Budget instability. For a nonprofit working with variable grant and donor funding, unpredictable renewal costs made planning difficult year over year.
A connector gap. Kiva needed a reliable, direct integration with Snowplow, its web event collector. Most alternatives either didn't support it or pushed Kiva toward workarounds.
Years without a credible alternative. Kiva had been evaluating replacements for years. Matia was the first viable second option they found, a sign of how rare a real alternative to the legacy providers actually is.
We'd been looking for alternatives for years. This was the first year we had two candidates who might actually be able to replace our provider. — Greg Wilson, Staff Data Engineer, Kiva
Kiva ran parallel trials with Matia and another third-party streaming data platform to find a replacement. While the other third-party technology impressed Greg, it wasn't built for Kiva's use case:
No direct Snowplow support. The suggested fix was a webhook workaround stitched together with its own transformation tools, workable in theory, roundabout in practice.
No help figuring out the workaround. They didn't provide support for building the webhook path it had recommended.
Little pricing transparency. They offered no meaningful engagement on price, and once Kiva ran the numbers against its actual usage, the pricing wasn't as competitive as hoped.
Three things ultimately ruled the other third-party out: price, product fit, and no real solution for Snowplow.
It was price, product fit, and they just didn't have a solution for Snowplow. They didn't provide support for figuring out the workaround they'd suggested. — Greg Wilson, Kiva
The Solution
Matia won the migration on three fronts: predictable pricing with no surprises at renewal, a team willing to build what Kiva needed, and a product on par for a 1:1 swap to make the migration from its legacy provider of 10 years simple with no downtime.
Pricing built for predictability. Matia put clear limits on how much prices could rise at renewal. Kiva knows what to expect going in, with no renewal-cycle surprises.
A custom Snowplow connector. Snowplow needed a collector endpoint, standardized enrichment, and custom event shredding across multiple tables. Matia agreed to build it before the trial even started, then delivered through daily feedback cycles in a shared Slack channel: flagging issues, testing fixes, and iterating until it worked.
Backwards compatible with their legacy schemas. Matia mapped to Kiva's existing setup so the migration didn't require redesigning workflows around a new product.
Migration with no business-critical downtime. Google Sheets, MySQL, DynamoDB, Salesforce, and Iterable moved over with minimal friction, timed to close out before Kiva's legacy contract expired. No double-paying, no overlap.
Matia's integration with Snowflake was seamless. It was easy to set up, and was able to accommodate Kiva's unique requirements. Our compute warehouse spend stayed flat during and after the migration, which was great. — Greg Wilson, Staff Data Engineer, Kiva
The Impact
Migration completed quickly, on schedule, with no business-critical downtime (and no double-paying). The connector migration moved quickly while engineering effort focused on the harder Snowplow integration.
Pricing risk removed from the budgeting equation. Kiva now has contractual limits on renewal increases, a meaningful change for a nonprofit managing constrained resources.
A business-critical connector that didn't exist before now does. The custom Snowplow integration gives Kiva direct, standardized event data instead of a workaround.
Built for whatever comes next. Large legacy vendors slow down as they scale. Kiva now has a partner it trusts to build novel connectors on demand, not just maintain the ones it already has.
Matia is a solid product. It's really good, but the team is what sets it apart: the level of support you get. — Greg Wilson, Staff Data Engineer, Kiva
Looking Ahead
Kiva plans to dig into Matia's catalog and lineage capabilities in the coming month for more visibility into how data moves across its stack, valuable for a team of one with no backup for tribal knowledge.
As companies get really big, they often slow down. They're not as nimble. Matia is so nimble. I'm confident that if something novel comes up in the next three to five years, Matia is a great partner for adapting to it. — Greg Wilson, Kiva
Matia handles ingestion and reverse ETL well on its own. dbt handles the transformation layer in between. The interesting engineering problem starts when those systems have to behave like one pipeline: ingestion must finish before tests run, tests must pass before transformations are built, and reverse ETL must not fire until the transformed data is ready.
At that point, scheduling each tool independently is not enough. Something has to own the dependencies, wait states, retries, and failure path across the entire sequence. In this example, that something is Prefect.
I built a small reference pipeline to experiment with how you might orchestrate Matia with Prefect. The pipeline looks something like this:
Trigger a Matia ingestion integration through the API.
Resolve the Matia integration-run ID and attach it to the current Prefect flow run as a tag.
Suspend the Prefect flow while the ingestion job runs.
Resume the exact waiting flow when a correlation-bearing completion callback arrives.
Run dbt test, run dbt run, and then trigger a Matia reverse ETL integration.
Why scheduling is not enough
The dependency between ingestion and dbt is simple to describe: do not transform data until the load has actually finished. It is also exactly the kind of dependency that becomes awkward when each system owns its own schedule. But it’s not just about scheduling transformation: you might need to ensure several ingestion jobs are completed before the data can be utilized, or you might have workflows to trigger in other connected services as soon as the data is available.
You can estimate how long ingestion usually takes and delay follow up tasks accordingly, but that is still a guess. A fast load leaves the pipeline idle for no reason. A slow load allows those other tasks to start against incomplete data. Polling Matia from a worker is more accurate, but it keeps execution infrastructure occupied, produces repetitive status checks, and forces you to choose a polling interval that balances latency against API traffic. Instead, Matia supports triggering a webhook after a job has run, allowing for a near-instant notification that the pipeline is complete.
An orchestrator gives the sequence one place to live. Prefect can trigger the external job, preserve the state of the workflow while it waits, continue with dbt only after the gate is cleared and the webhook call is received, and show the trigger, tests, transformations, and downstream submission as one connected run.
Correlating each Matia run to the correct Prefect flow
Suppose flow A triggers Matia run A, then flow B triggers Matia run B. When a completion webhook arrives, “resume the most recent paused run” cannot reliably determine which workflow owns that event. The receiver could resume the wrong flow without raising an obvious error, allowing the pipeline to continue against the wrong ingestion run.
The fix is deterministic correlation. Once the ingestion job has been triggered and its Matia integration-run ID is available, the Prefect flow adds that ID to its own tags as matia-run:<id> before suspending. Matia then includes the same integration-run ID when it calls the webhook endpoint.
The receiver uses that ID to construct the corresponding Prefect tag and search for the exact flow run waiting for it. If one matching paused flow exists, Prefect resumes it. If no flow matches, or more than one flow somehow has the same tag, the receiver returns an explicit error rather than guessing. Duplicate webhook deliveries are also safe: if the matching flow is no longer paused, the receiver simply reports that no action is needed.
That gives the pipeline a clean one-to-one relationship:
Start with the orchestration graph
The top-level flow is intentionally small. It shows the dependency graph without burying it under the client, tagging, or receiver details:
@flow(name="matia-ingestion-pipeline", persist_result=True, log_prints=True)defmatia_ingestion_pipeline( ingestion_job_id: str = "demo-ingestion-job",
reverse_etl_job_id: str = "demo-reverse-etl-job",
dbt_project_dir: str = os.getenv("DBT_PROJECT_DIR", "./dbt_project"),
) -> None: matia_run_id = trigger_matia_ingestion_job(ingestion_job_id)
tag_current_flow_run_with_matia_run(matia_run_id)
print(f"Tagged this flow run with matia-run:{matia_run_id}")
print("Suspending until Matia posts to the webhook receiver...")
suspend_flow_run(timeout=3600)
run_dbt_test(dbt_project_dir)
run_dbt_run(dbt_project_dir)
trigger_matia_reverse_etl_job(reverse_etl_job_id)
The flow waits for the ingestion side because dbt depends on the landed data. After the flow resumes, it runs the data tests, builds the transformation, and submits the reverse ETL integration.
Attach correlation after Matia starts the run
The Matia run ID is not known when the Prefect flow is created. It only becomes available after the integration has been triggered. That does not prevent the flow from using it for correlation because Prefect tags can be updated while the flow run exists.
This example around this helper uses prefect.runtime.flow_run.id to identify the currently executing flow run. That avoids passing the Prefect flow-run ID through every function call. It also keeps the helper straightforward to test because Prefect's runtime value can be supplied through PREFECT__RUNTIME__FLOW_RUN__ID in a test environment.
The result is a searchable association in Prefect's state store:
matia-run:<matia_run_id>
Once that tag exists, a receiver with the same Matia run ID can locate the exact flow that is waiting for it.
The flow uses suspend_flow_run() rather than a sleep loop. Suspension allows the running process to exit while Prefect retains the workflow state needed to continue later. The flow can remain suspended for minutes or hours without keeping the original worker process alive.
The body of the webhook call from Matia contains both a status and the integration-run ID. If the status comes back as anything other than “success,” we can fail the suspended flow; and if it is a successful run, we can resume the suspended flow using the matia-run:<matia_run_id> tag.
Validate the data before building on it
Once ingestion is complete, the next question should not be, “Can we start transforming this data?” It should be, “Did we receive data we can trust?” A successful load confirms that records moved between systems, but it does not guarantee that the dataset is complete, unique, current, or structurally valid. This pipeline therefore validates the newly landed data before running transformations or triggering reverse ETL.
That matters because many data-quality problems do not cause ingestion itself to fail. Duplicate records, missing identifiers, unexpected nulls, or incomplete loads can all reach the destination successfully. If transformation begins immediately, joins, aggregations, and default values may hide or amplify those problems while still producing models that appear valid.
Testing the landed data first creates a clear quality gate. When a fundamental expectation fails, the pipeline stops while the issue is still close to its source, making it easier to diagnose and preventing compute from being spent on models that should not be built.
It also protects operational systems downstream. Reverse ETL may send customer attributes, account classifications, or campaign audiences back into business applications. Catching bad data before transformation is inconvenient; catching it after it has triggered workflows or changed customer-facing behavior is an incident. Validation keeps that failure contained before the data can spread.
Why put Matia inside the Prefect graph at all?
Matia natively supports scheduling integrations on an interval or cron schedule. This works for a lot of pipelines, where data is aggregated an analyzed at a later time, and the next steps aren’t expected to run in near-real-time. For more complicated needs, orchestration provides several benefits:
Dependencies are expressed as code. dbt does not run because a timer suggests ingestion is probably finished. It runs after the flow's completion gate has been cleared. Reverse ETL is submitted only after both dbt steps succeed.
Retry policies live with the workflow. The API calls can retry transient client or network failures, while dbt validation can fail immediately because a broken data contract is not normally fixed by repeating the same test. Those choices are visible alongside the rest of the pipeline.
The ingestion-to-transformation failure path is connected. If ingestion has completed but dbt test fails, the Prefect run shows the failed task and its logs rather than leaving the transformation failure disconnected from the job that supplied the data.
Concluding the experiment
Matia’s API and webhook capabilities make its integrations composable parts of a larger data platform rather than isolated scheduled jobs. Teams can place validation, transformation, approvals, or any other required logic between ingestion and reverse ETL while retaining the speed and reliability of Matia’s managed data movement. The orchestration layer may change from team to team, but the core pattern remains the same: move the data with Matia, verify it before building on it, and only push it downstream when the full pipeline has succeeded.
Today, Matia is adding Power BI to the Catalog, extending the same lineage, descriptions, and usage tracking that already covers Metabase, Tableau, Omni, and Hex to Microsoft's BI platform too.
Power BI organizes everything into workspaces of datasets, reports, and dashboards. It's usually the last stop before a number turns into a decision. Until Matia, that's also where lineage stopped.
The Challenge: No Lineage Into Power BI
Most teams can point to a dashboard. Fewer can say, on demand, which table it came from or what happened if that table changes.
Even when lineage exists, it usually stops at the warehouse. It can't tell you which column in that table actually feeds the field breaking on the dashboard.
Business teams trust what's on screen. Nobody questions a chart until a number looks wrong.
Once that happens, someone has to trace it back by hand: Power BI to the warehouse, the warehouse to whatever fed it, one Slack message at a time.
The more people plug into Power BI, the bigger that gap gets. It doesn't shrink with scale. It compounds making finding mistakes more costly and time consuming.
→ Descriptions: Asset descriptions from Power BI carry over too, so nobody has to redocument what a report already explains.
→ Lineage: Native Power BI lineage traces the relationships between datasets, reports, and dashboards down to the column level, running upstream through Snowflake and Databricks so you can follow a single column back to where it started.
→ Usage: Usage metrics from Power BI land in the Catalog's usage tab, so you can see what's being read, not just what exists.
Power BI Joins Matia's Growing List of BI Connectors
Power BI is adding to the growing list of BI connectors in Matia's Catalog, joining Metabase, Tableau, Omni, and Hex. Power BI is here for the same reason Hex and Omni are: teams don't run one BI tool, so the Catalog doesn't assume they do.
Most catalog tools start lineage at the table that lands in the warehouse. Matia already sits upstream of that, in ETL, so lineage traces accurately past the warehouse, all the way to the source system a number started in.
How Teams Are Using It
Data engineers get a direct answer to what breaks if they change a table, without tracing it through Power BI by hand first.
Analytics engineers stop being the default translator between what a report shows and what happened in the warehouse.
Business stakeholders can trust a Power BI dashboard because the lineage behind it is provable, not just claimed.
Available Now
Power BI support is live. If you're already on Matia, connect your Power BI workspace from the Catalog, and descriptions, lineage, and usage start appearing automatically.
Book a demo to see lineage into Power BI and our other BI tools in action.
Model quality gets most of the attention in AI, but models are often not the first thing to fail in production. More often, the problem begins upstream in the data pipeline.
When an AI model starts producing weaker recommendations, less useful summaries, stale answers, or inconsistent decisions, the model may simply be reflecting a problem in its inputs. Data may have arrived late, changed shape, lost important context, been duplicated, or drifted gradually without causing a hard failure.
That is the operational reality of production AI: the model generates the output, but the data determines whether that output can be trusted.
If an AI model depends on your data warehouse, reliability starts with observability at the data layer. Teams need to identify problems before users notice that something feels wrong, not after output quality has already declined.
There are many different ways data can fail, but these five failure modes are among the most common ways AI data pipelines break in production. They are also the kinds of problems teams can catch early with the right monitoring and lineage.
An outdated view of reality
Stale data is common because it can be difficult to detect from the application layer. A source system stops updating on schedule, replication begins to lag, or a sync job continues to succeed while reading old data. Downstream transformations still run, and the AI application still returns an answer, so the system appears healthy.
In practice, however, the AI is reasoning over an outdated version of the world. An internal copilot may summarize yesterday’s support queue instead of today’s. A recommendation engine may miss a user’s most recent activity. An account intelligence workflow may rely on old customer attributes. An agent may retrieve data that is technically available but no longer current enough to trust.
The mistake is monitoring whether jobs ran instead of whether the data is fresh. A pipeline can be green while its outputs are already wrong.
Exactly how you monitor for data freshness depends on the data itself: Where is it coming from? How often is the data expected to update? What is the SLA for this data? At a minimum, you can monitor the lag between event time and warehouse availability to help determine whether each asset is updating at its expected cadence.
Matia makes those signals visible at the data layer, where the problem begins. By default, Matia will monitor for data freshness on all of your data pipelines, no configuration necessary! Rather than waiting for someone to report that “the AI feels off,” teams can identify which upstream asset stopped arriving on time, when it departed from its normal pattern, and, using Matia’s lineage capabilities, which downstream pipelines, models, or AI-facing tables are affected. That replaces subjective debugging with evidence.
Important context is lost
Schema drift can cause serious damage without creating an obvious outage. A column may be renamed, a nested object may change shape, a previously dependable field may start arriving as null, or a data type may change just enough to disrupt one transformation branch without breaking the entire pipeline.
The job still runs, the table still materializes, and the model still responds. What has changed is the quality of the context available to the AI.
That degradation can appear in several ways. Prompts may lose customer or product attributes. Retrieval pipelines may drop metadata that is necessary for relevance. Scoring jobs may receive incomplete inputs. Generated outputs may become more generic, vague, or inconsistent.
AI systems are especially sensitive to partial data failures because their usefulness often depends on rich, structured context. A traditional analytics workflow may remain usable when one field disappears. An AI workflow can lose quality immediately, even when the broader pipeline appears intact.
Teams should monitor schema differences across runs, contract changes in critical sources, sudden increases in null values for important fields, and growing sparsity in downstream data after an upstream change.
Matia helps teams detect schema issues at their source and trace the downstream effect through lineage. Instead of discovering the problem only after output quality declines, teams can see which source contract changed, which transformation was affected, and which AI workflows are now consuming incomplete data. That shortens the path from a vague symptom to a specific root cause. When a schema change occurs, you can choose to automatically add those changes to the pipeline or ignore them, or pause the pipeline until the team has a chance to review. Every schema change is logged and visible, allowing full historic review of every change.
The pipeline loses business context
Most production AI systems do not operate on raw data alone. They depend on enriched data assembled from multiple sources. Usage events may be joined to account records. Support tickets may be connected to customer metadata. Product telemetry may be enriched with pricing tiers, account owners, or regions. Documents may be linked to business context before they are embedded, indexed, or added to prompts.
When those joins fail, the system often continues to run, but the business meaning disappears. A match rate may fall from 98 percent to 63 percent. A key format may change. An upstream source may become incomplete. A transformation may still finish successfully even though half of the enrichment fields are now null.
At the application layer, the result may look like generic recommendations instead of personalized ones, weak account-aware responses, less relevant retrieval, or summaries that omit important business context. The AI still works in a technical sense, but it is noticeably less helpful. The infrastructure has not failed; the system has lost meaning.
The most important signals are join match rates, null rates in enriched fields, row-count changes before and after joins, the completeness and validity of join keys, and shifts in distinct counts for important business attributes.
Matia makes this kind of transformation-layer degradation visible before it becomes a product problem. Row count monitors come default with your data pipelines, and you can write custom SQL monitors to identify data-specific anomalies. Once the broken table is identified, users can trace the resulting loss of context through lineage, and determine which downstream assets, dashboards, feature tables, or AI workflows are operating with degraded business meaning.
The pipeline amplifies noise and treats it as signal
Duplicate data is particularly dangerous in AI systems because the result often looks plausible. A batch may replay, a retry process may not be idempotent, a source may emit the same events more than once, or a document indexing job may ingest identical content twice.
As with so many of these failures, it can be nearly invisible. Nothing crashes, but the downstream system now has a distorted view of reality. Duplicates can inflate user activity signals in feature tables, cause ranking systems to overweight repeated events, introduce redundant content into retrieval pipelines, skew training or inference inputs, and create false confidence in patterns that are really artifacts of replayed data.
AI systems can be more vulnerable to this problem than traditional analytics. A dashboard with duplicated records may look suspicious enough to prompt investigation. A model or ranking system may simply absorb the distortion and return a confident-looking result.
Teams should monitor uniqueness by business key, unexpected row-count growth, duplicate rates in critical tables, and replay spikes following retries or recovery workflows.
Matia helps detect duplication before it contaminates downstream logic. Using custom SQL monitors for data quality checks and anomaly detection can surface unusual growth, key duplication, and replay patterns early enough for teams to stop bad data from propagating further downstream.
The hardest failures are the ones that still look normal
Some of the most frustrating AI incidents happen when every component is technically functioning. A feature table may arrive late without being completely missing. A text field may begin to truncate. A column may continue to populate even though its value distribution has shifted. Null rates may rise slowly, category mixes may change, or the timing and shape of the data may drift just enough to reduce output quality without creating a visible outage.
But the pipeline still completes and looks stable, and the model still responds, but users gradually begin to trust the result less. These incidents consume time because teams often investigate the wrong layer first. They tune prompts, compare models, rerun evaluations, and debug inference paths when the underlying problem is that the input data no longer matches operational expectations.
Quiet degradation can make rankings noisier, weaken personalization, increase false positives, and produce less grounded outputs. Often, the only initial report is that the system “seems worse lately.” Although the symptoms may eventually appear in model monitoring, the underlying issue begins as a data observability problem.
Useful signals include feature freshness, the readiness of dependencies before scoring or inference, distribution shifts, cardinality changes, null-rate changes, and changes in text length or token-length patterns for LLM inputs.
Once again, Matia’s observability platform gives teams visibility into the health of the data feeding AI systems. Teams can catch delays, drift, and unexpected changes in data shape with Matia’s observability suite, then use lineage to identify exactly which downstream AI workflows are exposed.
AI reliability depends on pipeline reliability
Across all five failure modes, the pattern is consistent: The model is where the problem becomes visible, but the pipeline is often where it begins.
That is why “the job succeeded” is not a meaningful reliability standard for an AI system. Trustworthy production AI requires confidence that the data is fresh, the schema is stable, joins are holding, duplicates are controlled, inputs are arriving on time, and downstream impact can be traced when something changes.
Those capabilities are part of the operational foundation that turns an AI demo into a production system people can rely on.
This is why unified DataOps matters
Matia is designed for this class of failure. The important question is not simply whether a table exists, a job ran, or a dashboard is green. It is whether the data feeding a critical system is reliable enough to support trustworthy decisions and outputs.
For AI systems, that means surfacing stale upstream data before copilots or models operate on old context, identifying schema changes before prompts and feature pipelines lose important fields, catching broken joins before enrichment disappears, detecting duplicate loads before signals become distorted, and flagging drift or delay before output quality begins to erode.
Because Matia connects data quality, freshness, transformations, and lineage, teams can move more quickly from “something seems wrong” to a specific explanation: an upstream asset changed, these downstream systems are affected, and this is what needs to be fixed. That clearer path from symptom to cause is the basis of operational trust.
Conclusion
Most production AI failures are not dramatic. They do not always fail a job or break an application outright. More often, they appear as a gradual decline in output quality and trust.
The companies that succeed with AI will not be defined only by the models they choose. They will be defined by the operational discipline they apply to the data pipelines feeding those models.
If AI outputs matter to the business, the pipelines behind them need observability. The best place to catch many AI failures is not the model itself, but the data that reaches it.
The moment data teams dread is rarely a red error message. It is the message that arrives later: “Are these numbers right?”
By then, the pipeline may have been marked successful for hours. The table may have refreshed. A dashboard may already be in front of leadership. What failed was not the job itself. What failed was the team’s ability to notice that the data had become incomplete, stale, or misleading before someone used it.
That is why dependable data operations are built around more than retry logic. Teams need to know when data begins to drift from what the business expects, who should respond, and how far the problem has travelled before they start fixing it. It is a challenge Drata’s data team ran into firsthand while building AI-ready data systems.
The Pipeline Can Be Green and the Data Can Still Be Wrong
A successful run only proves that a process completed. It does not prove that the result makes sense.
Think about a daily transactions feed. The source normally sends fifty thousand records. One morning it sends thirty-two thousand. The pipeline loads all thirty-two thousand without complaint, because nothing about that load is technically invalid. The revenue dashboard refreshes with a partial day of business, and the first person to spot the gap is usually an analyst trying to explain why yesterday looks unusually quiet.
Schema changes create a similar problem. A source team renames a field, or switches a type, and the ingestion job continues to run. Somewhere downstream, a join begins producing nulls. The numbers still exist, but the logic behind them has changed.
These are data pipeline failures. They deserve the same urgency as a hard job failure because the business impact can be just as real.
Catch the Small Signals Before They Become the Big Incident
The earlier a team notices a change, the more options it has.
Freshness is often the first signal worth watching. If a critical dataset is late, the downstream teams should hear about it before their reports refresh. Volume gives you another useful early warning. A sharp drop may mean missing source records or a filter that changed unexpectedly. A sudden increase may point to duplicates, replayed events, or a broken extraction.
Schema monitoring helps surface the kind of structural change that may not break a job but can still change an outcome. Null-rate and distribution monitoring can reveal a more subtle version of the same story. The row count may be fine, yet the values inside the data have shifted enough to make a model or dashboard unreliable.
Performance is worth tracking as well. A transformation that slowly takes longer every week may not trigger an incident today. It can still become the reason a morning reporting chain starts missing its deadline next month.
The goal is not to monitor every field with the same level of scrutiny. Start with the data products that drive a financial close, a customer experience, a key operational workflow, or an important business decision. Those are the places where early detection pays for itself. For a fuller breakdown of what to track and why, see our guide on what to look for in a data observability platform.
Watch the Handoffs Between Systems
Data rarely fails in one neat location. It usually goes wrong at a handoff.
A source delivers a late extract. A transformation applies a new rule. A warehouse model finishes with a strange record count. A reverse ETL sync pushes that result into a sales or marketing tool. When people only look at the endpoint, they often discover the problem after it has moved through several layers of the stack.
Monitoring the important handoffs changes that. Did the source arrive when expected? Did the transformation produce the expected shape of data? Did the downstream model inherit a schema change? Did the final audience or report get the version of the data it was supposed to receive?
You do not need an elaborate control for every temporary model. That is not a sensible use of anyone’s time. You do need a clear line of sight across the pipelines the business cannot afford to get wrong.
Treat Alerts as the Beginning of an Investigation
An alert should save time. Too often, it creates more work.
“Anomaly detected” is not much help to the person on call. They still need to work out what changed, whether it matters, which pipeline is involved, who owns it, and what might be affected. That turns a one-minute notification into a twenty-minute scavenger hunt before the real investigation has even started.
A good alert comes with a little substance. It should identify the dataset or model, the kind of issue, the time it began, and the most relevant context. If the problem is tied to a recent schema change or failed test, that should be visible. If the data supports a downstream report or operational workflow, the alert should make that clear too.
Routing deserves just as much thought. A finance model failure does not need to wake every engineer. A product-event issue should reach the people who understand the event stream. Sending the right alert to the right owner is one of the simplest ways to reduce noise without reducing coverage.
Use Lineage to Separate a Nuisance From a Real Business Risk
When something changes upstream, the hard question is usually not “what table broke?” It is “what is now unreliable?”
Lineage helps answer that question. It connects a source field or model to the reports, metrics, audiences, and other outputs built on top of it. That context lets a team see whether it is dealing with a contained issue or one that is already spreading into places where people will make decisions.
Without lineage, teams tend to make one of two mistakes. They either treat every alert as an emergency or dismiss an alert because the table name does not look important. Both responses waste time.
During an incident, a useful lineage view gives the team a practical path in both directions. It can show where the affected data came from and where it went after the transformation. That is what turns an anomaly into an impact assessment.
Contain the Problem Before You Perfectly Explain It
There is a tendency to investigate first and act later. That makes sense for a minor issue. It is risky when the data is about to update a dashboard, trigger a campaign, or move into an operational workflow.
If you have a reason to believe the output is wrong, pause the downstream action when that is safer than publishing bad data. Let the people who rely on the dataset know what is being checked. A short status update is better than letting a questionable number circulate for hours without context.
Then narrow the scope. Is the issue limited to one run? Did it start after a source release? Is it visible in a transformation, a warehouse model, or a downstream consumer? Look for the earliest point where the data stopped behaving normally. That point is usually more useful than the place where someone first noticed the bad result.
Once the cause is clear, fix the source or the logic, backfill the affected data if needed, and validate the outcome before reopening downstream workflows. A successful rerun is encouraging. It is not proof that the incident is finished. Check the data health signals and the business outputs that were affected in the first place.
Keep the Evidence Around Long Enough to Use It
Root cause analysis depends on details that are easy to lose.
Run history, error messages, model metadata, test results, timing information, and recent changes are all more useful after an incident than they appear during a normal day. A failed run may last only a few minutes, but the clues it leaves behind can save hours of investigation later.
For teams using dbt, the surrounding context matters. Model definitions, tags, tests, dependencies, and run results can help explain why a problem appeared and who needs to look at it. When those details are scattered across several tools, people spend too much of an incident gathering basic information rather than solving the issue. See how Matia’s dbt integration surfaces that context automatically.
It is also worth recording the business effect. Did a finance report need to be corrected? Did a campaign go out late? Did a customer workflow use stale data? Those details make it easier to decide which monitors, rules, and ownership paths deserve attention after the immediate fix is complete.
Make the Next Incident Less Painful Than the Last One
Every meaningful failure leaves behind a useful question: what would have helped us see this sooner?
Sometimes the answer is a freshness monitor. Sometimes it is a volume threshold, a data-quality rule, clearer ownership, or a better lineage connection. Sometimes the team had the right signal but the wrong alert route. The follow-up should focus on that weak spot, rather than producing a long list of changes nobody will maintain.
This is how a data team moves away from constant firefighting. It does not happen because every pipeline becomes perfect. It happens because the team gets better at recognizing the patterns that have caused trouble before and putting sensible controls around the data that matters most.
Why Connected Context Matters During a Failure
A data incident becomes harder to resolve when the evidence is spread across disconnected systems. Run history sits in one tool, transformation logic in another, lineage elsewhere, and downstream workflows somewhere else again. Each switch adds time and uncertainty.
Matia brings ETL, observability, catalog, and reverse ETL together in one unified DataOps platform. Its observability capabilities include automatic monitoring for freshness, volume, and schema; custom SQL rules; real-time alerts; data-health dashboards; performance monitoring; and root-cause investigation supported by logs and lineage. Matia also connects directly with dbt workflows, so tests, tags, and configurations can sit in the same operational view.
The practical benefit is a clearer place to begin when data starts behaving differently. Teams can investigate the signal, the relevant context, the owner, and the downstream impact without first reconstructing the incident from several separate systems. That kind of consolidated context is what helped one fintech company move from firefighting reliability issues to catching them early — read how they did it.
Start With the Data That Matters Most
You do not need perfect coverage across the warehouse before you can make a meaningful improvement.
Start with the pipelines that feed financial reporting, customer experiences, executive metrics, or important operational decisions. Define what healthy looks like. Monitor freshness, volume, schema, and the signals that matter for that particular data product. Make sure an owner is clear. Test the response process with a real scenario rather than an idealized one.
That is how teams catch failures while they are still technical issues, before they become a difficult conversation with the business.
Ready to Catch Pipeline Failures Earlier?
If your team is spending too much time discovering data issues after they reach a dashboard or downstream workflow, Matia can help bring monitoring, lineage, and operational context into the same place.
Book a demo with Matia to see how a unified DataOps platform can help your team detect pipeline failures sooner, investigate incidents with less guesswork, and protect the data your business relies on.
The easiest way to make an AI project look promising is to connect it to a lot of data. The easiest way to make it risky is to do that without knowing what the data means, where it came from, or who should be allowed to use it.
That risk isn't theoretical. Poor data quality is a common root cause behind failed AI projects, and teams that lack an AI-ready data foundation often abandon those initiatives within the first year. The pattern is consistent: teams move fast on the model and slow (or not at all) on the data foundation underneath it, and the gap catches up with them.
This shows up quickly in real organizations. A team wants to give an internal assistant access to customer information. Another wants a retrieval system that can answer questions from operational data. A product group wants to use historical behavior to improve a model. The use cases can be valuable, but the same questions arrive every time: Is the data current? Is it complete? Does it contain sensitive information? Which definition is the right one? What happens if the source changes next week?
Those are not model questions. They are data foundation questions.
A trustworthy AI program needs more than a capable model and a good prompt. It needs governance that clarifies responsibility, lineage that provides context, and security that controls access. When those three pieces work together, teams can move faster without losing track of what their AI systems are actually using.
Trust Is Decided Before the Model Sees the Data
An AI system can produce a fluent answer from unreliable inputs. That is what makes bad data so dangerous in this setting. The response may sound confident even when the underlying information is stale, incomplete, misclassified, or pulled from the wrong source.
Imagine an internal sales assistant that pulls account information from a warehouse. A field called customer_status exists in several places. In one model, it reflects billing status. In another, it reflects a sales team's current relationship. In a third, it is a legacy field that has not been maintained for months. If the assistant has access to all three without context, it may return a clean answer that is simply wrong.
This is not a rare edge case. Most mature data environments contain overlapping definitions, old models, partially documented transformations, and data that is useful only for a narrow purpose. A trusted AI foundation helps people distinguish the reliable version from the merely available version.
Governance Gives Data a Clear Owner and a Clear Purpose
Governance often gets reduced to policies, committees, and documentation. Those things can matter, but the practical value comes from making decisions visible.
For AI, governance should answer a few basic questions about any dataset that may be used in a model, retrieval workflow, or automated process:
Who owns it?
What does it represent?
How current is it?
What is it intended to support?
Which uses are allowed, restricted, or off limits?
Who needs to approve a meaningful change?
That's useful because AI projects tend to move across team lines. The data team may prepare the source. Security may set access requirements. A product or operations group may own the use case. Legal or privacy teams may need to weigh in when sensitive information is involved. Without clear ownership, those responsibilities become a series of assumptions.
Good governance does not ask teams to document every possible detail before they can build anything. It gives them a shared way to identify the datasets that matter, describe them clearly, and decide who is accountable for their use.
Lineage Supplies the Context That AI Workflows Need
Lineage is often introduced as a way to troubleshoot a broken dashboard. It is just as valuable when AI is involved.
An AI workflow needs more than a table name. It needs to know what a field represents, what transformations shaped it, and whether it's still the right version to use. Lineage provides that trail — it connects a data asset to its source systems, transformations, owners, and downstream uses.
Here's what that looks like in practice. Say a source Postgres table changes its schema: a column gets renamed or a data type shifts. With column-level lineage in place, a data engineering team can immediately see which downstream dbt models depend on that field, including any that feed an AI scoring or retrieval workflow. Rather than finding out three weeks later that a customer facing assistant started giving strange answers, the team gets a heads-up (in Matia's case, an automatic PR update on GitHub flagging the impacted models) before the AI workflow is ever affected. That's the difference lineage makes in practice: not a compliance record after the fact, but a live map the team can act on before something breaks downstream.
Lineage also helps teams explain their decisions. When someone asks why an AI assistant recommended a particular account action or surfaced a certain metric, the team has a better starting point — tracing the data back through the transformations that produced it, instead of relying on a loose recollection of how the workflow was assembled.
Security Decides What Data the AI Can Actually See
The fact that data exists in a warehouse does not mean every AI workflow should have access to it.
Security is where governance becomes enforceable. Data classification identifies sensitive information. Access controls determine who or what can use it. Policies define the conditions under which data can be exposed, masked, aggregated, retained, or shared with an AI application.
This is especially important for internal AI tools because convenience can encourage broad access. It may seem helpful to give a chatbot a large slice of the warehouse so it can answer more questions. That decision can create a serious problem if the system can retrieve personal information, confidential financial data, internal notes, or fields that were never meant for the audience using the tool.
A safer approach starts with the use case. What information does the assistant or model actually need? Which datasets are approved for that purpose? Are there sensitive fields that should be excluded, masked, or aggregated? What identity and permission model governs access when a user asks a question?
Least-privilege access is not an obstacle to useful AI. It is a way to make the system more deliberate and easier to trust.
The Three Layers Need to Work Together
Governance, lineage, and security are often implemented as separate initiatives, in separate tools. That creates gaps, and it's the same tool sprawl problem that shows up everywhere else in the data stack, just with higher stakes when AI is involved.
A policy is difficult to enforce if nobody can see where the data travels. Lineage is less useful if it does not include ownership and classification. Security controls can become blunt if they cannot distinguish a raw sensitive field from a governed, aggregated dataset that is safe for a specific use.
The stronger approach is to connect the layers in the same operating flow. A governed dataset has a clear definition and owner. Its lineage shows how it was created and where it is used. Its classification and access policies determine who can use it, including an AI workflow or service account. When something changes, the team can assess the impact before the change creates a new risk.
That connection also makes reviews more productive. Instead of debating broad questions like “Is this AI project secure?”, teams can focus on the actual data involved — the sources, transformations, classifications, users, and downstream behavior that matter for the specific use case.
Build for Change, Not Just the First Launch
Many AI projects begin with one carefully selected dataset and a small group of users. That is a sensible place to start. The difficulty comes later, when the use case grows and the data changes underneath it.
A source system may change its schema. A business definition may be updated. A data owner may decide that a field should no longer be used for a particular purpose. An employee may move to a new role and lose permission to view a sensitive dataset. Each change can affect the AI workflow if the team has no way to see the connection.
This is why operational controls matter. Monitor data freshness, volume, schema, and quality around AI inputs. Keep an eye on lineage when transformations change. Review access policies as the use case expands. Give owners a way to see where their data is being consumed.
The purpose is not to slow development with endless approvals. It is to avoid discovering, months later, that an AI application has been running on a definition, a source, or a permission set that no longer makes sense.
Start With One High-Consequence Use Case
The fastest way to build a trusted foundation is to choose one AI use case where getting the data wrong would have a clear cost.
It could be an internal assistant that helps sales teams understand account health. It could be a support tool that retrieves knowledge from product and customer systems. It could be an operations workflow that uses AI to prioritize work. Pick something concrete, then map the data that supports it.
Identify the datasets and fields that the workflow needs. Name the owners. Document the business meaning. Trace the transformations. Classify the sensitive elements. Decide what the system should and should not be allowed to access. Define how the team will know if the input data becomes late, incomplete, or structurally different.
That exercise usually exposes the missing pieces quickly. Sometimes the problem is a lack of lineage. Sometimes it is unclear ownership. Sometimes it is a security policy that exists on paper but has not been connected to the data flow. Each finding gives the team a practical place to improve.
Make AI Data Readiness Part of Everyday Data Operations
The strongest foundations are not built in a one-time AI readiness project. They are maintained through the ordinary work of running the data stack.
When data is ingested, it should have a known owner and a useful description. When it is transformed, lineage should capture the relationship between source and output. When it is classified, access controls should reflect that classification. When it feeds an AI workflow, the team should be able to see the dependency and monitor the health of the input.
That's why a Unified DataOps approach is useful — it's the direct antidote to the tool sprawl problem described above. Governance, lineage, observability, and security work best when the context does not have to be reconstructed from a set of disconnected tools every time a question arises.
Matia brings ETL, observability, catalog, and reverse ETL together in one unified DataOps platform. Its catalog capabilities focus on organizing and trusting data assets with lineage tracking and clear ownership, while its observability tooling provides visibility into freshness, volume, schema, and data-health issues. For teams building AI workflows, that connected context can help make the data easier to understand, govern, and monitor as it moves through the stack — without adding yet another disconnected tool to the pile.
Trustworthy AI Starts With Data People Can Explain
The question is not whether an organization has enough data for AI. Most organizations do. The more useful question is whether the people responsible for that data can explain what it is, where it came from, how it changed, who can use it, and what depends on it.
Governance provides the accountability. Lineage provides the trail. Security provides the control. Together, they turn a large collection of data into a foundation that teams can use with more confidence.
That foundation will not remove every AI risk. It will give your team a much better way to see the risks that begin with data, before they show up in an AI output or a business decision.
Ready to Build a Trusted Data Foundation for AI?
If your team is building AI workflows on top of data that lives across disconnected systems, Matia can help bring the context around that data into one unified view.
Book a demo with Matia to see how a unified DataOps platform can help your team connect governance, lineage, observability, and ownership around the data that powers your AI initiatives.
A dashboard is wrong. A data engineer can see that the affected metric comes from the revenue_daily model, which comes from the orders table, which is loaded from the billing platform. That is table-level lineage. It is a useful start.
But it does not answer the question that actually determines the fix: Did the issue come from gross_amount, a new discount rule, a missing refund, or a filter that dropped a subset of orders?
That is where column-level data lineage earns its place. It tracks the journey of individual fields through the data stack, including the transformations that change their meaning along the way. Instead of showing only that two datasets are connected, it shows how a source field becomes a metric, a model feature, a dashboard value, or an activation attribute.
For teams trying to make analytics reliable, build AI they can trust, and meet growing governance expectations, that extra level of detail is not a nice-to-have. It is the difference between guessing and knowing.
What Is Column-Level Data Lineage?
Column-level data lineage tracks how individual data fields move from source to destination and how each field is transformed along the way. It shows the source columns, calculations, joins, filters, and business logic behind a metric, model feature, dashboard value, or activation attribute.
Column-Level vs. Table-Level Lineage: What Is the Difference?
A table is a convenient unit for storage and engineering. It is not always the right unit for reasoning about impact.
One source table can contain dozens or hundreds of fields. A downstream model may use only three of them. A business-critical KPI may depend on one calculation hidden inside that model. A privacy-sensitive field might enter the same source table but never flow to the dashboard in question. When the lineage view stops at the table, every field looks equally relevant. Every downstream asset can look equally exposed.
Column-level lineage restores the missing precision. It allows teams to see which input columns contribute to a given output column and how they contribute. A relationship may be a direct mapping, a calculation, an aggregation, a join, a filter, or conditional logic. Each distinction changes how the output should be interpreted and how an upstream change should be assessed.
Imagine a net_revenue metric. At a table level, a team can see that the metric comes from orders and refunds. At a column level, the team can see that it is built from gross order value, discounts, refunds, currency conversion, and a rule that includes only completed orders. If refunds suddenly appear to spike, that field-level view gives the team a direct path to the logic and data that require investigation.
This is not about creating a more complicated diagram. It is about being able to ask a more useful question: What does this field mean here, and what changes if it is wrong? For a closer look at how column-level detail connects to the broader catalog, see how lineage and cataloging work together.
How Does Column-Level Lineage Improve Analytics?
Analytics teams are frequently asked to defend a metric after the fact. Why did conversion drop? Why does finance have a different revenue number? Why did a customer segment disappear from a campaign audience?
Without field-level context, these investigations become slow and expensive. Teams open SQL models, trace joins by hand, compare revisions, search documentation, and ask around for the person who may remember why a rule exists. The work is familiar, but it should not be normal.
Column-level lineage changes the starting point. An analyst looking at net_revenue should be able to see the inputs that define it: gross order value, discounts, refunds, currency logic, and the conditions that determine which orders count. If refund_amount changes upstream, the data team can identify the metrics and dashboards that actually rely on it. If a new filter removes test orders, the business can understand which outputs will be affected before the change reaches executives.
The same principle applies beyond finance. An active-customer metric should reveal the event logic and dates used to qualify a customer. A conversion-rate metric should reveal its trial-start rule, payment event, attribution logic, and exclusion criteria. A high-value marketing audience should expose the lifetime-value inputs, consent flags, and audience rules that determine membership.
The benefit is not just shorter incident resolution. Field-level lineage makes change management more disciplined. It gives data engineers a focused impact analysis, gives analysts a defensible explanation of business logic, and gives stakeholders more confidence that a number reflects the definition they intended to use.
Why Does Column-Level Lineage Matter for AI?
AI systems do not automatically understand data because a field has a plausible name. A column called customer_value could represent historic revenue, a predicted lifetime value, a manually assigned sales tier, or an internal risk score. If an agent, retrieval workflow, or model uses the wrong interpretation, the result may appear credible while being materially misleading.
That is why AI readiness is not simply a matter of giving a model more data. It is about giving the model and the people overseeing it the right context. Column-level lineage helps preserve that context by showing where a field originated, what logic created it, who owns it, and which downstream products already depend on it.
For an AI team, field-level lineage helps establish whether a field comes from a system of record or an experimental model. It shows whether the field was copied directly, aggregated, anonymized, or derived from other attributes. It also makes it easier to assess whether a changing business definition could affect an existing AI workflow, whether the field is connected to sensitive information, and which owners should be involved before the data is put to a new use.
The goal is not to bury AI teams in metadata. It is to prevent data from arriving stripped of the meaning needed to use it responsibly. Context should travel with the data, not sit separately in a stale document or remain trapped in one person’s memory.
How Does Column-Level Lineage Support Data Governance and Compliance?
Compliance discussions often begin with a simple request: identify where a category of data lives and where it goes. The answer becomes more difficult in a distributed stack, especially when data is copied into reporting models, transformed for analysis, or sent to operational tools.
Lineage alone does not make an organization compliant. Applicable obligations depend on the processing activity, jurisdiction, policies, and controls. But an organization is in a much stronger position when it can investigate data flows at the level at which sensitive data is actually handled.
Column-level lineage gives governance and privacy teams a clearer evidence trail. A team can trace whether an email address was copied to a downstream dataset, transformed into a hash for an audience, aggregated into a count, or omitted altogether. It can identify the downstream models that use a customer identifier and the owners who should assess the impact of a retention, consent, or access-policy change.
This precision also improves collaboration. Privacy, security, engineering, and analytics teams do not have to argue from disconnected spreadsheets or broad table-level assumptions. They can work from a shared view of the specific data elements and transformations at issue. For a broader look at how lineage fits into a compliance-ready data foundation, see data governance, lineage, and security for AI.
How Do You Implement Column-Level Data Lineage?
Not every organization needs to map every field across every system on day one. The fastest path is to start where uncertainty carries the highest cost: executive metrics, regulated or sensitive fields, critical activation workflows, and datasets that will power AI use cases.
A practical program starts by capturing transformation logic, not only connections. A direct copy, a sum, a join key, a CASE WHEN expression, and a filter do not have the same meaning. Recording the type of relationship helps a team distinguish an input that creates an output value from one that simply influences which values appear in the output.
It also combines technical lineage with business context. A data engineer needs the SQL dependency. An analyst needs the metric definition. A governance lead needs the classification and policy context. A useful lineage experience brings those perspectives together through ownership, documentation, semantic definitions, and quality signals.
Accuracy matters just as much as coverage. Lineage that depends on manual updates will drift as pipelines evolve. Teams should capture lineage from the systems that ingest, transform, model, and move data whenever possible, then add the human context that automated collection cannot infer.
Finally, lineage has to be available where teams already work. Its value is realized when it supports schema-change reviews, data incidents, dashboard investigations, AI design, and governance assessments. When lineage is missing, tracing the root cause of pipeline failures takes far longer than it should. If it lives only in a separate tool or a diagram that no one opens, it will not change decisions.
Why Does a Unified DataOps Platform Make Column-Level Lineage More Useful?
Column-level lineage is most valuable when it is part of a wider operational context. A transformation is easier to trust when the team can also see its owner, freshness and quality status, business definition, and downstream use. An impact analysis is faster when ingestion, modeling, cataloging, observability, and activation are not fragmented across disconnected systems.
Matia brings together ETL, observability, catalog, and reverse ETL in a unified DataOps platform. This connected approach helps teams reduce fragmented context and gives them a more useful way to understand the relationship between data, meaning, quality, and downstream action. If you are weighing whether to keep stitching together standalone tools or move to one platform, this buyer's decision framework walks through the tradeoffs.
What Should You Trace First?
If your team cannot explain an important metric, AI input, or operational attribute from field origin to downstream use, start there. Pick one critical output and trace the columns that matter. Identify the transformation logic, the owner, the quality expectations, and the places where the output is consumed.
That exercise quickly reveals whether your data stack has visibility, or only the appearance of it.
Column-level lineage gives teams the detail needed to move from “we think this is connected” to “we know how this field is used.” For analytics, AI, and compliance, that is where trust begins.
Ready to Bring More Context to Your Data?
When your team can connect data movement, business meaning, quality, and downstream use, it can spend less time chasing answers and more time using data with confidence.
Book a demo with Matia to see how a unified DataOps platform can help your team create a clearer, more connected view of the data that powers your business.
Most teams do not start shopping for observability because everything is going well. They start looking after a familiar mess: a dashboard is stale, finance and marketing have different numbers, or a customer list has been syncing with bad data for days. The pipeline may have technically succeeded. That is the frustrating part.
A data observability platform should make those problems easier to catch and easier to untangle. Plenty of products can send an alert. Fewer can tell you whether the alert matters, what changed upstream, which downstream assets are at risk, and who should own the next step.
That is the standard to use when you evaluate a platform. Do not buy a prettier alert feed. Buy something that helps the team spend less time guessing.
What Is a Data Observability Platform?
A data observability platform tracks the health of your data as it moves through the stack. It watches for signs that data is late, missing, unexpectedly large, structurally different, or behaving in a way that does not match the usual pattern.
The useful platforms do more than watch jobs. They look at the data itself and give teams enough context to investigate an issue without opening five different tools first. A delayed table matters differently if it feeds an internal report than if it powers an executive KPI, an outbound campaign, or a customer-facing product.
What Problems Should the Platform Help You Catch?
Start with the incidents that cause the most pain today, not hypothetical risks. Focus on real problems that keep coming back.
Maybe a source system delivers half the normal number of records at month end. Maybe someone changes a field type and an important dbt model starts producing nulls. Maybe a reverse ETL audience looks healthy until a sales rep notices that thousands of qualified accounts are missing. Those are the situations your evaluation should center on.
A worthwhile platform should help you catch late data, missing data, schema changes, duplicate records, unusual spikes or drops, and unexpected changes in business metrics. It should also let you set explicit checks for the things the business already knows are important, such as a required consent field or a reconciliation between billing and finance data.
If a vendor cannot show how its product handles a failure you have actually experienced, the rest of the demo matters a lot less.
Which Data Health Signals Matter Most?
Freshness, volume, schema, and distribution are the basics. Buyers should still press for detail because “we monitor freshness” can mean very different things depending on the product.
Freshness tells you whether data arrived when it was supposed to. Volume gives you a way to spot missing records, duplicate loads, or a sudden jump that makes no business sense. Schema monitoring catches changes that can quietly break models or downstream reports. Distribution checks help surface shifts in null rates, value ranges, or other patterns that may point to a data problem before a stakeholder spots it.
The test is simple. Ask the vendor to open a dataset from your environment and explain what normal looks like, how the baseline is established, and what happens when the data departs from it. A good answer is specific. It should not be a generic dashboard tour.
Can You Trust the Anomaly Detection?
Anomaly detection sounds impressive until it fills Slack with alerts no one believes.
Every data team has normal exceptions. There are month-end surges, planned backfills, new product launches, holidays, and one-off migrations. A platform that treats all of those events as emergencies will lose the team quickly. On the other hand, a system that requires somebody to write a rule for every possible failure will become another maintenance job.
Look for a sensible middle ground. The product should learn normal behavior where that is useful, let teams tune or suppress alerts when they have a reason, and keep room for explicit rules around business-critical data. Ask to see an example of how the platform deals with a backfill or a known seasonal spike. That conversation usually reveals more than a list of anomaly-detection features.
What Does an Alert Look Like When Something Actually Breaks?
The alert itself is rarely the hard part. The hard part is the hour after it arrives.
When a table goes stale or a metric suddenly drops, an engineer needs a fast way to answer a few basic questions. What changed? Did a job fail, or did the job finish with bad data? Is the issue upstream? Has a recent schema change or code deployment contributed to it? What reports, models, and operational workflows use this data?
That context should be part of the product experience, not a scavenger hunt. Logs, recent runs, schema history, ownership, and data lineage all matter here. The best platforms make it easier to separate a minor nuisance from an issue that deserves immediate attention.
Do not settle for a demo that starts with a perfectly labeled alert. Ask the vendor to show the investigation flow for a messy incident, including the path from the original anomaly to the likely root cause and downstream impact.
Does the Platform Help the Right Person Respond?
A data team does not need more alerts landing in one shared channel. It needs better routing.
Look at how the platform handles ownership, escalation, and notification preferences. Can a finance data owner see problems tied to finance models? Can an engineer take responsibility for an ingestion issue without pulling in everyone who uses the downstream dashboard? Can the system group related alerts so one upstream failure does not create thirty separate tickets?
The operational workflow matters as much as the monitor. A good platform fits where people already work, whether that is Slack, an incident-management tool, or the engineering workflow around dbt and code review. Otherwise, it becomes another destination that somebody has to remember to check.
Can It Work With the Tools You Already Use?
Integration pages are easy to make look impressive. The question is how much useful context comes through each connection.
Your warehouse, orchestration layer, ingestion tools, dbt project, BI tools, catalog, and activation systems all hold a different part of the story. A shallow integration may confirm that a table exists. A deeper one can surface job details, query history, tests, tags, model definitions, ownership, lineage, and downstream usage.
For teams that run dbt, this is particularly important. Your dbt project already contains valuable context about models, tests, tags, and dependencies. It makes little sense to recreate all of that work in an observability product. Ask how the platform uses the information you already maintain and how it behaves when your project changes.
The same logic applies to your data catalog and alerting workflow. The platform should reduce context switching, not add another layer to it.
Do You Need Both Automatic Monitoring and Custom Rules?
Yes. These capabilities solve different problems.
Automatic monitoring is useful for the things you do not yet know to look for. It can flag a volume drop, a surprising shift in null values, or a delay that falls outside normal patterns. Custom SQL rules are for checks that deserve no ambiguity, such as an approved finance threshold, a contractual service-level expectation, or a field that must never be empty.
The buying question is not whether the product supports both. Almost every vendor will say it does. Ask how hard it is to set up and maintain each type of check. Can analysts and data owners create a clear business rule without opening a ticket? Can engineers keep custom SQL checks close to the models they govern? Can existing dbt tests be surfaced instead of rebuilt?
The right platform makes data-quality work easier to own. It does not turn it into a second pipeline.
What Will the Platform Cost After the First Month?
Do not evaluate cost only through the first-year subscription. Ask what happens when coverage expands from a few critical tables to hundreds or thousands of data assets. Understand what drives pricing: rows scanned, warehouse queries, monitors, users, data sources, or some combination of those things. For reference, see how Matia structures its own pricing across these dimensions.
There is also a people cost. A lower-priced product can become expensive if it needs constant tuning, manual ownership updates, duplicated rules, or daily alert cleanup. A platform should pay back part of its cost by shortening investigations and taking repetitive monitoring work off the team’s plate.
Security belongs in the same conversation. Know what metadata the platform reads, where it stores information, how access is controlled, and how it fits your company’s security and privacy requirements. Observability should improve confidence in the stack. It should not create a new blind spot.
How Should You Run a Proof of Value?
Pick a handful of data products that people genuinely care about. A revenue dashboard, a sales audience, a finance model, or a product metric will work better than a random staging table.
Then test the platform against real failure modes. Delay a feed. Change a schema. Create a volume drop. Introduce a null-rate spike. Ask the team to use the product to find the issue, understand the impact, and decide who owns the fix.
Keep the scorecard practical. How long did detection take? How much manual searching was required? Did the alert point to useful context? Could the team see the affected assets? Did anyone have to rebuild information that already existed in another tool?
A proof of value should leave your team with clearer answers, not just more screenshots.
Why Does a Unified DataOps Platform Matter for Observability?
Observability gets more useful when it has access to the rest of the data lifecycle. The monitor can tell you that something changed. Lineage can show what depends on that change. Catalog information can explain ownership and meaning. Ingestion and transformation context can help narrow down the cause.
Matia brings ETL, observability, catalog, and reverse ETL together in one unified DataOps platform. Its observability capabilities include automatic monitors for freshness, volume, and schema; custom SQL rules; real-time alerts; data-health dashboards; and root-cause investigation supported by logs and lineage. Matia also connects with dbt workflows, so teams can bring tests, tags, and configurations into the same operational view.
That can give a data team a more complete picture without asking it to stitch together several disconnected products during an incident. Ramp relies on this kind of unified visibility to keep its financial data reliable at scale.
What Should You Do Before Signing a Contract?
Bring your messiest incident to the evaluation. The one that involved stale data, unclear ownership, a long Slack thread, and a dashboard nobody trusted by the end of the day. See how each platform handles it.
The right tool will not prevent every data issue. It should make the next one less painful. It should help your team see the problem earlier, understand the impact faster, and get to the fix with fewer assumptions.
Ready to See Data Observability in Context?
If your team is tired of chasing data issues across disconnected tools, Matia can help bring monitoring, lineage, and operational context closer together.
Book a demo with Matia to see how a unified DataOps platform can help your team detect problems earlier, investigate them with more clarity, and keep the data your business relies on in good shape.
Over a dozen new source connectors shipped this quarter, covering AI ad platforms, enterprise search, survey and research tools, and HR systems. A few call outs, the email connector pulls attachments straight into your warehouse instead of requiring manual forwarding. And the Claude Platform connector lets teams leaning into Claude run analytics on their own usage data. Klaviyo is a new connector. StackAdapt now supports additional objects for ad-tech activation.
Meta Ads Destination lets you build a custom audience during setup instead of creating it separately first. And you can now use S3 as a reverse ETL source, so data landing there doesn't just sit unused.
Meta Ads Destination — Create a Custom Audience in Meta directly during setup. (Reverse ETL)
A completed Snowflake sync can now trigger a downstream Snowflake Task automatically. No separate orchestration tool required. And Datadog customers can filter what's ingested using Datadog's own native syntax, instead of pulling in all logs by default.
Snowflake Tasks as a post-run action — A completed sync triggers a Snowflake task automatically, no separate orchestration tool required. (ETL)
Datadog — Filter what gets ingested using Datadog's own native syntax, instead of ingesting all of it by default. (ETL)
Data Quality and Lineage
Custom SQL monitors now support investigation queries and breached row analysis, so you can see the specific rows behind an alert instead of just the fact that it alerted. Lineage error nodes help too: when a referenced node can't be found, usually a permissions issue, it now shows up as an error instead of failing silently. And if Omni is your BI layer, catalog lineage now extends into it, so you can trace a number on a dashboard back to the model that built it.
Custom SQL monitors: investigation queries and breached row analysis — See the exact rows that triggered a monitor breach. (Observability)
Lineage error nodes — When lineage can't find a node, it now shows up as an error instead of disappearing silently. (Catalog)
Omni — Catalog lineage extends into Omni. (Catalog)
BigQuery: Three Pillars, One Connector
BigQuery on Matia now also supports observability, lineage, and reverse ETL on top of ETL. This expansion enables full end-to-end visibility into your BigQuery data, from the moment it lands to the moment it's activated downstream, all without stitching together a separate tool for every stage. No more piecing together your BigQuery stack from three different vendors just to know where your data came from and whether it's still trustworthy.
Enterprise Security and Procurement
Matia now supports customer-managed encryption keys, for security reviews that start with who holds the keys. Matia is also available on Google Cloud Marketplace, so GCP customers can buy through existing procurement and committed spend.
CMEK support — Customer-managed encryption keys, for security reviews that start with who holds the keys. (Platform)
Google Cloud Marketplace — Buy Matia through existing GCP procurement and committed spend. (Platform)
Coming Soon: Matia MCP
Matia MCP connects your AI tools straight to your governed data, so a question becomes an answer without detouring through five systems. It's in private preview now, get Early Access.
We're a unified DataOps platform built for the AI era by combining the power of ETL, Reverse ETL, Observability, and Catalog, because it sucks to have disparate systems and no control over your data stack.
Want us to set you up with a free trial or demo? Reach out here.
If you've ever managed data integrations by clicking through a UI, you know the drill. You set up a source, a destination, and set a schedule. It works great, until six months later someone asks "wait, why is this table syncing every hour?" and you can’t trace that change back to a ticket.
Terraform fixes that. Your pipelines become files that live in source control—usually Git—so they get the same history, reviews, and accountability as the rest of your software. Every committed change records what changed and who made it, and a good commit message links the change to a ticket, story, or brief explanation of why it was made. Six months later, you can trace that hourly sync back to the exact commit instead of guessing.
Matia now ships a Terraform provider that lets you define sources, destinations, and the sync jobs between them, all as code you can diff and review like everything else your engineering team ships.
This post walks through two real, runnable examples: Postgres to Snowflake, and MySQL to BigQuery. Both live in this repo, so you can follow along and then go run them yourself.
Five resources to remember
Before we touch any code, here are the five resources the Matia provider revolves around:
matia_destination: where your data ends up (a warehouse, usually).
matia_integration: the pipe connecting a source to a destination.
matia_integration_schedule: how often that pipe runs.
matia_integration_schema: which tables and columns actually flow through it.
That last point trips people up the first time. A source, a destination, and an integration alone don't sync anything. You need the schedule and the schema resources too, or you've just declared an empty pipe. Keep that in mind, we'll come back to it.
One more thing worth knowing up front: matia_source and matia_destination don't have a different Terraform schema for every connector. They both take a type field plus a free-form connection_config/connection_secrets JSON blob. That means the same five-resource pattern works for any connector pair that Matia supports. Postgres, MySQL, Snowflake, BigQuery, whatever's next. Learn the pattern once, and you’re set for future pipelines!
First things first
The Terraform configuration is only one part of a working data pipeline. Before you run the examples, make sure the systems on both ends are ready.
At a minimum:
The source database must be reachable from Matia.
The source must satisfy the connector-specific prerequisites for the sync mode you plan to use, including any CDC configuration and database permissions.
The destination credentials must be able to create or write to the target database and schema.
The source tables referenced in matia_integration_schema must already exist.
Your Matia API key must have permission to create and manage the relevant assets and integrations.
The exact database grants and CDC settings depend on the connector. Check the relevant Matia connector documentation before treating terraform apply as an end-to-end readiness test.
For a first deployment, it’s also helpful to keep the schedule manual. That lets you inspect the resources Terraform created before the pipeline starts moving production data.
Install and configure the provider
First, you need to create a Matia API key. You can do this within Matia by navigating to Settings > Admin > API Tokens and clicking “Generate Token.” Once you have your API key, start by declaring the provider source and a compatible version constraint:
(Note: Terraform security practices are out of scope for this article, but Hashicorp provides a wealth of guidance to help teams ensure their infrastructure and infrastructure-as-code remain secure.)
Example 1: Postgres → Snowflake
Let's build a pipeline that replicates a Postgres table into Snowflake.
Nothing exotic here. connection_config holds the stuff you wouldn't mind seeing in a log; connection_secrets holds the stuff you very much would mind seeing in a log. Terraform keeps them separate so you can treat them differently in your variable definitions.
Same shape, different connector. That's the whole point!
The integration, schedule, and schema
This is where the source and destination actually get connected, and where the pipeline gets told what to sync and when:
resource "matia_integration""postgres_to_snowflake" {
name = "tf-example-postgres-to-snowflake" source_id = matia_source.postgres.id
destination_id = matia_destination.snowflake.id
destination_schema = var.destination_schema
source_settings = jsonencode({
incremental_mode = "Change Stream" max_clients = 4 })
}
resource "matia_integration_schedule""postgres_to_snowflake" {
integration_id = matia_integration.postgres_to_snowflake.id
replication_frequency = "manual"}
# Enables the "users" table in the "public" schema for sync. The table must
# already exist in the source Postgres database - adjust this block (or add
# more tables) to match your actual schema before running terraform apply.
resource "matia_integration_schema""postgres_to_snowflake" {
integration_id = matia_integration.postgres_to_snowflake.id
config = jsonencode({
schemas = {
public = {
tables = {
users = {
enabled = true syncMode = "change_stream" }
}
}
}
})
}
A few things worth calling out:
source_id and destination_id reference the resources by their Terraform-managed .id. Terraform figures out the dependency order for you: source and destination get created first, then the integration, then the schedule and schema.
syncMode = "change_stream" means Postgres CDC. Matia reads the replication stream instead of polling the table, which is both faster and gentler on your database.
replication_frequency = "manual" means nothing runs until you trigger it, either from the Matia UI or by hitting the /integrations/{id}/run endpoint. That's a deliberately safe default for a first apply. Nobody wants their first terraform apply to also be their first production sync.
Example 2: MySQL → BigQuery
Same pattern, different connectors. Here's the source:
The auth_method field is new here, since BigQuery needs to know it's getting a service account key rather than a username/password pair. Otherwise, still the same type + connection_config/connection_secrets shape as Postgres.
The integration side looks almost identical to the Postgres example, with one small but important difference in sync mode:
resource "matia_integration""mysql_to_bigquery" {
name = "tf-example-mysql-to-bigquery" source_id = matia_source.mysql.id
destination_id = matia_destination.bigquery.id
destination_schema = var.destination_schema
source_settings = jsonencode({
incremental_mode = "Change Stream" max_clients = 4 })
}
resource "matia_integration_schedule""mysql_to_bigquery" {
integration_id = matia_integration.mysql_to_bigquery.id
replication_frequency = "manual"}
# Enables the "users" table for sync. The table must already exist in the
# source MySQL database - adjust this block (or add more tables) to match
# your actual schema before running terraform apply. MySQL CDC uses syncMode
# "incremental" together with source_settings.incremental_mode above.
resource "matia_integration_schema""mysql_to_bigquery" {
integration_id = matia_integration.mysql_to_bigquery.id
config = jsonencode({
schemas = {
(var.mysql_database) = {
tables = {
users = {
enabled = true syncMode = "incremental" }
}
}
}
})
}
MySQL CDC uses syncMode = "incremental" instead of Postgres's "change_stream". Small detail, easy to miss, and exactly the kind of thing you'd rather have documented in a .tf file than in someone's head.
Actually running this thing
Both examples in this article are self-contained root modules. Pick one, cd into it, and run:
cd examples/postgres-to-snowflake
cp terraform.tfvars.example terraform.tfvars
# edit terraform.tfvars with your real Postgres/Snowflake/Matia valuesterraform init
terraform plan
terraform apply
Once applied, you get a few useful outputs back:
output "source_id" {
  description = "Postgres source asset ID"
  value       = matia_source.postgres.id
}

output "destination_id" {
  description = "Snowflake destination asset ID"
  value       = matia_destination.snowflake.id
}

output "integration_id" {
  description = "Matia integration ID (for manual runs and API validation)"
  value       = matia_integration.postgres_to_snowflake.id
}
Grab integration_id and use it to trigger your first manual sync, either through the UI or the API. Once you like what you see, you can flip the schedule to something automatic.
No live credentials? You can still sanity check your config. terraform init, terraform validate, and terraform fmt all run fine without hitting the real Matia API or your actual databases.
Leveling up from here
Once you have a basic pipeline running, there are a few different ways to build upon it:
Turn on automatic syncing. Change replication_frequency from manual to hourly, daily, or cron:
Sync more tables. Add more entries under schemas.<name>.tables in your matia_integration_schema resource. Each table gets its own enabled flag and syncMode, so you can bring tables online one at a time instead of flipping a big switch.
Add Terraform checks to CI. Once the pipeline configuration lives in Git, have your CI system run terraform fmt -check, terraform validate, and terraform plan on every pull request. That catches formatting and configuration mistakes before merge, and gives reviewers a preview of exactly what will change in Matia. Keep terraform apply behind an approval step, or run it only after changes land on your main branch, so pipeline updates follow the same review process as the rest of your infrastructure.
Why bother with Terraform?
You could do all of this by hand in a UI, plenty of people do. But the moment you have more than a handful of pipelines, or more than one person touching them, infrastructure-as-code becomes an invaluable practice. A pull request shows exactly what changed and who approved it. terraform plan tells you what's about to happen before it happens. And when someone asks "why does this sync every hour," the answer is one git blame away instead of a shrug.
Both full examples, along with everything you need to run them, are in this repo:
If you're wiring up a connector pair that isn't Postgres or MySQL, the pattern doesn't change. Swap the type and the connection_config/connection_secrets keys for your connectors, keep the same five resources, and you're ready to go.
Most companies handing agents access to their data stack are solving the wrong problem. They're writing guardrails, tightening permissions, and adding approval steps. What they're not doing is making the correct path the easiest one to walk.
Every episode of Crunching Data before this one was recorded over Zoom. This one we did live in June 2026, on stage at Ramp's New York headquarters, in front of a room full of data people. Benjamin Segal hosted Ian Macomber, VP of Data at Ramp, and Ryan Delgado, who leads Ramp's data platform team. Ramp is a Matia customer and Matia is a Ramp customer, which made for a franker conversation than most.
If you're rolling out AI tooling to people who don't write SQL, this one is worth your time.
Here are some areas we dive into:
Ramp counts the days, and the number is 2,648 (at least at time of recording)
Ramp is a $44 billion company with more than 1,500 employees. It still runs on zero-to-one thinking, partly by design.
"We count the days that we've been in business at Ramp. And so today is 2,648. We start every single all hands meeting by talking about what day it is."
The other reason is structural. Ramp's growth isn't one curve, it's a stack of smaller ones: corporate cards, then bill pay, then procure-to-pay, then travel, treasury, accounts receivable, and now token spend management with an LLM gateway called Ramp Router. Every new bet resets somebody's clock to zero. As Ryan put it, it's a small startup inside a startup.
The economics team cost three billboards
Ian wanted to build an economics team. Ramp's co-founder and CTO thought it was a frivolous use of money. Ramp had recently run a billboard campaign that underperformed, so Ian knew exactly what a billboard cost, and what an economist would cost for a year.
"I can do more with an economist for a year than you can do with three billboards in 12 weeks."
He got the economist, then spent the next year quoting every budget request in billboard units. The hire was one person expected to write, do the economics, do the data science, build visualizations at newspaper quality, and shoot vertical video. Ramp's economics work now gets cited by the Financial Times. Ian calls the underlying principle investing from success: hire someone who can do the craft, watch what one motivated person produces alone, then scale whatever works.
Speed was the feature
In late 2023 Ryan's head of engineering handed him a problem. The product was slow, large enterprise customers were escalating, fix it. His team shipped in about six weeks, moving analytical queries onto ClickHouse as an OLAP layer.
The dashboard it was built for has since been retired, but the lesson held. What surprised Ryan was how much of the customer experience turned out to be latency. Making the application fast was the feature. ClickHouse now serves four to five hundred queries per second on Ramp's backend across roughly 20 canonical tables.
Buy vendors like you do talent; for slope, and empower your team to spend
Ryan's build-versus-buy rule is short. Build what your company is known for. Buy the rest, even the functions you need to do extremely well, because doing them well doesn't make Ramp Ramp. When he does buy, he evaluates vendors the way he evaluates candidates.
Not how good the product is today, but how much better it will be in two or three years. Is the founder customer obsessed? Is the team talent dense? You're investing in a team, not only a product.
Ian added the part you can act on tomorrow. Ramp lets junior employees who are passionate about a tool spend the money on it: under $15,000 just do it, around $30,000 do it and explain how you'll know it worked, more than that let's talk. Ramp got onto Hex because one enthusiastic person drove the rollout. The inverse is Ramp's churn signal, which is nobody internally being excited to take the vendor call anymore.
Seven out of ten data science fails quietly
Ramp's designers talk about seven out of ten design: build enough tooling that anyone can produce something decent, and let designers spend their time on what has to be a ten. Ian's team pulled that off for data science, then found the catch. Bad design fails loudly. Bad data science doesn't.
"It fails pretty silently, which is like a number that looks right but isn't."
He told a story about Ramp's chief product officer building what Ian charitably called a slop dashboard. When Ian pushed back, the answer stung: the only existing dashboard hadn't been shared in a standup, hadn't come up in Slack, and hadn't been updated in six months. Ian's read is that this is a data team problem. Attention is finite, and if your team doesn't build the assets everyone looks at, someone else defines reality for them.
Paved paths, not just guardrails
Project Glass started as one engineer's idea: put a coding agent inside a desktop application. Ryan admits he didn't see the point at first. What made it take off wasn't model access, it was the baked-in opinions and the paved paths into Ramp's internal systems. Glass connects to an internal app platform called Ramplify, carries a skills marketplace called Dojo, and ships Ramp Research, their data analyst agent, as a skill bundle. More than a thousand people at Ramp use it, most of them not engineers.
Which is exactly why the fundamentals got more important, not less.
"Well-modeled, curated, high-quality data is an absolute P0."
A data professional who gets a strange number will squint and ask whether the data looks right. Someone who isn't SQL-native won't. They'll read that revenue is two trillion dollars and take it at face value. So you give people reasonable defaults and automatic setup: the Ramp Research skill installs itself when someone connects the Snowflake connector inside Glass. Doing things for people before they ask is what makes it scale.
That's also how the semantic layer stopped being a data team concern. Ian's head of investor relations and CFO now know what one is and discuss it with customers.
Ryan's security corollary is worth repeating to anyone shipping agents this quarter. Agents inherit your permissions. If you hold the account admin role on Snowflake, so does your agent, and it will use it. Every access control that was merely good hygiene three years ago is load-bearing now. Mask the sensitive fields, give read access to production rather than the ability to mutate it, and then let it run.
Your next data hire may not be a data person
Ian's bet for the next few years is that data teams will hire more for business domain expertise than for data skill set. His example is a teammate who came through investment banking, private equity, a family fund, and a stint as chief of staff to a CFO.
"The limiting factor for her was never really like her technical ability."
She pushed some genuinely bad code her first month and better code her second. By the third month nobody remembered she hadn't always been on the data team, and the CFO now pings her directly. Four years ago Ramp hired heavily out of the dbt Slack community. Ian isn't looking there anymore. He wants someone who can push back on a CFO and change his thinking, because the stack is teachable.
How Ramp uses Matia
Ramp runs Matia for ETL from third-party sources and internal databases. Before the switch, historical resyncs took as long as 3.5 days and degraded over time. They now finish in about four hours, cutting sync time by more than 80%.
For the record, asked for a bet the room would push back on, Ryan's first answer was that Matia will be a $10 trillion company. We're holding him to it.
Ripping out a core piece of data infrastructure is terrifying. You know the current tool is too expensive or too slow, but it is a devil you know. The thought of migrating your entire ingestion layer feels like performing open-heart surgery on your data stack while the patient is awake.
The reality is that a Fivetran migration does not have to be a multi-month ordeal.
When data teams get bogged down in migrations, it is rarely because the new tool cannot connect to the old sources. It is because they try to cut over without a structured plan for reconciliation, or they realize too late that downstream dbt models expect a very specific schema structure.
If you are planning a move away from Fivetran, you need a plan that protects production data while you switch the pipes. This checklist covers exactly how to map your dependencies, run a parallel test, and execute a safe cutover.
Phase 1: Map the Blast Radius
Before you touch a single pipeline, you have to know exactly what Fivetran is currently touching. This is the discovery phase, and skipping it is the easiest way to break a dashboard the CEO looks at every morning.
Audit Your Active Connectors and Sync Frequencies
Do not trust your memory here. Pull a complete list of every active Fivetran connectors. Note the source type, the sync frequency, and the volume of data moving through it. You will likely find connectors syncing data from SaaS tools that nobody at the company has logged into for a year. A migration is the perfect time to deprecate those pipelines entirely rather than moving them.
Document Your Downstream Dependencies
This is where migrations usually go wrong. Fivetran creates specific system columns in your warehouse, like the synced at timestamp or the deleted flag. Your dbt models almost certainly reference those columns. You need to map which models depend on which raw tables, and flag any logic that relies heavily on Fivetran-specific schema structures.
Establish Your Reconciliation Tolerance
You are going to run both tools side by side and compare the output. Before you do that, you need to decide what success looks like. For financial data, your tolerance for row count discrepancies is zero. For a marketing event log, a tiny variance might be acceptable if the overall trends match. Define those thresholds before you start testing so you are not making judgment calls on the fly.
Phase 2: Build the Parallel Environment
You never want to point a new ingestion tool directly at your production schema on day one. You want a sandbox where you can break things safely.
Set Up a Dedicated Staging Schema
Create a completely separate schema in your warehouse for the new tool. If Fivetran is writing to a raw schema, point your new platform to a staging schema. This ensures the two tools will never step on each other or cause locking issues in the warehouse.
Run the Historical Backfill
Connect your new tool to your sources and trigger a full historical sync. This is your first real test of the new platform. You are watching to see how long the initial load takes, whether it hits any API rate limits on your source systems, and how the new tool handles the initial volume.
Compare the Raw Schemas
Once the historical data lands, compare it to what Fivetran loaded. You are looking for structural differences. Did the new tool cast a JSON blob as a string when Fivetran cast it as an object? Did it handle timezone conversions differently? These schema differences are what will break your dbt models, so you have to catch them here and adjust your transformation logic to account for them.
Phase 3: The Parallel Run
This is the most critical part of the migration. You are going to let Fivetran and your new tool run simultaneously for at least a week, usually two.
Monitor the Incremental Syncs
The historical load tells you if the tool works. The incremental syncs tell you if the tool works at scale. Watch how the new platform handles high-churn tables. If you are testing a tool with streaming Change Data Capture, this is where you should see replication times drop significantly compared to Fivetran's batch polling.
Run Your dbt Models Against the Staging Schema
Point a test branch of your dbt project at the new staging schema and run your models. This is the moment of truth. If your models compile and run successfully, your schema mapping was correct. If they fail, you know exactly which transformations need to be updated before you cut over production.
Reconcile the Row Counts
At the end of the parallel run, compare the row counts between the Fivetran schema and the new staging schema. If the numbers match within the tolerance you set in Phase 1, you are ready to move forward. If there are massive discrepancies, stop and investigate. It usually means one tool is handling soft deletes or history mode differently than the other.
Phase 4: Execute the Cutover
If the parallel run was successful, the actual cutover should be the most boring part of the entire project.
Pause the Fivetran Syncs
Pick a low-traffic window and pause all Fivetran connectors. You do not want to delete them yet. Just pause them so they stop writing to the warehouse. This is your safety net. If something goes catastrophically wrong, you can turn Fivetran back on and recover.
Update the Production References
Repoint your production dbt models to read from the new schema instead of the old Fivetran schema. If you built a translation layer to handle any schema differences during the parallel run, deploy that logic to production now.
Monitor the First Production Run
Trigger a full dbt run and watch the logs. Once the models build successfully, check your core dashboards to ensure the data looks correct. Have a few key stakeholders verify the numbers they care about most.
Deprecate the Old Infrastructure
Once the new pipelines have been running cleanly in production for a few weeks, you can finally delete the Fivetran connectors, drop the old raw schemas, and close the account. The migration is officially done.
Why Migrating to Matia Is Different
A lot of teams delay leaving Fivetran because they assume the migration will be a nightmare. They picture weeks of rewriting dbt models and manually reconciling row counts.
Matia was built to make this specific transition painless. The platform is fully backwards compatible with Fivetran. That means your pipelines, connectors, and configs migrate without requiring a massive rebuild.
Because Matia uses a unified DataOps platform, you are not just swapping an ingestion tool. You get ETL, Reverse ETL, Observability, and a Data Catalog in one place. And because Matia monitors data at the source, you get instant Slack alerts if a schema changes during or after the migration, preventing silent failures from reaching your warehouse.
The results are consistently dramatic. Ramp reduced their sync time by more than 80% after switching. Lopay cut their data costs by 40%. Obligo increased productivity by 83%. Recharge cut Snowflake costs 32% after unifying ETL and Reverse ETL on Matia.
Customers typically spend 30% less on Matia than Fivetran for ingestion, and report up to a 61% reduction in total data stack spend when consolidating their tools onto the platform.
Book a demo and we will walk through your current Fivetran setup and build a custom migration plan for your team.
A few years ago, buying data infrastructure was a game of assembly. You bought the best ingestion tool you could afford, wired it to a transformation layer, plugged in a reverse ETL tool to get the data out, and eventually bolted on an observability tool to figure out why the whole thing kept breaking.
That was the modern data stack. It worked, but it was not cheap, and it certainly was not easy to maintain.
Now, data leaders are looking at their invoices and their engineering backlog and asking a very different question. Do we really need five separate vendors to move and monitor our data? Or should we consolidate?
The choice between a standalone ETL tool and a unified DataOps platform is the biggest architectural decision a data team will make in 2026. This framework breaks down exactly how to evaluate that choice based on your team size, your budget, and your tolerance for debugging complex systems.
Defining the Two Approaches
Before making a decision, you have to understand the fundamental difference in philosophy between these two approaches.
A standalone ETL tool does exactly one thing. It extracts data from your source systems and loads it into your warehouse. It is a specialized piece of software designed to be one component in a larger stack. Fivetran, Airbyte, and Stitch all fit this model.
A unified DataOps platform consolidates the core data movement and monitoring layers into a single control plane. It handles the ingestion, but it also handles the reverse ETL to push data back to your business apps, the observability to monitor data quality, and the catalog to track lineage. Matia is built on this model.
The decision is not just about features. It is about how you want your team to spend their time.
When to Choose a Standalone ETL Tool
There are specific scenarios where buying a standalone ingestion tool makes the most sense for a business.
You Are Building a Prototype or MVP
If you are a two-person startup and you just need to get Stripe data into a Postgres database by Friday, you do not need a comprehensive DataOps strategy. You need a pipe. A lightweight, standalone ELT tool will get you up and running quickly without forcing you to think about lineage or reverse ETL before you even have a dashboard.
Your Stack Is Already Heavily Entrenched
If you have spent the last three years building a highly customized, tightly integrated stack with dedicated tools for every function, and that stack is actually working well, ripping it out to consolidate might not be worth the disruption. If you have the engineering headcount to manage the complexity and the budget to pay the invoices, a standalone tool can slot into an existing architecture without rocking the boat.
You Have Extreme Niche Connector Requirements
While unified platforms cover the vast majority of enterprise sources, there are times when a company relies on a highly obscure legacy system. If an open-source standalone tool is the only one on the market with a community-built connector for that specific system, your decision is essentially made for you.
When to Choose a Unified DataOps Platform
For most mid-market and enterprise teams, the assembly era of the data stack has reached its breaking point. This is when the unified approach becomes the obvious choice.
You Are Spending More Time Debugging Than Building
In a fragmented stack, a broken dashboard is a murder mystery. Did the source schema change? Did the ETL tool drop a column? Did the dbt model fail? Did the reverse ETL sync timeout?
When your tools do not talk to each other, your engineers have to act as the translation layer. They spend hours checking logs across four different platforms just to find the root cause of an error.
A unified DataOps platform eliminates the mystery. Because ingestion, observability, and lineage live in the same system, you can trace an issue from the warehouse straight back to the source in seconds. The platform knows exactly what changed and where. If your team is drowning in data triage, consolidation is the fastest way to get them back to building. Recharge went through exactly this shift, unifying their stack after replication failures became too costly to keep debugging piecemeal.
You Need to Get Data Costs Under Control
Buying best-of-breed tools means paying best-of-breed prices, four times over.
You pay the ingestion vendor to move the data in. You pay the reverse ETL vendor to move the data out. You pay the observability vendor to monitor the data. And you pay the catalog vendor to map the data. Each of those contracts has its own base fee, its own usage tiers, and its own annual price increases. For a full breakdown of what those tiers actually cost, see our guide to ETL pricing models.
A unified platform collapses those costs into a single predictable bill. You are paying for the movement and management of your data, not the overhead of four separate software companies. This is why teams that consolidate typically see massive reductions in their software spend — Lopay cut their data costs 40% after moving off a fragmented stack.
You Want to Catch Errors Before They Hit the Warehouse
Standalone ETL tools are designed to move data blindly. If an upstream engineer changes a column type from an integer to a string, the ETL tool will faithfully load that string into your warehouse, instantly breaking your downstream models.
Unified platforms shift observability left. They monitor the data at the source, during ingestion. If a schema changes or a volume anomaly occurs, the platform catches it and alerts you before the data ever reaches the warehouse. You cannot do that when your ingestion tool and your monitoring tool are built by different companies.
The Hidden Cost of the Fragmented Stack
When buyers compare these two approaches, they often make a critical mistake. They compare the price of the unified platform against the price of the standalone ETL tool.
That is the wrong math.
The true cost of a standalone ETL tool is the license fee, plus the reverse ETL license, plus the observability license, plus the catalog license.
But even that is incomplete. The real hidden cost is the engineering overhead. It is the time spent negotiating four renewals every year. It is the time spent managing four different sets of role-based access controls. It is the time spent dealing with four different support queues when something goes wrong. This tool-sprawl breakdown walks through what that overhead actually looks like in practice.
When you buy a fragmented stack, you are not just buying software. You are buying the responsibility of integrating it.
Making the Decision
If your data needs are simple, your team is small, and your budget is tight, a standalone ETL tool is a perfectly reasonable place to start.
But if your data stack has become a tangled web of specialized tools, if your engineers are exhausted from debugging cross-platform failures, and if your CFO is asking why the data infrastructure bill keeps climbing, it is time to change your approach.
You do not need more tools. You need a platform that actually works together.
Why Modern Data Teams Choose Matia
Matia is the Unified DataOps Platform built for teams that are tired of managing tool sprawl. It brings ETL, Reverse ETL, Observability, and Data Catalog together under one roof.
With Matia, you do not have to choose between fast ingestion and deep visibility. The platform delivers parallel syncs that move data up to 28x faster than batch-based tools, while simultaneously monitoring that data at the source to catch schema changes before they break your pipelines.
Because everything lives in one platform, the cost savings are substantial. Customers routinely report up to a 61% reduction in total data stack spend when they consolidate their fragmented tools onto Matia.
And if you are currently running a standalone tool like Fivetran, the move is seamless. Matia is fully backwards compatible, meaning your pipelines and configs migrate in days — see our step-by-step Fivetran migration guide for exactly how that works.
Book a demo and we will show you exactly what your stack looks like when it is finally unified.
The promise of open data infrastructure sounds like exactly what the industry has been waiting for. You store your data once in an open table format like Apache Iceberg or Delta Lake. You decouple storage from compute. You own your data entirely, and you never get locked into a single proprietary data warehouse or vendor ecosystem again.
It is a beautiful architectural theory.
Then you actually try to build it. You realize that separating storage from compute means you now have to buy, integrate, and maintain an ingestion tool, a catalog to track the open formats, and an observability platform to figure out why the data lake is suddenly returning stale records.
You avoided vendor lock in, but you traded it for tool sprawl.
This is the quiet failure of the modern data stack in 2026. Data engineering teams are spending so much time stitching together "best of breed" tools to maintain an open architecture that they have no time left for the work that actually matters, managing pipelines, building dashboards, and supporting the real business problems their teams are asking them to solve.
Here is a practical guide to getting the benefits of open table formats without the crippling complexity that usually comes with them.
Why Open Data Infrastructure Usually Leads to Sprawl
To understand how to fix the problem, you have to understand how it happens.
The core principle of open data infrastructure (ODI) is modularity. Instead of buying an all in one proprietary database that handles storage, compute, and governance behind a walled garden, you buy specialized tools for each layer.
The storage layer lives in Amazon S3 or Google Cloud Storage. The data is written in an open format like Iceberg. The compute layer might be Snowflake for BI workloads and Databricks for machine learning.
The theory is that this gives you infinite flexibility. The reality is that the spaces between those tools are incredibly fragile.
When you decouple everything, the burden of integration falls entirely on your data engineering team. The ingestion tool has to write correctly to the open format. The catalog has to register the schema changes. The observability layer has to be able to read the metadata. Every new tool you add to preserve your "openness" is another potential point of failure, another set of logs to check when a pipeline breaks, and another vendor contract to negotiate.
It's the natural byproduct of a highly modular architecture that lacks a unifying control plane.
The Real Cost of a Fragmented Open Stack
The financial cost of buying four different tools is obvious. The hidden costs are what actually grind a data team to a halt.
The Context Switching Tax
When a pipeline fails in a fragmented stack, debugging is a multi-platform exercise. An engineer has to check the ingestion logs in one tool, trace the transformation history in another, and look at the data quality alerts in a third. The cognitive overhead of moving between four different interfaces just to answer the question "why is this dashboard broken" drains hours of productivity every week.
Reliability Risk at the Seams
Individual point solutions are often reliable enough on their own. The failures almost always happen where they connect. When an ingestion tool hands off raw data to a transformation layer without shared metadata context, schema changes slip through the cracks. Data quietly stops flowing or, worse, flows incorrectly without triggering any alarms.
The Onboarding Nightmare
When you hire a new data engineer into a fragmented stack, they are not just learning your business logic. They are learning four different platforms, four different mental models, and the undocumented history of why the team chose to wire them together the way they did. That is weeks of ramp time that did not need to happen.
A Practical Architecture for Open Data
You can build an open, future-proof data stack without sacrificing your team to maintenance work. The secret is consolidating the operational layers while keeping the storage layer open.
1. Standardize on an Open Table Format Early
The foundation of your architecture has to be an open format. Apache Iceberg, Delta Lake, and Apache Hudi are the standards. Choosing one early ensures that your data is never trapped inside a proprietary compute engine. If a vendor raises their compute prices next year, you can point a different engine at your Iceberg tables without migrating a single byte of data.
2. Centralize Ingestion, Observability, and Cataloging
This is where teams usually make their mistakes. They assume that because storage and compute are decoupled, ingestion and observability must also be decoupled. They do not.
The most effective way to cut down on fragmented tooling is to unify the data movement and data monitoring layers. Instead of buying a standalone ingestion tool to move the data, a separate observability tool to monitor it, and a separate catalog to track it, you use a unified DataOps platform.
When ingestion and observability live in the same platform, you catch schema changes at the source before they hit your open data lake. When the catalog is built into the ingestion layer, lineage is tracked automatically from the source database all the way through to the warehouse. You get the operational simplicity of an all-in-one platform without giving up the open storage foundation.
3. Shift Governance Left
In a sprawling stack, governance is usually applied after the data lands in the lake. A separate tool scans the data, flags PII, and applies access controls.
In a practical architecture, governance happens during ingestion. By defining your semantic rules and access controls in a unified platform before the data is written to your open formats, you ensure that every compute engine downstream is querying clean, governed data. You do not have to recreate your access policies in Snowflake, Databricks, and your BI tool separately.
How Matia Enables Open Data Without the Chaos
Matia was built for teams that want the flexibility of a modern data architecture without the chaos of managing four different vendors.
As a unified DataOps platform, Matia handles ETL, Reverse ETL, Observability, and Data Catalog in a single platform. It is designed to be the operational layer that sits above your open storage foundation.
You can use Matia to extract data from your operational databases and SaaS tools, monitor it for anomalies at the source, and load it reliably into your cloud data warehouse or data lake. Because Matia handles the movement, the monitoring, and the lineage tracking, your engineers don't have to spend their time stitching together fragmented tools.
Customers like Ramp have consolidated their ingestion and observability onto Matia and reported up to a 40% reduction in total data platform costs. More importantly, they get their engineering time back, time that goes toward managing pipelines and building the dashboards and workflows the business actually needs, instead of maintaining plumbing between disconnected tools.
If you want to build an open data infrastructure but you are dreading the tool sprawl that usually comes with it, there is a better way to architect your stack.
Book a demo and we will show you how Matia unifies your data operations while keeping your data fully under your control.
You thought you had the budget figured out. You looked at the row counts in your source databases, estimated a reasonable growth rate, and signed the contract. It all made sense on paper.
Then the invoice arrived six months later and the number was completely disconnected from your estimates.
If you are running Fivetran in 2026, you have probably had a version of this conversation. The problem is rarely that your company suddenly generated twice as much data. The problem is usually that the rules around how that data is counted have changed, and those changes happen in ways that are incredibly difficult to forecast.
Fivetran's Monthly Active Row model is supposed to be simple. You pay for what changes. But after a series of pricing updates across 2025 and 2026, MAR has become one of the most unpredictable metrics in the modern data stack.
Here is how the pricing actually works now and why your bill might be climbing faster than your data volume.
How Fivetran Monthly Active Rows Actually Work
The core concept of MAR is straightforward. Fivetran counts the number of distinct primary keys that are inserted, updated, or deleted in your connected sources during a calendar month. Each row is counted once per month, even if it changes multiple times.
That sounds like a fair deal. You are not paying for data that just sits there.
The complexity comes from the details. MAR is not calculated across your whole account. It is calculated per connection. Initial syncs are free, but resyncs triggered by schema changes can sometimes cause spikes. And the way Fivetran handles high-frequency changes means certain types of data will cost you significantly more to move than others.
If you are trying to understand why your bill looks the way it does, you have to look at the three major changes Fivetran rolled out over the last two years.
The 2025 Shift to Per-Connector Billing
Before March 2025, Fivetran aggregated your MAR across your entire account. This was a massive benefit for teams with a lot of data sources. If you had one massive database and thirty smaller SaaS tools, the volume from the big database pushed you down the pricing curve, making the thirty smaller tools very cheap to run.
Fivetran changed that. Now, each connection sits on its own pricing curve.
If you have forty connectors, you are essentially starting at the most expensive tier of the pricing curve forty different times. You lose the aggregate volume discount. For teams with a sprawling SaaS footprint or multiple staging and production environments syncing the same data, this change alone caused bills to jump significantly.
The 2026 Updates That Inflated Row Counts
In January 2026, Fivetran introduced three new rules that fundamentally changed what counts as billable activity.
Deletes Now Count as Paid MAR
Previously, if a row was deleted in your source system, Fivetran did not charge you for it. Now, deletes are treated exactly like inserts and updates. If you have tables where rows are frequently created and then purged, think event logs, temporary order states, or high-churn CRM records, your billable MAR will be much higher than the actual size of the table.
History Mode Is Billed Per Change
History mode tracks every change to a row over time, keeping a record of what the data looked like at any given moment. It is incredibly useful for auditing and point-in-time reporting.
It is also incredibly expensive now. Fivetran used to count a history mode row once per month, regardless of how many times it updated. Now, every single update to a row within a month counts toward your paid MAR. If you turn on history mode for a table that sees frequent updates, your bill will spike almost immediately.
The New Base Charge
Fivetran also added a $5 monthly base charge for every connection generating between 1 and 1 million MAR. It sounds small, but if you have a hundred low-volume connectors, that is $500 a month in base charges before you even look at the data volume costs.
The Hidden Costs Beyond MAR
When you are budgeting for Fivetran, the ingestion cost is only the first line item. The total cost of ownership usually includes three other things that do not show up on the Fivetran invoice.
The first is transformation. Fivetran extracts and loads. You still have to transform the data, which means you are paying for dbt Cloud or managing the open-source version yourself.
The second is reverse ETL. Fivetran gets data into the warehouse. Getting it back out to Salesforce or HubSpot requires a separate tool like Census or Hightouch, which comes with its own contract and its own pricing model to manage.
The third is observability. When a schema changes upstream and Fivetran pushes that change into the warehouse, downstream models break. Catching those issues requires a standalone observability tool like Monte Carlo, adding another vendor to the stack.
When you add it all up, the true cost of moving data is often double or triple the MAR estimate you started with.
How to Get Your ETL Costs Under Control
If your Fivetran bill is growing faster than your business, you have a few options.
You can spend engineering time optimizing what you sync. You can turn off history mode on tables that do not strictly need it. You can reduce sync frequencies to try and batch updates. You can build custom scripts to filter out deletes before Fivetran sees them.
Or you can look for a platform that does not penalize you for having messy, high-churn data.
The teams that successfully get their costs under control usually do it by moving away from pricing models that charge per connector or penalize frequent updates. They look for platforms that offer predictable billing and consolidate the fragmented pieces of the data stack.
Matia bills on Monthly Active Rows, but without the traps. There are no per-connector penalties. There are no delete charges. There are no history mode surprises. You get predictable pricing that scales with your actual data footprint, not the frequency of your updates.
Ramp reduced its data platform costs by approximately 40% after moving to Matia. Lopay stood up more than 100 integrations in just 3 days during its migration. Obligo saw an 83% increase in team productivity after consolidating onto Matia. Recharge cut its Snowflake costs by 32% after switching to Matia's platform.
Book a demo and we will walk through your current Fivetran setup, your MAR spend, and what a migration realistically looks like for your team.
Most "Fivetran alternatives" articles give you a list of tools with connector counts, pricing tiers, and a comparison table. You've probably read a few of them. They're not useless, but they tend to miss the things that actually matter when you're running data pipelines in production.
Connector count is a marketing metric. What you actually care about is whether the tool handles your specific sources reliably, how it prices at your data volume, how fast it moves data when you need it to, and what happens when something breaks at 2am. Those are the things that determine whether a migration was worth it.
This is a guide to evaluating Fivetran alternatives the way data engineers actually do it.
Why Teams Start Looking for Fivetran Alternatives
The most common reasons we hear from teams who've gone through this evaluation:
Pricing that doesn't scale predictably
Fivetran's row-based pricing model works fine at low volumes. As data volumes grow, the bill can scale faster than expected, particularly for high-frequency sources or tables with lots of updates. Teams that didn't model this out carefully when they started often find themselves in renewal conversations they weren't prepared for.
Sync speeds that don't meet business requirements
Default sync frequencies on lower tiers can be too slow for operational use cases. If your analytics team needs near-real-time data for dashboards, fraud detection, or customer-facing features, hourly or multi-hour sync windows create real business problems.
Support that doesn't match the urgency of production incidents
When a pipeline breaks and data stops flowing, response time matters. A support ticket that takes hours to get a first response is a different experience than a dedicated Slack channel where someone responds in minutes. Teams that have been through a production incident with slow vendor support tend to weight this heavily in future evaluations.
Stack consolidation
A lot of teams are running Fivetran alongside separate observability, reverse ETL, and catalog tools. The combined cost and operational overhead of managing four vendors, four contracts, and four support relationships adds up. Consolidating onto a platform that handles multiple functions is a legitimate reason to evaluate alternatives, independent of any issues with Fivetran specifically.
The Evaluation Framework That Actually Matters
Pricing mechanics, not just price
The headline price of any ETL tool is less important than how it scales with your usage. Before you evaluate any alternative, model out what your bill looks like at 2x your current data volume and at 5x. The pricing model matters as much as the current number.
Row-based pricing, connector-based pricing, and compute-based pricing all behave differently as you scale. Row-based models can get expensive fast for high-update-frequency tables. Connector-based models penalize breadth. Compute-based models require you to understand your warehouse utilization patterns to forecast accurately.
Ask every vendor for a cost estimate based on your actual row counts and sync frequencies, not their standard tiers. If they can't give you a clear answer, that's information.
CDC latency and reliability
Change Data Capture is where a lot of the real differentiation lives. CDC captures row-level changes from source databases in real time rather than running batch extracts, and the quality of CDC implementation varies significantly across tools.
The questions to ask: What's the actual end-to-end latency from source change to warehouse landing? How does the tool handle schema changes in the source? What happens during a source outage, does it resume cleanly or require manual intervention? How does it handle high-volume tables with frequent updates?
For teams running Postgres or MongoDB replication specifically, latency and throughput differences between tools can be significant. This is worth testing with your actual data, not just reading about in documentation.
Observability and pipeline visibility
A pipeline that runs is not the same as a pipeline you can trust. The difference is visibility. Can you see when a sync last ran successfully? Can you detect schema changes before they break downstream models? Do you get alerts when data volume drops unexpectedly or when a source goes stale?
Some ETL tools treat observability as an afterthought. Others build it in. If you're evaluating alternatives, look at what monitoring and alerting capabilities come with the tool versus what you'd need to build or buy separately. The total cost of running a pipeline includes the cost of debugging it when it breaks.
Support model and response time
This is the one that's hardest to evaluate from a product page but easiest to evaluate from a trial. Ask specifically: What's the expected first response time? Is there a dedicated Slack channel? What's the escalation path for production incidents?
The gap between "we have a support team" and "we respond in five minutes via your own Slack channel" is significant in practice. Teams that have been through production incidents with slow vendor support consistently rate this higher in retrospect than they did going in.
Migration complexity
If you're already running Fivetran pipelines, the real cost of switching isn't just the new tool's price. It's the engineering time to migrate connectors, validate data parity, and cut over without breaking downstream dependencies.
Some alternatives require a full rebuild. Others are backwards compatible with existing Fivetran configurations, which means pipelines, connectors, and configs can migrate without starting from scratch. The difference between a migration that takes days versus months is a real factor in the total cost of switching.
What to Actually Test in a Trial
Most vendors offer a trial period. Here's what to actually evaluate during it rather than just connecting a few sources and calling it done.
Test your highest-volume, most complex sources first
Don't start with the easy connectors. Start with the sources that have caused you the most pain: high-update-frequency tables, sources with frequent schema changes, large historical syncs. If a tool handles those well, the simpler ones will be fine.
Measure actual latency, not advertised latency
Run a CDC sync on a source you control and measure the actual end-to-end time from a row change to warehouse landing. Do this under normal conditions and under load. Advertised sync frequencies are often best-case numbers.
Trigger something to break
Deliberately cause a schema change, drop a column, or simulate a source outage. See how the tool responds. Does it alert you? Does it fail gracefully? Does it resume automatically? How you find out about problems is as important as whether the tool has problems.
Contact support with a real question
Don't wait for something to go wrong. Send a support message during the trial and see how long it takes to get a useful response. This tells you more about the actual support experience than any SLA document.
The Consolidation Question
One thing worth thinking through before you finalize an evaluation: are you replacing Fivetran specifically, or are you replacing your broader data stack?
A lot of teams running Fivetran are also running separate tools for observability, reverse ETL, and data catalog. Evaluating each of those independently means four separate evaluations, four separate migrations, and four separate vendor relationships going forward.
If consolidation is on the table, the evaluation criteria shift. You're not just asking whether the ETL layer is better. You're asking whether a unified platform that handles ETL, observability, reverse ETL, and catalog on one invoice is operationally simpler and cheaper than the sum of the individual tools. For many teams, especially those dealing with stack sprawl and unpredictable costs, the answer is yes.
How Matia Fits In
Matia is built for teams that are tired of managing a fragmented data stack. ETL with native Change Data Capture, parallel syncs up to 28x faster on MongoDB and Postgres, column-level blocking and hashing for PII handling, and sync times as low as 5 minutes on Enterprise. Observability, reverse ETL, and catalog on the same platform, same login, same invoice.
Matia's Catalog was never built around one BI tool. It was built around however your team actually does BI, whether that's Metabase dashboards, Tableau, or Omni's semantic layer, and it's already tracking lineage across all three. Hex is the newest addition to that pattern, and a place where SQL and Python sit side by side, and where the real analysis happens before anything gets polished into a dashboard.
That's exactly why it matters. The more real work a team does in Hex, the harder it gets for anyone outside the person who built the notebook to know how it works, or to prove it when someone asks.
Every team has that one Hex notebook that's basically tribal knowledge with better formatting.
Matia's Catalog now covers that too, so a number built in a Hex notebook gets the same on-demand answer to "where did this come from" as one built in any other BI tool.
The Challenge: Full visibility is missing
Most data teams can already answer "where did this table come from." Seeing what would break if you change a column, on demand, without waiting for the one person who remembers how a notebook was built, is harder.
That gap shows up in a few familiar ways:
Catalogs stop at clean SQL. Most catalog tools either don't fully support Hex yet, or lose the thread the moment a notebook mixes in Python or a dataframe, even though that's often where the real analysis happens.
Troubleshooting is slow and manual. Nobody wants a 3 AM Slack ping asking why yesterday's revenue number looks off, especially when the answer is buried in someone else's notebook. When a number looks wrong, someone has to work backward by hand: which cell feeds this chart, which column, which upstream source. That falls on whoever happens to be around, not necessarily the person who built the notebook.
The problem compounds with scale. What's manageable at ten Hex notebooks gets a lot harder to track at a thousand, and leaders need a provable answer to "where did this come from," not a hope that the right person is around to explain it.
How Matia + Hex work together
Matia's Catalog automatically picks up what a Hex notebook produces: SQL query results and the columns behind them, and the visualizations built on top of that SQL. Lineage runs from the warehouse, through the dbt models Matia already tracks, through Hex's SQL cells, down to the column level, for both the query and the resulting chart and lineage for visualizations.
Python cells work a little differently. When a dataframe produced by Python code is referenced in a later cell, Matia identifies that reference and adds it to the catalog so the connection isn't lost.
That gives teams a real, provable answer instead of a guess:
Upstream from a chart. For SQL-based visualizations, go from what's on screen back to the exact column it depends on
Downstream from a source. From any warehouse table, see every Hex notebook that would be affected by a schema change or a data quality issue, whether that notebook is pure SQL or has Python in the mix.
And it plugs into the rest of Matia automatically:
Impact analysis, extended. When Matia's observability flags an anomaly upstream, freshness gaps, schema drift, volume anomalies, the same lineage graph shows which Hex notebooks sit downstream, so teams know what's affected before a stakeholder asks.
One catalog, lower switching costs. Matia's catalog was never built around one BI tool, so it already covers Metabase, Tableau, and Omni, with Power BI on the way. That means moving to Hex, or running it alongside whatever you're migrating away from, doesn't mean starting your governance over. Tags, descriptions, and certification status already sync in from Snowflake and dbt, and now apply to Hex assets too, so nothing gets lost in the switch.
No new maintenance burden. New tables, columns, and Python-touched assets get caught and linked automatically as Hex usage grows, no manual tagging required.
How data & business teams are using the Matia <> Hex integration
Nobody signed up to be a data detective, tracing Python cells backward through a graph at 5pm on a Friday.
Data engineers get a faster way to answer "what breaks if I change this" before shipping a schema change, instead of digging through notebooks or asking around.
Analytics engineers get to move at notebook speed without it costing them trust: no more manually retracing SQL and Python logic across three different tools to explain a number.
Head of Data get a provable answer to "where did this come from," on demand, at any scale, whether a team is running ten Hex notebooks or a thousand, without needing a separate catalog tool for whichever BI tool is in use.
Business stakeholders can take a Hex dashboard at face value instead of wondering what's behind it, because the lineage backing it up already exists and can be proven, not just claimed.
Same lineage, doing two different jobs: speed for the people building in Hex, confidence for the people relying on what they built.
Prove trust: benefits of Matia and Hex integration
Teams that already lean on Matia's lineage and observability to catch issues before the data reaches a dashboard. Asking the person who built it isn't a data strategy. Extending that same coverage into Hex means:
Faster root-cause analysis when a number in a notebook looks wrong, because the lineage trail already exists instead of needing to be reconstructed by hand.
Less duplicated catalog work, since Hex assets are tracked automatically instead of needing a separate tool or manual documentation to stay current.
Fewer surprises from schema changes, because teams can see notebook-level impact before they ship the change, not after someone reports a broken chart.
For teams also running Matia's ETL, the trace goes further still: lineage runs all the way back to the original source system, verified at every hop it moved through, not stitched together after the fact from whatever metadata the warehouse happens to still have.
Fast and explainable don't have to be a trade-off
Notebooks let analysts move fast. That speed is the point of Hex, but it's also exactly what makes some teams hesitant to fully trust notebook-style work the way they'd trust a traditional dashboard.
Matia's job here isn't to slow that down, it's to make sure fast and explainable don't have to be a trade-off.
And Hex isn't an isolated addition, it's the newest proof point in a pattern already underway: Matia's Catalog already spans Metabase, Tableau, and Omni, with Power BI on the way.
For Data, AI, and Engineering teams building in Hex, Matia is the Unified DataOps Platform that automatically catalogs and traces lineage across every Hex notebook, so any number can be explained back to its source, at any scale. Book a demo to see lineage into Hex in action.
The modern data stack got very good at pulling data in. Fivetran, dbt, Snowflake: ingestion and transformation are largely a solved problem for most teams. But there is a second half to this equation that most data stacks still handle badly.
Your warehouse has the best version of your customer data. Lead scores built from product usage signals. Health scores combining billing history, support tickets, and feature adoption. Churn predictions from your ML models. None of it does anything useful sitting behind a SQL interface. Sales reps live in Salesforce. Marketing teams live in HubSpot. They are making decisions every day based on whatever stale data happens to be in their CRM.
Reverse ETL is how you close that gap. And if you are still doing it with CSV exports or a cron job hitting the Salesforce API, you already know how that ends.
Here is why custom syncs break and what a production-grade setup looks like.
Where Custom CRM Syncs Fall Apart
1. Salesforce and HubSpot Rate Limits Will Find You
Salesforce Standard edition gives you 15,000 API calls per 24-hour period. HubSpot's batch API processes 100 records per call. These limits are not theoretical. They are the first thing that breaks when you try to sync a large contact table on a schedule.
A custom script without proper queuing and backoff logic will burn through your Salesforce quota before noon on a busy day. When it does, the sync stops, no one gets notified, and your sales team spends the afternoon working with data that stopped updating hours ago. Figuring out which batch failed, where to resume, and what got dropped is exactly the kind of debugging that should not be on a data engineer's plate.
2. Change Detection Is an Engineering Problem on Its Own
You cannot push your full warehouse model to HubSpot on every run. You have to identify what changed since the last sync and send only those records. That means storing sync state somewhere reliable, managing it across failures, and handling edge cases like soft deletes and schema updates.
When that state management breaks, you get one of two outcomes. Records stop updating silently, and nobody notices for days. Or you send redundant updates on every run, burn through your API quota, and still end up with stale data because the retry logic is wrong.
3. Type Mismatches and Validation Failures Are Silent Killers
Snowflake stores timestamps as TIMESTAMP_NTZ. Salesforce expects ISO 8601. HubSpot wants epoch milliseconds. Every destination has its own type system, and your warehouse does not speak any of them natively.
Add to that the fact that Salesforce admins regularly add new required fields and picklist values without telling the data team. When that happens, your sync starts rejecting records immediately. A custom script typically logs the error and moves on. Those records are silently dropped. You find out a week later when a sales rep notices their account data is incomplete.
4. A Failed Sync Without Idempotency Becomes a Data Quality Incident
If a sync fails halfway through, you need to resume cleanly without creating duplicate records in Salesforce. That requires upsert logic keyed on external IDs, not blind inserts. It requires knowing exactly which records were committed before the failure.
Scripts that skip this step turn a network timeout into a deduplication project. Cleaning up duplicate records in Salesforce is manual, time-consuming work that should never have been necessary in the first place.
What a Reliable Reverse ETL Setup Looks Like
Automated change detection. A sync engine that manages its own state diffs your warehouse model against the last run automatically. Only changed records go to the destination. API usage stays efficient, and syncs stay fast regardless of how large the underlying table gets.
Native rate limit handling. The platform understands the Salesforce Bulk API and the HubSpot batch endpoint. Queuing, pacing, and retries are managed for you. You never have to think about whether a large sync will exhaust your quota mid-run.
Visual field mapping with type coercion. Mapping warehouse columns to CRM custom properties through a UI, with automatic type conversion, removes the hardcoded mappings that break every time a field changes in the destination.
Granular error handling. When a record fails a validation rule, the sync continues and logs the failure with enough context to fix it. Failed records are retryable individually, without rerunning the whole job.
Why Data Teams Are Using Matia for Reverse ETL
Matia was built by data engineers who know that getting data out of the warehouse and into the tools where the business actually operates is not optional. It is a unified DataOps platform that combines ETL, Reverse ETL, Observability, and Data Catalog in one place.
For syncing warehouse data to Salesforce and HubSpot specifically, Matia delivers:
Pre-built connectors that handle API pagination, rate limits, and idempotency natively
A visual field mapper that makes it fast to push lead scores, health scores, and product usage signals to custom CRM fields
Source-level observability that catches schema changes before they break your downstream syncs
A Live Debugger that surfaces exactly why a specific record failed, so you can fix it in minutes rather than digging through logs
Lev is a good example of this in practice — they use Matia to sync data from Databricks into their operational systems 5x faster, powering real-time, AI-driven recommendations for their commercial real estate platform. See how they did it.
Because Matia unifies ingestion and Reverse ETL on the same platform, you are not paying for a separate activation tool on top of your ETL stack. Recharge made the same move and cut their Snowflake costs 32% in the process. The same platform that gets data into the warehouse gets it back out to the teams who need it. Take a look at pricing to see what unifying your stack could look like.
Your Warehouse Data Should Be Working Harder
Keeping your best customer data locked behind SQL while your sales and marketing teams operate on stale CRM records is a waste of the infrastructure you have already built. Reverse ETLis not a complex problem. It becomes one when you try to solve it with custom scripts.
A purpose-built platform handles the hard parts. Your team focuses on the models and the business logic, not the plumbing.
Book a demo today to see how fast you can get your warehouse data working in Salesforce and HubSpot.
If you are running a modern data stack, chances are high that Fivetran is your primary ETL tool. For a long time, it was the default choice. You connected your sources, paid the bill, and got back to building.
That is no longer the case for a lot of teams.
Data engineers are increasingly hitting a wall with Fivetran. Pricing changes in 2025 and 2026 have made bills unpredictable. Pipelines that used to be reliable are becoming a source of constant firefighting. Teams are spending hours debugging broken connectors and explaining unexpected bill spikes to their CFOs instead of shipping.
If your Fivetran setup is costing too much or slowing you down, here is exactly what is going wrong and what a better migration path looks like.
Why Data Teams Are Leaving Fivetran
Fivetran is a large platform with hundreds of connectors, but its architecture was built for a different era. When you try to push it to support modern data needs at scale, the cracks start to show quickly.
1. Unpredictable Costs From Connector-Level Billing
Fivetran prices based on Monthly Active Rows (MAR). In 2025, Fivetran moved to per-connector billing, which eliminated account-wide volume discounts. Since January 2026, a minimum charge applies to every connector generating between 1 and 1 million MAR per month.
For teams running multiple connectors, this causes bills to spike in ways that are very difficult to predict or control. A single high-churn table can quietly generate millions of additional MAR per month, and you often do not find out until the invoice arrives. Teams with multiple low-volume connectors have reported cost increases of 40 to 70 percent or more after the pricing changes. Curious what this actually costs across different pricing models? Our guide to ETL pricing breaks it down.
2. The Black Box Problem
Fivetran abstracts away a lot of complexity, which is useful when you are getting started. But as your data needs mature, that abstraction becomes a ceiling. When something breaks, visibility is limited. You know a sync failed, but understanding exactly why, and fixing it fast, is harder than it should be.
Schema changes, CDC edge cases, and replication failures all require more control than Fivetran's managed model allows. Teams that need to customize ingestion logic, handle late-arriving data, or manage complex CDC patterns quickly run into walls. (If you're weighing CDC against traditional batch ETL, our guide to Change Data Capture covers when each approach makes sense.)
3. Slow Sync Speeds Without a Costly Upgrade
Fivetran's Standard tier caps you at 15-minute syncs. Getting down to 5-minute syncs requires upgrading to their Enterprise tier, which comes with a significant price jump. For teams that need near real-time operational analytics, a 15-minute batch delay simply does not cut it. And paying Enterprise rates just to get closer to real time, while still dealing with cost unpredictability, is a hard case to make internally.
4. The Tool Sprawl Tax
Fivetran handles ETL, but it is just one piece of the puzzle. You still need separate tools for Reverse ETL, Data Observability, and Data Cataloging. Managing four platforms with four invoices and four support queues leads to what data teams call data triage: spending all your time debugging across tools instead of building. Every new tool added to the stack is another contract negotiation, another onboarding, and another thing to break.
What a Better Setup Actually Looks Like
The problems above are not inevitable. They are the result of a specific architectural approach, and a different approach solves them.
Real-time CDC over batch. A platform that streams changes continuously, rather than pulling in batch intervals, eliminates the cost and latency problems at the root. MAR is consumed as it is written, so there is nothing to accumulate and no billing surprises.
Parallel syncs. High-volume tables do not have to be a bottleneck. Parallel sync architecture processes multiple streams simultaneously, dramatically cutting sync times without adding pressure to your source database.
Predictable pricing. Monthly Active Row billing should not be a surprise. A pricing model that does not penalize you for having multiple connectors or running transformations gives you the budget certainty that Fivetran's current model does not.
Built-in observability. Schema changes should not silently break downstream pipelines. Monitoring at the source, with alerts before bad data reaches the warehouse, is the difference between catching a problem in seconds and discovering it in a stakeholder meeting.
Fast support. Five-minute support response times are not a marketing claim. They are the difference between a minor incident and a major outage.
What the Migration Actually Looks Like With Matia
Matia was built by data engineers who were tired of exactly these problems. It is a unified DataOps platform that combines ETL, Reverse ETL, Observability, and Data Catalog in one place, built for speed and reliability from the ground up.
For Fivetran migrations specifically, Matia delivers:
Parallel syncs that reduce replication time by up to 28x compared to batch-based tools
Source-level observability that catches schema changes and anomalies before they hit the warehouse, with instant Slack alerts
Pricing built on Monthly Active Rows, without the per-connector penalties or transformation charges that inflate Fivetran bills. Customers report up to a 61% reduction in total data stack spend.
A dedicated Slack channel on every plan with 5-minute support response times
And if you are currently on Fivetran, the migration is not a months-long rebuild. Matia is fully backwards compatible with Fivetran. Pipelines and configs migrate in days, not months.
Ramp cut its sync time by more than 80% after making the switch. Recharge resolved chronic replication failures and unified a fragmented stack in the process. These are not edge cases. They are what happens when you stop forcing your data through a tool that was not designed for what you need today.
Stop Waiting on Your Next Fivetran Invoice
Migrating off Fivetran is not a moonshot project. Most teams put it off because they assume it means months of rebuilding pipelines from scratch. It does not.
With a platform that is fully backwards compatible with Fivetran, you can move your connectors, preserve your configs, and be running faster syncs at a lower cost before your next billing cycle. The longer you wait, the more you pay for a tool that was not built for where your data stack is going.
A machine learning model only knows what you feed it. It does not know if a column was renamed, if a source API started returning nulls, or if a connector quietly stopped syncing three fields last Tuesday. It just learns whatever pattern exists in the data you give it. When that data is broken, the model learns the wrong thing, and it does so confidently.
1. The Garbage In, Garbage Out Reality
Incomplete, inconsistent, or stale training data does not cause a model to fail loudly. It causes a model to perform just well enough in testing that nobody catches the problem until it is in production.
A single high-churn table syncing duplicate records can skew a pricing model. A truncated timestamp can corrupt a time-series forecast. The model is not broken. It learned exactly what it was trained on. That is the problem.
2. The Context Disconnect
When a data scientist pulls a dataset from the warehouse to train a model, they are trusting that the data accurately reflects reality. But if they are not connected to the engineers managing the ingestion layer, they have no way of knowing what actually happened upstream.
A spike in null values could mean user behavior changed. Or it could mean an API endpoint broke two weeks ago. Without pipeline context baked into the data, the data scientist has to guess. And they usually compensate by building workarounds into the model itself, which makes the whole thing harder to maintain and debug later.
3. Settling for "Good Enough" Data
Rigid pipelines create a quiet but serious problem: teams train models on whatever data is easy to get, not the data that would actually make the model better.
A data scientist wants access to a new behavioral event stream. The answer is that the integration will take months. So they work with what they have, answer a lower-value question, and move on. Over time, your AI roadmap gets shaped by your pipeline limitations rather than your business needs. Your ingestion capabilities become the ceiling on what AI can do.
4. The Silent Cost of Manual Cleaning
Data preparation is the most time-consuming part of machine learning, and most of that time is not spent on anything strategic. It is spent compensating for broken pipelines. Writing deduplication scripts. Standardizing naming conventions. Handling schema drift that should have been caught at the source.
Every hour a data engineer or ML engineer spends on that is an hour not spent improving the model. You are paying senior engineering salaries to do the work of a modern data integration tool.
What an AI-Ready Data Pipeline Actually Looks Like
None of this is inevitable. The problem is treating data ingestion and AI training as two separate concerns. When they share the same platform, most of these issues go away.
High-speed, parallel ingestion. A model is only as current as its training data. Parallel sync architecture cuts sync times dramatically, so your models are learning from fresh data rather than last week's batch export.
Source-level observability. Schema changes should not silently poison your training sets. Catching issues at the source, before bad data reaches the warehouse, means you pause a training run instead of deploying a broken model.
Semantic context preservation. Data loses meaning when it moves through too many disconnected tools. A pipeline that carries metadata, tests, and transformation context alongside the data gives ML engineers the full picture they need to build reliable features.
Effortless scalability. Adding a new data source should not require a two-month engineering project. Pre-built connectors let teams experiment with new features fast, instead of waiting on integrations that may never come.
Why Data Teams Are Building AI Foundations With Matia
Matia was built by data engineers who know firsthand that you cannot build reliable AI on a fragmented stack. It is a unified DataOps platform that combines ETL, Reverse ETL, Observability, and Data Catalog in one place, giving ML teams the clean, connected, and contextualized data foundation they actually need.
For AI and machine learning workflows specifically, Matia delivers:
Parallel syncs that move training datasets up to 28x faster than legacy batch tools
Source-level observability that catches schema drift and anomalies before they corrupt your feature store
A metadata context layer so data engineers and ML engineers share the same picture of where data came from and how it was transformed
Fully backwards compatible migrations, so you can upgrade your pipeline without touching your existing models
Lev made their AI workflows fully operational by using Matia to handle Databricks model outputs. Five times faster syncs. Pipeline bottlenecks gone. That is what happens when your data infrastructure is actually built for AI, not just bolted together to support it.
Stop Blaming the Algorithm
Tuning hyperparameters while your pipelines feed your model garbage is a losing battle. You should not have to spend your week writing deduplication scripts or explaining to leadership why the new model is generating nonsense.
If you are running a modern data stack, chances are high that PostgreSQL is your primary transactional database and Fivetran is moving that data into your warehouse. For a long time, that combination was the default choice. You connected the two, paid the bill, and got back to building.
That is no longer the case for a lot of teams.
Data engineers are increasingly hitting a wall when scaling Fivetran with Postgres. Stuck replication slots , write-ahead log (WAL) bloat, and Fivetran's 2025 and 2026 pricing updates have turned a once-reliable setup into a source of constant firefighting. Teams are spending hours debugging broken pipelines and explaining unexpected bill spikes to their CFOs instead of shipping.
If your Postgres replication is failing or costing too much, here is exactly what is going wrong and what a better setup looks like.
Why Fivetran Struggles with Postgres
Fivetran is a large platform with hundreds of connectors, but its architecture is fundamentally batch-based. When you try to push high-volume Postgres Change Data Capture (CDC) through a batch-based ELT tool, the cracks start to show quickly.
1. Stuck Replication Slots and WAL Bloat
Fivetran uses Postgres logical replication slots to read the WAL . Because it pulls data in batches, typically every 15 minutes on Standard plans, rather than streaming continuously, the replication slot must hold onto the WAL until Fivetran successfully fetches it.
If Fivetran hits a delay, a timeout, or a processing error, that slot gets stuck. The WAL cannot be truncated, so it bloats rapidly . On high-transaction databases, this can fill up your disk space and bring down your production database entirely. Recovering from a stuck slot is not a quick fix either. It often means pausing the connector, dropping the slot, waiting for a checkpoint, and triggering a full historical resync .
2. Unpredictable Costs from History Mode and Deletes
Fivetran prices based on Monthly Active Rows (MAR). In 2025, Fivetran moved to per-connector billing, which eliminated account-wide volume discounts. Since January 2026, deletes count as billable MAR, and if you use history mode to track row changes, every update to a row counts toward your paid MAR.
For high-velocity Postgres tables, this causes bills to spike in ways that are very difficult to predict or control. A single high-churn table can quietly generate millions of additional MAR per month, and you often do not find out until the invoice arrives.
3. Slow Sync Speeds Without an Expensive Upgrade
Fivetran's Standard tier caps you at 15-minute syncs. Getting down to 1-minute syncs requires upgrading to their Enterprise tier, which comes with a significant price jump. For teams that need near real-time operational analytics, a 15-minute batch delay simply does not cut it. And paying Enterprise rates just to get closer to real time, while still dealing with the WAL and cost issues above, is a hard case to make internally.
4. The Support Gap
When things go wrong with Postgres replication, you need answers fast. Fivetran's support response times are a consistent complaint from data engineering teams. Debugging a stuck replication slot at 2am while your production pipeline is down is not the time to be waiting on a ticket queue.
What Better Postgres Support Actually Looks Like
The problems above are not inevitable. They are the result of a specific architectural approach, and a different approach solves them.
Real-time CDC over batch. A platform that reads the Postgres WAL continuously, rather than in batch intervals, eliminates the replication slot bloat problem at the root. The WAL is consumed as it is written, so there is nothing to accumulate and no slot to get stuck.
Parallel syncs. High-volume Postgres tables do not have to be a bottleneck. Parallel sync architecture processes multiple streams simultaneously, dramatically cutting sync times without adding pressure to your source database.
Predictable pricing. Monthly Active Row billing should not be a surprise. A pricing model that does not penalise you for deletes, history mode, or having multiple connectors gives you the budget certainty that Fivetran's current model does not.
Built-in observability. Schema changes in Postgres should not silently break downstream pipelines. Monitoring at the source, with alerts before bad data reaches the warehouse, is the difference between catching a problem in seconds and discovering it in a stakeholder meeting.
Fast support. Five-minute support response times are not a marketing claim. They are the difference between a minor incident and a major outage.
Why Data Teams Are Switching to Matia
Matia was built by data engineers who were tired of exactly these problems. It is a unified DataOps platform that combines ETL, Reverse ETL, Observability, and Data Catalog in one place, with Postgres support that is built for speed and reliability from the ground up.
For Postgres specifically, Matia delivers:
Parallel syncs that reduce replication time by up to 28x compared to batch-based tools
Real-time CDC that eliminates WAL bloat and replication slot failures
Source-level observability that catches schema changes and anomalies before they hit the warehouse, with instant Slack alerts
Pricing built on Monthly Active Rows, without the per-connector penalties, delete charges, or history mode surprises that inflate Fivetran bills. Customers report up to a 61% reduction in total data stack spend.
A dedicated Slack channel on every plan with 5-minute support response times
Curious what this looks like on your own Postgres setup?Book a demo and we'll walk through your replication slots, sync times, and current MAR spend together.
And if you are currently on Fivetran, the migration is not a months-long rebuild. Matia is fully backwards compatible with Fivetran. Pipelines and configs migrate in days, not months.
Ramp reduced their sync time by more than 80% after switching. Lopay cut their data costs by 40%. Obligo reduced warehouse costs by 83%. These are not edge cases. They are what happens when you stop forcing Postgres through a tool that was not designed for it.
The Bottom Line
Debugging Postgres replication issues is exhausting. You should not have to spend your week babysitting replication slots or explaining to finance why your data bill doubled.
If Fivetran is slowing you down, costing too much, or simply not keeping up with your Postgres workload, there is a better option. Matia gives you faster syncs, lower costs, and the kind of support that actually shows up when something breaks.
Book a demo today to see how fast you can migrate your Postgres pipelines.
Matia's API covers more than creating integrations. It also exposes the controls to help you manage and maintain oversight of your unified data platform: running syncs from an orchestrator, deciding which data is replicated, attaching ownership and governance metadata, and exporting account activity for operational or compliance workflows.
We’ll talk through several use cases in this post, but it doesn’t cover every endpoint. The API reference covers all of the available endpoints. (Note: The examples below assume you're already comfortable with REST APIs, authentication headers, environment variables, and JSON payloads.)
Getting your API key
Every request to https://api.matia.io/v1 requires an API key in the x-api-key header.
To create one, log into your Matia tenant, go to Settings → Admin → API Tokens, then generate a new token. Give it a meaningful name and set the expiration date. When selecting a role, be sure to make sure that role has access to the operation you want to perform via the API. For instance, if you want to create an integration, ensure you add the “Integrations Editor” role. (Find the full list of roles and permissions in our docs.) Copy it when it is created and store it in your team's secret manager rather than committing it to a repository or embedding it in a script.
For local testing, export the token as an environment variable:
All of the examples below use the same environment variable.
Run an existing integration
A common reason to call Matia's API is to run an integration as one step in a larger data workflow. For example, you may want a sync to start only after an upstream job has finished, or you may want downstream transformations to wait until fresh source data has landed.
Set the ID of an existing integration, then trigger a run:
The response includes an identifier for the new run. Use that identifier to retrieve its status:
export MATIA_RUN_ID="<run ID returned by the trigger request>"curl --fail-with-body --silent --show-error \
"https://api.matia.io/v1/integrations/$MATIA_INTEGRATION_ID/runs/$MATIA_RUN_ID" \
-H "x-api-key: $MATIA_API_KEY"
This maps cleanly to an orchestrator such as Airflow or Prefect. A task can:
Call the run endpoint after its upstream dependencies succeed.
Save the returned run ID.
Poll the run-status endpoint until the run reaches a terminal state.
Fail the task on an unsuccessful run so the orchestrator can retry, alert, or stop downstream work.
Your Airflow or Prefect DAG can execute API request. Keep the API token in the orchestrator's secret store, keep the integration ID in deployment configuration, and let a non-successful HTTP response fail the task instead of silently continuing.
This pattern is useful for scheduled syncs, dependency-aware pipelines, controlled backfills, and workflows that don’t begin transformation work until Matia has finished loading the required data.
Control what gets replicated
Production integrations rarely need every table and column from a source. You may want to exclude an internal table, omit unused fields, or hash a sensitive column before it reaches the destination.
The schema configuration endpoints provide control at the schema, table, and column levels. Start by retrieving the current configuration for an integration:
Because this configuration is available through the API, it can be managed as policy rather than as a one-time setup step. A scheduled job could inspect newly discovered columns, compare them with a PII policy, and update the integration when a sensitive field appears. (You can also utilize Matia’s MCP server for this! Request access to the private preview today!)
Excluding unneeded tables and columns can also reduce the amount of data extracted, transferred, and stored at the destination, saving time and cost.
Attach operational metadata with tags
As the number of integrations and assets grows, ownership and sensitivity become difficult to infer from names alone. Tags let you attach metadata to resources such as integrations, data assets, and monitors, then use that metadata in later queries and automation.
Tags are most useful when they follow a consistent convention. Common categories include data sensitivity, owning team, environment, and operational criticality.
One practical pattern is to combine tags with schema policy. When an automated process identifies and hashes a PII column, it can also assign a pii tag and a data-owner:<team> tag. Ownership and sensitivity then become queryable through the API instead of being maintained in a separate spreadsheet or wiki page.
Export account activity with audit logs
The audit log endpoint returns a paginated, filterable feed of account activity, including changes to integrations and tags.
The following request returns events starting on July 1, ordered from oldest to newest:
Use limit and offset for pagination, sortBy and sortOrder for ordering, and startAt and endAt to restrict the time range.
A common workflow is to query this endpoint on a schedule and forward new events to a SIEM, observability platform, or object store. Store the timestamp of the last event you processed, use it as the next request's startAt value, and deduplicate records by event ID at the destination.
The actor fields distinguish user and system activity, while the context fields provide details such as IP address and user agent when available. That makes the endpoint useful both for routine troubleshooting and for compliance evidence collection.
Other API capabilities
The endpoints above are useful in day-to-day platform work, but they are only a small part of the API. Other capabilities include:
Assets (POST /assets, PATCH /assets/{id}): Register and update metadata for source and destination assets.
Integrations (GET /integrations, POST /integrations, and GET, PATCH, or DELETE /integrations/{id}): Create and manage integrations.
Table columns (GET /integrations/{id}/schemas/{schema}/tables/{table}/columns): Inspect column-level configuration for a single table without retrieving the full schema tree.
Users (GET /users): List users and resolve identifiers used by fields such as owner and taggedBy.
The API reference contains the complete request and response details for these endpoints.
Where the API fits
Matia's API is most useful when it participates in systems your team already operates:
Trigger a sync from Airflow, Prefect, or another orchestrator, then gate downstream work on the run result.
Apply schema-selection and masking rules from a policy service.
Add ownership and sensitivity metadata from an internal service catalog.
Export audit events into an existing security or compliance pipeline.
The result is a set of repeatable workflows that can be reviewed, tested, scheduled, and monitored alongside the rest of your data platform.
ETL pricing used to be one of the easier parts of choosing a platform. Teams compared connectors, setup time, and reliability, then moved on. That has changed. As data volumes and use cases expand, the price on the contract rarely tells the full story. A platform that looked affordable at launch can become difficult to budget for once row counts rise, new connectors are added, or infrastructure usage increases. So the question is no longer just whether an ETL tool works. It is whether the cost will remain manageable as the business grows. This guide looks at the main ETL pricing models, the expenses that often sit outside the quoted price, and the questions data teams should ask before committing to a platform.
Why ETL costs are getting more attention
Data volumes continue to grow.
Companies are collecting more customer data, more product telemetry, more SaaS application data, and more operational data than ever before.
The challenge is that many ETL pricing models scale directly alongside data growth.
This means organizations can find themselves in a situation where:
Data usage increases
Business adoption increases
Pipeline complexity increases
ETL costs increase
For many teams, that makes predictable infrastructure spending harder to achieve, even when the underlying growth is good news.
How the most common ETL pricing models work
1. Pricing by monthly active rows (MAR)
MAR based pricing charges customers based on the number of rows processed each month.
This model is popular among several modern ETL vendors because it aligns pricing with platform usage.
Benefits:
Easy to get started
Scales with usage
Low barrier to entry
Potential challenges:
Costs can be difficult to forecast
Bills may increase unexpectedly as data volumes grow
Teams may limit data collection to control spend
Questions to ask:
How are active rows calculated?
Are deletes included?
How often are rows counted?
What happens when usage spikes?
2. Connector based pricing
Some ETL vendors charge based on the number of connectors being used.
For example:
Salesforce connector
HubSpot connector
NetSuite connector
PostgreSQL connector
Benefits:
Predictable pricing
Easy budgeting
Potential challenges:
Costs increase as new systems are added
Innovation may be constrained by connector limits
Difficult to consolidate additional use cases
Questions to ask:
Are all connectors included?
Are premium connectors priced differently?
Are there minimum connector commitments?
3. Consumption based pricing
Consumption pricing typically measures:
Compute usage
Processing time
Data volume
Infrastructure resources
Benefits:
Pay only for what you use
Flexible scaling
Potential challenges:
Budget forecasting becomes difficult
Monthly costs can fluctuate significantly
Complex pricing calculations
Questions to ask:
How is consumption measured?
Are there usage caps?
What happens during seasonal spikes?
4. Subscription pricing
Subscription based ETL pricing provides a fixed monthly or annual fee.
Benefits:
Predictable pricing
Easier procurement process
Stable operating costs
Potential challenges:
Less flexibility
Organizations may pay for unused capacity
Questions to ask:
Are there usage limits?
What features are included?
What happens at renewal?
The hidden costs most teams miss
When evaluating ETL pricing, many organizations focus only on software costs.
In reality, ETL total cost of ownership often includes:
Engineering Time
How much time does your team spend:
Monitoring pipelines
Troubleshooting failures
Managing schema changes
Maintaining connectors
Data Quality Issues
A successful sync does not always mean correct data.
When data discrepancies go undetected, the cost often appears elsewhere:
Reporting errors
Customer impact
Operational inefficiencies
Lost trust in analytics
Tool sprawl
Many organizations start with an ETL platform and gradually add:
As the data ecosystem continues to mature, organizations are increasingly evaluating platforms based on:
Transparency
Predictability
Total cost of ownership
Platform consolidation
Day-to-day operational efficiency
ETL is no longer judged only by how well it moves data between systems. Teams also need a dependable foundation that can support analytics, operational workflows, and AI as those needs expand.
Choosing the right ETL pricing model
There is no single ETL pricing model that works best for every company. The right fit depends on how much data you process today, where that volume is headed, and what your team needs the platform to support. To see how specific platforms compare on deployment, reverse ETL, and fit, read our comparison of the 15 best ETL tools in 2026. Looking beyond the license price, data leaders should also weigh:
Cost predictability
Operational overhead
Data quality requirements
Platform consolidation opportunities
Long term total cost of ownership
The right ETL platform should help your team move faster, not create additional complexity as your data ecosystem grows.
Concerned about rising ETL costs? Many teams discover that ETL is only one part of their data infrastructure spend. Matia helps organizations consolidate multiple data tools into a unified platform, reducing complexity while improving visibility into total cost of ownership. Book a demo to learn more.
Buy the Unified DataOps Platform with your committed Google Cloud spend and run it right where your data already lives.
Today, I'm excited to share that Matia is now available on Google Cloud Marketplace. Alongside our existing listing on AWS Marketplace, it means data teams can now buy and deploy Matia, ETL, reverse ETL, observability, and catalog in one platform, in the cloud their stack already runs on.
It's about removing the two things that slow data teams down most: how hard it is to buy good infrastructure, and how often that infrastructure makes you bend your architecture to fit it.
Easy to buy shouldn't be a luxury
Google Cloud Marketplace eases the mundane but important procurement work off the table. You can purchase Matia through billing you already trust, draw it down against your committed Google Cloud spend, and get started in a few clicks. We've heard it from customers for years: the teams that win with data are the ones that spend their time moving it, not chasing signatures. (It's also why G2 reviewers keep naming us easiest to do business with we'd like to earn that at the buying stage too.)
One purchase, the whole platform
A marketplace listing usually sells you a single product. This one sells you a platform.
When you buy Matia, you get all four pillars working together: ETL, Reverse ETL, Observability, and Catalog. And "together" is the whole point. When ingestion, reverse ETL, observability, and catalog share one foundation, they also share context, lineage across the full pipeline, metadata, and quality signals in a single place. That shared context is exactly what AI needs to be reliable: a model is only as trustworthy as the data and the context feeding it, and unified context is what a stack of fragmented point solutions can't give you.
That's the difference between a tool you happened to buy on a marketplace and a platform that makes the rest of your stack more reliable. Better together: a unified approach to data.
Run it where your data already lives
Data movement works best when the platform doing the moving sits close to the data. Matia meets your data where it already is, on Google Cloud or AWS.
For many teams, this isn't even a preference. Data residency rules, compliance constraints, or an architecture decision already made for you can dictate which cloud your pipelines run in. Supporting both Google Cloud and AWS means the platform adapts to your environment, not the other way around.
A unified platform only delivers on its promise if you can buy it and run it where your team already works. Google Cloud Marketplace is the latest place we've made that true, and it won't be the last.
It might be a giant NetSuite accounting table, a high-volume production database stream, a Salesforce object with years of history, or some operational table that started small and quietly turned into a monster. Most days, it syncs well enough. Then someone needs a full refresh, a historical backfill, or a pipeline recovery, and suddenly the “normal” ingestion job becomes a multi-day event.
That’s when ingestion speed stops being a convenience metric and starts becoming a business problem.
Slow syncs mean stale dashboards. Not only are finance, operations, and leadership looking at old numbers, but downstream dbt jobs wait around, BI models get delayed, and data engineers spend time babysitting pipelines instead of improving the platform. And in modern cloud data stacks, slow syncs can also mean real infrastructure cost.
The short version: when ingestion keeps compute busy longer than it needs to, you usually pay for that drag somewhere.
The problem with single-lane ingestion
A lot of ingestion systems still use a single stream, pulling data through a one lane highway.
They connect to the source, read a batch, write it to the destination, checkpoint progress, and repeat. That sequential model is fine for small tables. It breaks down when the source has hundreds of millions or billions of records.
Matia’s approach is different. Parallelism is one of Matia’s core technical differentiators in data ingestion. Instead of treating a large data pull as one long sequential job, Matia can run multiple sync clients at the same time, breaking the work into smaller chunks that run concurrently.
For data engineers, the idea is pretty straightforward: partition the pull, coordinate the work, and load the destination without turning correctness into a casualty.
One Matia customer had a massive TransactionAccountingLine stream with close to 1 billion records. When using Fivetran, a full refresh took roughly two weeks. Reporting was stale long enough that executives were frustrated, and understandably so. This was not “the dashboard is five minutes behind.” This was “the business is flying blind on important reporting.”
After switching to Matia, the full refresh completed 27x faster. A refresh that took 14 days was brought down to less than a day.
The cost implication is just as important. For the runtime-metered parts of the stack, a 27x runtime improvement can reduce the runtime-dependent portion of a workload by about 96%, assuming the same compute footprint.
That does not mean the total warehouse bill drops 96%. Real bills include transformations, BI queries, storage, background jobs, streaming, orchestration, and plenty of other workloads. But it does mean the ingestion-driven portion of spend can shrink dramatically when large refreshes stop running for days.
Parallelism is a big part of the cost story, but it is not the only part.
Real warehouse savings usually come from several things at once: faster syncs, fewer unnecessary reloads, cleaner recovery, and not moving data nobody uses. A slow sync is an ingestion problem, and a bigger warehouse doesn’t fix a slow extract. Matia speeds up the ingestion layer itself, so not every SLA turns into a warehouse-sizing exercise.
Recharge is another good example. After replacing Fivetran with Matia, they reported a 32% reduction in Snowflake compute costs. That reduction came from Matia’s more efficient sync behavior, plus an audit that removed tables that were not actively used downstream in dbt.
The cheapest sync is the one you do not need to run. The second cheapest is the one that finishes quickly, does not trigger unnecessary warehouse work, and does not force engineers into manual recovery mode.
Reliability is part of the speed story
Speed only helps if the pipeline can recover and Recharge’s old setup explains why. Recurring MySQL replica failures could force full table reloads that took up to 5 days, with a workaround that meant coordinating with vendor support, manually setting binary log positions, and backfilling missed records. That burns engineering time and delays reporting during the exact moments the business wants answers.
With Matia, Recharge adopted a binary log recovery workflow that temporarily switches to the master MySQL endpoint for a single sync during certain replica failures, then return to the replica. What had been a recurring, multi-hour incident response process became a self-service action.
Modern ingestion infrastructure should be fast, but it should also be recoverable. The best pipeline is not just the one that wins the happy-path benchmark. It is the one that gets you back to a trusted state quickly when something breaks.
Ingestion as production infrastructure
The warehouse bill is the obvious cost but the bigger payoff is behavioral.
When historical syncs are fast, teams backfill without hesitation, migrations get less risky, and a broken connector is a contained event instead of a multi-day fire drill.
Matia’s bet is that ingestion should feel like production infrastructure: scalable, observable, recoverable, and fast by design.
Parallel syncs are a big part of that. They turn giant data pulls from single-lane traffic jams into coordinated multi-lane workflows. And when your warehouse, lakehouse, or analytics engine charges for the road, spending less time stuck in traffic is a pretty good strategy.
Welcome to the first blog post from Matia’s Engineering Team! If you like code, and you like data, this post is for you!
At Matia, we're building a data lineage capability to track relationships between tables, warehouses, data lakes, and BI tools, helping teams understand complex data pipelines. Users can reveal upstream/downstream dependencies, track table relationships, and drill into deep table/column-level lineage to debug errors or understand how deprecations propagate through their systems.
As our users began managing larger datasets and more complex layouts, it became clear that a reliable undo/redo mechanism was essential for a seamless experience like revealing deep lineage (which can produce hundreds of nodes and edges), toggling column-level details, or reverting layout changes, we knew we needed a robust solution.
Adding undo/redo to an interactive lineage canvas forced us to confront graph size, async fetches, and design patterns from Memento, through Command Pattern, to Event sourcing. Here’s what we shipped, what we called it, and what we’ve done differently.
From Full State to User Intent: Our Undo Model
Undo sounds simple until your state is a graph, your mutations are async, and one visible “action” is three network phases. We looked at snapshot-based tools like Zundo and diff-based systems like Meta’s Travels.js, but the core question was “what should count as one undoable user intent?” We call our current approach as checkpointed forward-command replay - we record semantic graph operations, batch related sync events into one undo step, and periodically fold old history into a snapshot anchor. That gives us selective tracking, deterministic replay, and undo units that match how analysts actually explore lineage.
That design choice came only after we hit the limits of the two obvious options. A pure snapshot approach is simple, but expensive at lineage scale. If one graph snapshot takes 1 MB, keeping hundreds of undo states quickly becomes 100 MB or more. As the graph grows and each reveal adds hundreds of nested nodes, edges, and layout-related data, those snapshots can easily double in size and become untenable. Diff-based approaches, such as Travels-style JSON patches, reduce the cost of storing full snapshots, but they still work at the level of structural state changes. That is not the unit we care about most. In our lineage graph, one user action can touch large parts of a deeply nested tree, and the resulting patch chain can become noisy and expensive to reason about.
Our current approach sits in the middle: we keep a rolling checkpoint, then store semantic operations on top of it. Instead of remembering every full graph state or every low-level JSON change, we remember user-level intents like “reveal upstream lineage” and replay the remaining operations from the checkpoint during undo/redo. This gives us bounded memory, better undo granularity, and a model that matches how users think about the canvas.
Async batching needs transaction boundaries
In Matia’s lineage tool, one user action is often not one state mutation. For example, when a user reveals table columns, the UI may first mark the column area as loading, then request data from the server, then apply the returned columns, then clear the loading state. To the user, this is one intent: “reveal these columns”. Undo should roll back that whole intent, not just turn a spinner on or off.
The difficulty is that these phases can be async, and async work can overlap. Imagine the user starts revealing columns for Table A, then quickly reveals columns for Table B before Table A’s request finishes. The mutations may arrive in this order:
Table A starts loading
Table B starts loading
Table B finishes and adds columns
Table A finishes and adds columns
If we try to “start recording a batch” and then collect whatever mutations happen next, we can no longer tell which mutations belong together. Is Table A’s late response part of the most recent batch? Without a stable boundary, the history layer has to guess.
This is where our current approach uses transactional events. Each transactional event gets a transaction id at emit time, before the async work races with anything else. All events that belong to the same user intent use the same transaction ID, so the undo stack can group them deterministically even if their mutations are interleaved with another action. Existing tools like Zundo or Travels.js can batch sync and async updates when the sequence is clear, but they do not solve this identity problem for overlapping work. Assigning the batch identity upfront helps us to solve race condition problems to handle batching properly for transactional events.
What do you even consider a batch?
That became the first real question when we looked at manual tracking options like Travels.js and Zundo. Our graph state lives in a Zustand store wrapped with Immer, and that setup does not give us a clean “Immer has finished producing this update” hook that we could safely use as a history boundary. We experimented with attaching a mutation ID so a store subscription could recognize which update had just landed, but that was only a workaround for observing completion, not a real batching model. Once we started thinking through async flows and race conditions, it became clear that completion detection was the wrong center of gravity.
What we needed was to define the batch at the semantic layer: related graph operations share a transaction ID, and the event store treats them as one undo step.
The Investigation: Using AI to Find the Right Undo Model
We used AI tools to move quickly through the design space, not to blindly generate the final architecture. Agentic coding tools gave us a tight feedback loop: prototype a pattern, wire it into a few lineage flows, expose the edge cases, then decide whether to keep or discard it. That led us to what we started calling a “disposable code” mindset. Because AI made prototypes cheaper, we could be more rigorous in exploration instead of more attached to the first working version.
Over a couple of days, we tried and discarded several approaches that would normally have required much more engineering time to evaluate properly. The result was not a textbook Memento stack, a classic Command pattern, or full Event Sourcing. We landed on the hybrid approach that matched our product constraint. We call it checkpointed forward-command replay. In practice, that means we record semantic operations, batch related async phases into one user-visible undo step, keep a rolling checkpoint as an anchor, and implement undo by removing the last operation and replaying the remaining operations forward.
Research highlights
Zundo / Zustand temporal middleware: Zundo was attractive because it already understands Zustand, but its default model tracks store-level changes rather than user intent. For lineage, we needed “undo reveal upstream lineage”, not “undo loading flag” or “undo the third internal mutation.” We also found that safely controlling tracking around batched async work was difficult. Manual pause/resume workaround introduced race-condition concerns.
Immer patches: Immer patches gave us a lower-level diff mechanism, but they pushed us toward structural history instead of semantic history. They also didn’t remove the hardest parts: large graph payloads, non-serializable derived state, and complex replay behavior. For our use case, patch chains felt close to the memory and complexity profile of diff-based or memento-like solutions without giving us the undo granularity we wanted.
Command pattern: We prototyped commands with both execute() and undo(). AI made this surprisingly fast because much of the forward logic already existed, and agents could often generate plausible inverse logic in one pass. But the long-term cost was clear: every graph action would need a correct inverse, plus tests proving that repeated undo/redo sequences behave as expected. Stateful commands also made the history stack harder to reason about. We kept the useful part, forward commands, and dropped per-command inverse logic. In the current design, commands only know how to apply themselves from a snapshot; undo is structural - pop from history and replay forward from the checkpoint.
Travels.js / diff-based tracking: Travels.js was interesting because it offers efficient diff-based time travel on top of mutative.js. But adopting it meant introducing a separate state system and bridging it back into our existing Zustand graph store. That bridge became a significant integration layer, and early proof-of-concept migrations exposed behavior that didn’t line up cleanly with our existing graph logic. Most importantly, we still couldn’t get comfortable with race conditions around manual tracking and async batching. The lesson was that diff-based time travel is powerful, but our problem was less about capturing every state transition and more about preserving meaningful lineage operations.
We shipped a client-side undo layer built around semantic operations, transaction IDs, and a rolling checkpoint.
Instead of storing a full graph snapshot for every undo step, we keep one baseSnapshot as an anchor and record a bounded history of forward operations on top of it. Any undoable state can be reconstructed as: “base snapshot + replay of the remaining operation history.”
That gives us the memory profile we wanted without forcing every feature to implement its own inverse undo() logic
At the core of this approach is replay:
const replay = () => {
let state = baseSnapshot;
const flatEvents = history.flatMap((entry) => entry.events);
// Replay serializable graph state only — events do not capture layoutEnginefor (const event of flatEvents) {
state = applyEvent(state, event);
}
// Retained mode: reconcile untracked layoutEngine with replayed graph state// layoutEngine is excluded from event history (non-serializable), so after replay// we diff graph nodes vs layout nodes:// stale (in layout, not in graph) → remove from layout (+ related edges)// new (in graph, not in layout) → add to layout (+ related edges) LayoutEngineTools.for(state).retainedMode();
};
This also addresses the serialization problem in a pragmatic way. We do not try to serialize every piece of graph infrastructure. Serializable operation payloads are captured in event snapshots, while derived or non-serializable pieces, such as our layout engine, are reconstructed during replay.
That pattern gives us room to grow. If more non-serializable infrastructure is added to the store later, it does not need to be copied into every history entry. It can follow the same model: keep undo history focused on semantic graph operations, and rebuild runtime-only infrastructure when deriving state.
Transaction-Based Event Grouping
At emit time transactional events get their transactionId - _txId; the event store then uses that _txId to decide whether the event should start a new undo entry or join an existing one. In other words, the history stack stores semantic undo units, not raw mutation-by-mutation steps.
const appendToHistory = (event) => {
  const txId = event._txId;
  if (txId) {
    const existingBatch = history.find((entry) => entry.txId === txId);

    if (existingBatch) {
      // Same transaction still open — extend current undo unit
      existingBatch.events.push(event);
      return;
    }

    // New transaction - start a new undo unit
    redoStack = [];
    history.push({ txId, events: [event] });
    return;
  }

  // No transaction id - each emit is its own undo unit
  redoStack = [];
  history.push({ txId: undefined, events: [event] });
};
For example, revealing column-level lineage can spawn new tables, connect them, open their columns, and highlight column relationships. Each spawned table may trigger its own async “expand columns” flow: loading state, fetched columns, rendered columns, and error or settled state. On their own, those would be separate operations. But when they are part of the original “Reveal Column Level Lineage” action, we pass the parent transaction ID into the column expansion flow, so all of those child events are appended to the same history entry.
That means the timeline looks like many internal steps, but the user gets one undoable action:
The implementation is intentionally simple. The event factory resolves the transaction ID when the event is created. Then the event store groups events with matching _txId. The column expansion flow can either create its own transaction or join a parent one:getTransactionId: () => transactionId ?? buildExpandingColumnsTransactionId(nodeId)
So when column expansion is triggered directly, each table expansion is its own undoable unit. But when it is triggered as part of column-level lineage reveal, it receives the parent transaction ID and becomes part of the larger undo step.
This is less like true nested transactions and more like transaction composition by shared ID. Multiple async flows can run at different times, but as long as they emit events with the same transaction ID, the undo system treats them as one semantic action. Undo does not reverse each child operation individually; it removes the whole transaction from history and replays the remaining operation log from the latest checkpoint.
Why This Architecture Works for Us
Selective Tracking Supports Migration
We do not track every Zustand mutation automatically. Only mutations that emit configured flow graph events become undoable. That tradeoff gives us control over undo semantics and lets us migrate incrementally.
This is especially important for a large graph UI where not every state change should be user-visible history. Some mutations are meaningful user intents; others are internal UI mechanics. The architecture lets us decide what is worth tracking now, while still leaving a clear path for future features to join the undo system by emitting events.
Type Safety Keeps Extensions Honest
The contract lives at the call site, and that call site stays lightweight: developers describe what happened, attach a snapshot, and TypeScript infers the rest. No generic plumbing, no payload casts - the snapshot shape and the handler stay aligned by construction. Different parts of the product operate in different scopes: some events affect the whole graph, others only a localized slice (pagination within a single node is one example). Those scopes stay separate, but the emission pattern is the same. When a new vertical slice needs its own scope, it plugs into the same model; the type system grows with it instead of forcing a rewrite across existing emitters.
One Apply Path, Minimal Runtime Overhead
Each event uses the same forward mutation path when it is first emitted and when it is replayed during undo/redo. We do not maintain separate inverse logic for every action.
The subscription is also created once when the event store is wired to the Zustand store, so we avoid component-level useEffect cleanup and re-subscription concerns during React renders.
Bounded History Through Snapshot Compaction
The history stack has a fixed limit. When it overflows, we do not simply drop old behavior from the system. Instead, we fold the oldest history entry into a rolling baseSnapshot using the same forward-apply logic, then remove that entry from the undoable window.
Undo works by moving the latest transaction from history to redoStack, then deriving state again from baseSnapshot by replaying the remaining history. Redo moves the transaction back and derives state the same way. There is no separate “current cursor” state to maintain.
Scales With Features That Emit Events
New features can become undoable by emitting replay-safe events. They do not need to implement custom inverse commands, and they do not need to understand the full orchestration layer.
The main requirement is discipline: event handlers must be snapshot-driven and closure-free, because the same event may run immediately and later during replay.
The Tradeoff
We gave up “track everything automatically” in favor of explicit, semantic tracking. That matches the product constraint: undo should roll back user intent, not every internal state transition.
What we gained is a system that can grow feature by feature: transaction batching for async flows, bounded memory through checkpointing, and a single replay model that is easier to reason about than maintaining manual inverse logic for every graph operation.
Key Lessons
Overall, this project surfaced a few lessons that shaped the design we shipped:
Snapshot-based undo works well for small, serializable state trees, but it breaks down quickly when the state is a large graph with derived infrastructure and async mutations. For our lineage canvas, the better fit was a pragmatic middle ground: semantic operation replay from a rolling checkpoint. We do not store a full snapshot per step, and we do not implement inverse commands for every action. Instead, we record forward operations, batch related events by transaction ID, and rebuild state by replaying the remaining history.
That made a few things clear: defining the user-facing undo unit matters more than choosing a textbook pattern; ID-based transaction grouping is more reliable than timing heuristics; replay safety depends on snapshot-driven, closure-free handlers; and TypeScript helped make the migration safer by catching contract drift early. AI tools also lowered the cost of architectural exploration, making it realistic to compare patterns like Memento, Command, and event sourcing before landing on the approach that fit our product constraints.
Here’s a question data engineers have been debating for years: should you move data with traditional ETL, or is it time to switch to Change Data Capture?
The honest answer? It depends. But the more useful answer is that most modern data teams shouldn’t have to choose, and understanding the difference between these two approaches will help you build a stack that’s faster, more reliable, and a lot less painful to maintain.
Let’s break it down.
What Is ETL (and why has It lasted this long)?
ETL:Extract, Transform, Load: is the original workhorse of data engineering. The concept is simple: pull data from a source, reshape it to fit your destination schema, and load it into your warehouse on a schedule.
ETL has been around for decades because it works. It’s predictable, well understood, and integrates cleanly with tools like dbt for transformation. Most data teams start here, and for a lot of use cases, it’s still the right call.
Where traditional ETL shines:
Historical reporting and batch analytics where freshness isn’t critical
Structured, high-volume data migrations
Workflows where transformation complexity is high and latency requirements are low
Teams earlier in their data maturity (Crawl phase)
Where it starts to break down:
You need data fresher than your batch window allows
Full table scans are hammering your source systems
Your pipelines are fragile and break when upstream schemas change
Business teams are asking “why is this number from yesterday?”
What Is Change Data Capture (CDC)?
Change Data Capture is a different paradigm entirely. Instead of periodically pulling all (or most) data from a source, CDC listens to the database’s transaction log and captures only what changed, inserts, updates, deletes, in near real time.
Think of ETL like taking a snapshot of a whiteboard every hour. CDC is like watching someone write on the whiteboard as it happens.
“The modern data stack wasn’t designed. It evolved. One tool for ETL. Another for Reverse ETL. One for observability. One for governance. CDC is often what’s missing from the conversation, the thing that makes real-time possible.”
CDC has become significantly more important as companies adopt AI and real-time analytics. When AI models need fresh data to make decisions, batch pipelines with 1-hour windows stop being good enough.
Where CDC shines:
Real time dashboards and operational analytics
AI and ML pipelines that need fresh training data or inference inputs
Reverse ETL workflows where stale data reaching your CRM or marketing platform is a business problem
High frequency transactional systems where full scans would create unacceptable source load
More complex observability: you need to monitor the log, not just the pipeline
Schema changes in the source can cause downstream issues if not handled properly
Not every source system exposes a transaction log
A common pattern we see with data teams at growth-stage companies: ETL for less time-sensitive analytical workloads, CDC for anything touching operational systems or AI pipelines. The challenge is when those two worlds are managed by completely different tools — different monitoring, different alerting, different debugging experiences.
That’s where fragmentation starts costing you real engineering time.
According to Enterprise Strategy Group, nearly half of mid market and above companies use 26 or more data vendors. Managing CDC and ETL across separate platforms is exactly the kind of complexity that compounds.
How Matia Handles Both, Without the Fragmentation
Matia is a unified DataOps platform built for data, AI, and engineering teams. One of the core principles behind the platform is that you shouldn’t need separate tools for ingestion, observability, reverse ETL, and catalog, and you definitely shouldn’t need separate tools for batch ETL and CDC.
What that looks like in practice:
Postgres CDC with parallel syncs, Postgres CDC with parallel syncs
Matia’s Postgres connector supports log based CDC with granular visibility into WAL monitors and table-level logs. One customer reduced a sync from 5 days to 20 hours for an 8TB Postgres database.
Because Matia combines ingestion and observability, anomaly detection happens at the point of ingestion. If corrupt data starts flowing through your CDC pipeline, Matia can stop the downstream push before it pollutes your warehouse or your reverse ETL targets.
Data moving in (ingestion/CDC) and data moving out (Reverse ETL) are managed in one place. That means your observability layer covers the full journey, not just half of it.
dbt native
Matia doesn’t replace dbt for transformation. It works alongside it, monitoring dbt runs, surfacing lineage, and automatically updating GitHub PRs when schema changes impact downstream models.
So, CDC or ETL? Here’s Our Take:
If your data team is still running purely on batch ETL and your stakeholders are starting to ask for fresher data, it’s worth evaluating CDC for at least part of your pipeline. You don’t have to rip and replace, start with your highest-frequency, most business-critical sources.
If you’re already running CDC but managing it in a separate tool from your ETL and observability, ask yourself: how much engineering time goes into stitching those tools together, debugging across systems, and keeping everything in sync?
The answer is usually “too much.”
Ramp reduced their data platform cost by ~40% after moving to a unified approach. The savings aren’t just in licensing, they’re in the engineering hours your team gets back.
Want to see it in action?? Matia’s live product demo on July 29th covers exactly this– how data teams are replacing their pile of ETL, Reverse ETL, Observability, and Catalog tools with one unified platform. A real walkthrough of how Matia handles data movement from ingestion to activation.
A few weeks ago, we hosted a webinar with Matthew Shump from Drata about data readiness for AI. (Haven’t watched it yet? Check out the recording below!) Matthew and his team at Drata have deep experience with preparing data for AI. At the time, it felt like one of those topics that was obviously important, but still a little hard to pin down because everyone was coming at it from a different direction. Some teams were thinking about chat-based analytics. Some were thinking about AI agents. Some were thinking about customer support automation, internal copilots, sales workflows, or product intelligence. All were looking for better ways to activate customer data across the business.
Since then, our team has been to Snowflake Summit and Databricks Data + AI Summit, and the conversations we had there made the webinar feel even more timely. Across both events, the same theme kept coming up with customers: companies are excited about AI, they are experimenting with AI, and in many cases they already have AI features or workflows in production. But they are also running into the same uncomfortable reality. The AI layer is only as useful as the data foundation underneath it.
That may sound obvious, but it becomes a lot less obvious once you get into the details. Most companies already have data moving through their systems. They have pipelines. They have warehouses. They have dashboards. They have modeled tables, operational tools, BI layers, and a growing collection of AI products that all want access to some version of the truth. The issue is not usually that data does not exist. The issue is that the data is not always fresh, trusted, well-modeled, semantically clear, or governed in a way that makes it safe for automated reasoning.
That was the main idea behind the webinar, and after spending more time with customers who are trying to operationalize AI, I think it is worth revisiting. These are my 6 key takeaways from the webinar:
A green pipeline does not mean the data is ready
One of the traps we talked about in the webinar is that traditional pipeline health can create a false sense of confidence. A job can run successfully. A dashboard can refresh. A table can be queryable. Every box in the orchestration tool can be green. And yet, the data being served to an AI system can still be stale, incomplete, misleading, or missing the business context required to use it correctly.
In the dashboard era, a human was usually still in the loop. Someone saw the number, questioned it, compared it to another report, asked the analytics team, or noticed that something looked off. That did not make traditional analytics perfect, but it did create natural friction. AI removes a lot of that friction. It makes it much easier for someone to ask a question and get a confident answer immediately. That is powerful when the answer is grounded in the right data. It is dangerous when the system is reasoning over stale snapshots, ambiguous fields, or metrics that have drifted away from their original definitions.
This is why “data readiness” has to mean more than pipeline uptime. AI-ready data needs freshness, quality, lineage, observability, governance, and business-aligned models. It also needs context. A pipeline can move a field from one system to another, but it usually does not explain what that field means, who owns it, whether it is approved for a particular use case, or how it should be interpreted when the business asks a question in plain English.
That is the gap a lot of teams are running into right now. They have data movement, but not enough data meaning.
The real bottleneck is interpretation
The most useful part of the webinar, at least for me, were the real-world situations that Matthew’s team at Drata have faced. He grounded the whole topic in the operational reality of running a modern data team. Drata, like a lot of companies, has centralized data and invested in structured definitions, modeling, and governance. That is the right move, but it also creates a familiar tension. Business users want more access to data, and they want it faster. Data teams want to enable that access without turning the warehouse into a choose-your-own-adventure book of raw tables, inconsistent metrics, and undocumented assumptions.
This is where AI gets interesting. In theory, AI can help reduce the dependency on analysts for every exploratory question. A finance, product, sales, or operations power user should be able to ask questions of governed data without writing every query by hand or waiting for the analytics team to pick up every request. Matthew talked about how this changes the role of self-service: not by giving everyone uncontrolled access to everything, but by creating different modes of access for different personas.
That distinction is important. Power users can be given more flexibility because they have enough domain knowledge, skepticism, and technical fluency to validate what they are seeing. Broader business users may need a more constrained experience, where AI is operating on certified metrics, curated models, and safer interfaces. The goal is not to pretend that everyone instantly becomes an analyst because they have a conversational interface. The goal is to let more people answer more of their own questions while preserving enough structure that the answers still mean something.
In other words, AI can help with the bottleneck, but only if we give it something better than raw access. Otherwise we are not democratizing insights. We are democratizing confusion.
Raw data is not a foundation for trustworthy AI
AI self-service sounds simple: connect an agent to the warehouse, let users ask questions, and let the model figure it out. Anyone who has spent time around real enterprise data knows why that falls apart quickly.
Warehouses are messy because businesses are messy. There are operational source systems, historical migrations, deprecated fields, overlapping definitions, tenant-specific patterns, renamed metrics, half-documented transformations, and business logic that lives in a mix of dbt models, dashboards, spreadsheets, and people’s heads. Giving an AI agent access to all of that does not magically create understanding. It gives the agent a much larger surface area for misinterpretation.
Matthew gave a great example during the webinar. He asked what sounded like a straightforward question: show the top accounts by ARR and include their signup date. Different AI interfaces came back with different answers. The problem was not that the systems were useless or that the models were broken in some dramatic way. The problem was interpretation. What does “signup date” mean? Product activation? Contract start? Closed-won date? Something else? What does ARR mean in that context? Current ARR? Starting ARR? Booked ARR? Pipeline? Depending on how the system resolves those terms, it may produce answers that are technically defensible but still wrong for the user’s intent.
That is exactly the kind of problem data teams need to solve before AI becomes deeply embedded in business workflows. The fix is not just better prompting. It is better context engineering around the data itself. Semantic definitions, certified queries, modeled entities, metric documentation, data catalog, lineage, and evaluation sets all become part of the AI architecture. They are not side projects. They are the mechanism that helps the AI interpret the business correctly.
This is also why modeled data matters so much. A well-designed analytical model narrows the space of possible interpretation. It gives the AI a safer set of entities, relationships, and definitions to work with. That may reduce some flexibility compared to querying raw source tables directly, but it dramatically improves consistency. And for most business use cases, consistency is not optional. If two executives ask the same question, they should not get three different answers because the AI made three different assumptions.
Freshness should be treated like an SLO
Another idea from the webinar that has stuck with me is that freshness needs to become a first-class concern. Data teams already think in terms of pipeline failures, latency, completeness, schema changes, and distribution shifts. But in AI workflows, freshness becomes even more visible because the system may continue producing answers long after the underlying data has stopped representing reality.
Different use cases have different freshness requirements. Executive reporting may be fine with daily updates. Product usage recommendations might need data from the last hour. Fraud, security, inventory, and operational workflows may need data that is fresh within minutes or seconds. The important thing is not that every AI use case needs real-time data. The important thing is that the freshness expectation should be explicit.
If an AI agent is helping with a task, it should know whether the data is fresh enough for that decision. If it is not, the system should degrade gracefully. That might mean warning the user, refusing to answer, falling back to a safer workflow, or flagging the output as based on stale data. What it should not do is keep responding as though nothing has changed.
This is one of the reasons observability and lineage become so important. Observability helps detect when something is wrong: freshness gaps, schema changes, volume anomalies, completeness issues, or segment-level shifts. Lineage helps explain where the problem came from and what it affects downstream. In a traditional analytics stack, that might mean identifying which dashboards are impacted. In an AI-enabled stack, it also means identifying which agents, workflows, recommendations, and operational systems may now be reasoning over bad inputs.
Silent failures were already painful. AI makes them more expensive.
Dashboards are not dead, but their job is changing
The webinar also touched on a question that comes up constantly now: do dashboards still matter if people can just ask an AI assistant for the answer?
I think the answer is yes, but the role of dashboards gets narrower and more intentional. Dashboards are still the right tool for stable, shared views of the business. If a leadership team reviews the same operating metrics every week, there is no reason to regenerate that view through a conversational interface every time. If a metric is important enough to be part of a recurring business rhythm, it probably deserves a durable, trusted surface.
Where AI changes the picture is exploration. A lot of dashboards became bloated because they were trying to serve every possible follow-up question. That is how teams end up with 12 tabs, 25 filters, and a dashboard that technically contains the answer somewhere if you already know how to find it. Conversational AI is a better fit for some of that long-tail exploration, especially when it is grounded in the same certified models and definitions as the dashboard.
So the future is not dashboards versus AI. It is dashboards for shared operating truth, and AI for guided exploration, investigation, and follow-up. The two should complement each other. If they are grounded in different definitions, they will just create another trust problem.
Activation is where the architecture becomes real
The last piece of the conversation that feels especially important after the summits is activation. It is one thing to centralize data and let people analyze it. It is another thing to push trusted, modeled data back into the systems where people actually work.
That is where reverse ETL fits into the AI readiness conversation. Historically, reverse ETL has been about taking modeled data from the warehouse and syncing it into operational tools like CRMs, customer success platforms, or marketing systems. That pattern is still valuable. But now those downstream systems increasingly have their own AI features, agents, copilots, and automation layers. Feeding those systems with trusted data becomes part of the AI foundation too.
This is where a hub-and-spoke architecture starts to make sense. The warehouse or data platform becomes the hub where data is centralized, modeled, observed, and governed. The spokes are the operational systems, AI tools, dashboards, and workflows that consume that data. But the spokes need to be managed carefully. If every downstream system has its own definition of customer health, churn risk, product usage, or account value, then AI will amplify those inconsistencies instead of resolving them.
Hub-and-spoke data architecture for AI data activation
The goal should be to activate the same trusted data products across analytics, operations, and AI workflows. That way, when a customer success manager sees a recommendation in a CRM, a support workflow references account context, and an internal agent summarizes customer risk, those systems are all working from the same foundation.
That is easy to say and hard to do. But it is exactly where the value is.
The retrospective
AI-ready data is not just clean data. It is fresh, modeled, observable, governed, semantically rich, and activated in the right places. After Snowflake Summit, Databricks Data + AI Summit, and a lot of customer conversations, I feel even more confident in that framing.
The companies making real progress are not treating AI as a layer they can simply drop on top of an existing data mess. They are starting with specific use cases. They are asking what data the use case needs, how fresh it needs to be, what definitions matter, which users should have access, what guardrails need to exist, and how outputs will be validated. They are thinking about human workflows and AI workflows together. They are also accepting that this will be iterative, because business definitions change, source systems change, product behavior changes, and user expectations change.
That may be less exciting than a demo where an AI agent answers a question in five seconds, but it is much closer to the work that actually matters. AI does not remove the need for strong data foundations. It raises the stakes.
The model can be impressive. The interface can be polished. The workflow can feel magical. But if the data underneath is stale, ambiguous, fragmented, or poorly governed, the system will eventually produce the wrong answer with confidence. That is the risk technical teams are trying to manage now, and it is why data readiness has moved from a background concern to one of the central questions in enterprise AI.
The webinar was about that shift. The conversations since have only made it clearer.
Data has always been complicated. But something is different right now, and most data teams can feel it, even if they can't quite name it.
We recently sat down with Ben Segal, co-founder and CEO of Matia, and data thought leader, Doug Laney, bestselling author of Infonomics and a former Gartner Distinguished Analyst, to talk about what's actually happening at the intersection of AI and the modern data stack. No vendor pitche, just two guys who've spent a lot of time in the trenches of data thinking out loud about where we are and where we're headed.
Here's what came out of that conversation.
The data stack wasn't designed, it accumulated
This might be the most honest framing of how we got here.
"Organizations didn't really design a data stack," Doug said during the webinar. "They kind of accumulated one." Every new data challenge created a new tool. ETL tools, data warehouses, self-service analytics, observability platforms, each one was bought or built in response to urgency, not architecture. And the result? Stacks that are technically impressive but organizationally incoherent.
Ben knows this firsthand. Before starting Matia, he was head of data at Pangaea, managing five or six vendors simultaneously, meeting with each of them once a year at renewal time, fighting with account executives over pricing, and spending more time managing tools than actually doing anything meaningful with data.
Sound familiar?
The fragmentation was tolerable before. It's becoming untenable now, because AI doesn't solve the underlying mess–it amplifies it. "AI doesn't magically fix a fragmented environment," Doug said. "It can actually amplify the consequences of unclear definitions, weak data lineage, and inconsistent governance."
AI raised the stakes. And the bar.
The pressure on data teams right now is real. AI initiatives are failing left and right, not because AI doesn't work, but because the data underneath it doesn't.
Doug put it in perspective. He pointed out that the same "most projects fail" headline has been written about every major technology wave, the internet, data warehouses, big data, data science. That's how innovation works. What's different this time is the confusion between experimentation and operational readiness.
Ben added something sharp here: organizations are now using data operationally, not just for reporting. Data isn't just flowing to dashboards anymore. It's powering live products. Driving automated decisions. Feeding AI agents. That means a bad pipeline isn't just an inconvenience that gets fixed next morning, it can break something a user is actively depending on right now.
The stakes got bigger. The tolerance for bad data got smaller.
The real differentiator isn't the model, it's the data
This came up more than once, from both directions of the conversation.
The AI models themselves are rapidly becoming commodities. What makes one organization's AI better than another's isn't which model they're running, it's the quality, context, lineage, and governance of the data they're feeding it.
"If data is treated like an asset, and managed and measured like one, that's where organizations are going to win," Doug said.
Ben echoed it from a different angle: data teams are increasingly becoming full engineering teams. The data they manage isn't background infrastructure anymore, it's a live operational function. Which means reliability, observability, and governance aren't nice to haves. They're table stakes.
What the best data organizations actually do differently
We asked both of them what separates leading data organizations from everyone else. Their answers were refreshingly practical.
Doug's take: The best organizations don't treat data as an IT function. They treat it as an enterprise capability with real business accountability. He also made a distinction worth holding onto: rather than "data owners," a term that tends to produce hoarding and silos. He prefers "data trustees." People who are ethically and legally responsible for the quality, meaning, use, and value of data within their domains.
Leading organizations also think about data products, not just data projects. They measure data's condition and its contribution to business value. And, critically, they don't confuse data governance with bureaucracy. Good governance makes data easier to find, trust, and use. Bad governance just creates meetings.
Ben's take: From working closely with companies like Ramp, he's noticed a few recurring patterns in high performing data teams. First, the most effective data leaders are relentless about showing ROI. They frame data work in dollar terms, not technical terms, and that makes it much harder for anyone to cut their budget. Second, they build strong relationships across the business, so when something goes wrong (and something always eventually goes wrong), there's goodwill already in the bank. Third, they're early adopters. They move to Snowflake, ClickHouse, and vector databases before everyone else does. They don't spend their energy saving 5% on tool costs — they spend it positioning their teams to move faster.
And one more thing Ben mentioned: the best data leaders aren't isolated. They're connected. They talk to other data leaders. They share what's working. That network is underrated.
The case for a unified DataOps platform
Doug had a phrase for what happens when you build a data stack out of best in class point solutions: "Best of breed begets worst of bleed."
The math isn't complicated. More tools means more handoffs. More handoffs means more points of failure. More points of failure means nobody is actually accountable for the whole system, everyone owns a piece of reliability, and nobody owns all of it.
That's the problem Matia was built to solve. When ingestion, reverse ETL, observability, and catalog all live in one platform, you get something that fragmented stacks can't offer: full end to end visibility into where data came from, whether it's been changed, whether it's complete, who uses it, and what decisions depend on it.
One of the most compelling moments in the webinar was Ben describing Matia's MCP integration, currently in private preview. A customer used it to ask: "I want to deprecate this column, what will the downstream impact be, and what monitors should I add or remove?" The answer came back in 30 seconds. Something that used to take weeks.
That's what unified looks like in practice.
What's next for data leaders, and a word on the CDO role
Both Ben and Doug see the CDO role evolving significantly. Data environments are going to become more self-governing. Metadata will stop being passive and start being active, routing data, classifying it, monitoring it, flagging it when it's no longer fit for purpose. Data quality will become more self-diagnosing.
Doug's framing for the destination: the self-driving organization. An enterprise where data, AI, rules, agents, sensors, and process management are integrated tightly enough that many functions can monitor, decide, and act with limited human intervention.
Ben added a more grounded note. He thinks CDOs will start looking more like CISOs — carrying real ownership of risk, not just oversight. "Things are gonna be automated, you'll have less control. It will work beautifully when it works. But the day it doesn't work, you need to be ready to catch it." The CDO who thrives in that world will be both strategic and hands on. Close to the data, not just managing from a distance.
If you were a CDO today, what would you prioritize?
We asked both of them directly. Here's what they said.
Doug: Automate everything you reasonably can, right now. Mandate– don't just recommend – that data be treated with the same discipline as any other company asset. And think seriously about redesigning your operating model for an AI-enabled enterprise, from the ground up if necessary. The models humans built for businesses were designed around human limitations. That's changing.
Ben: Make sure you're on the right tools, and actually using the right features within those tools, because the pace of change is fast enough that what was true 12 months ago may not be true now. And invest in building AI skills across your team, not just at the top.
One thing that's overhyped
We couldn't resist asking.
Doug's answer: AI as a copilot or assistant. Useful starting point, but not the real prize. The real prize is AI-orchestrated work, agents working in swarms to decide what needs doing, gather data, analyze it, and act. That's the destination.
Ben's answer was more technical, but equally interesting: he thinks the way we write code and logic today, structured for human readability, will look very different in a few years. Agents don't need code to be human-readable. They need it to be fast and efficient. "We'll see huge difference in the way code and logic are written–way more efficient for agents than for humans." Think less SQL, more something closer to protobuf.
The bottom line
The companies that are going to win in this next era aren't necessarily the ones with the biggest AI budgets or the most advanced models. They're the ones taking their data seriously, including managing it as an actual asset, unifying it so it can be governed and trusted end to end, and building the infrastructure that lets AI actually do something meaningful on top of it.
The data stack got complicated by accident. Fixing it on purpose is the work.
Watch our webinar, The Next Era of the Data Stack: Unified DataOps, featuring Doug Laney and Ben Segal, where they dive deeper into the future of data infrastructure, AI readiness, and why today's data stacks are becoming increasingly difficult to manage.
Today, Matia is launching a new integration with Omni, an AI analytics platform, to bring end-to-end visibility from the data source through your warehouse and into every Omni document, dashboard, visualization, and field.
Most data teams can tell you where a dashboard lives. Far fewer can tell you, in one click, exactly where the numbers in that dashboard came from and what downstream impacts are in the same interface. The journey from a source system through the warehouse and into a business-facing chart usually spans several tools, and the lineage breaks somewhere in the handoffs.
Today we are closing that gap. Matia's Catalog now connects to Omni so you can trace any visualization back through your warehouse to the original source. This provides visibility into where numbers come from to help build trust.
Omni: The last mile of your data stack
Omni sits between the rest of the data stack and the stakeholders they serve. Data flows from sources into a warehouse like Snowflake or BigQuery, gets modeled and transformed, and then gets surfaced in Omni so business teams can act on it. Stakeholders rarely understand the full pipeline, but building trust means giving them visibility into where numbers came from and how they were transformed along the way.
That question gets sharper as teams put AI on top of the analytics layer. When users ask questions with AI, you need governance and traceability to build trust. Omni's built-in semantic layer ensures context and governance, and Matia's connector makes it traceable.
Because Matia already unifies ETL, reverse ETL, observability, and catalog in one platform, connecting Omni completes the picture. You can now follow data all the way from the point it enters your stack to the visualization a stakeholder is looking at, without stitching together separate tools to do it.
What you get with the Omni and Matia integration
Full asset visibility. Once you connect Omni, the Catalog surfaces the entire hierarchy: folders, documents, workbooks, visualizations, and query fields. Your BI assets become as discoverable and governed as the rest of your stack.
Column-level lineage from source to BI. This is the core of it. Lineage runs source to warehouse to BI, so you can trace a single column from an Omni visualization back through the Omni models, a Snowflake data mart, back through the staging tables, and all the way to where it originated. In practice that origin might be a Salesforce integration, a sessions table in MongoDB, a user feedback report in Google Sheets, or a financials table in your warehouse. You can also start from the data store and go forward to see every Omni asset a given source feeds.
Full SQL coverage. Lineage works whether a workbook was built with standard queries or with user-edited SQL, so there are no gaps in coverage. Mapping holds up against the way real teams actually build in Omni.
Complete lineage across the whole stack
Most lineage tools draw a single line: this dashboard, back to that source. Matia and Omni together map the full web of dependencies across your stack, so you can see everything an asset touches in both directions.
Trace in both directions. Start from an Omni visualization and work backward to the source, or start from a source or warehouse table and work forward to every Omni asset it feeds. The same view works either way, so you can answer "where did this come from" and "what breaks if I change this" from the same place.
Surface indirect relationships. A single visualization is often fed by more than one path. Matia shows the full set, including a second data mart or a separate Google Sheet feeding the same Omni asset, so dependencies that normally live in someone's memory become visible in the platform.
Lineage that accounts for observability. Because catalog and observability sit in the same platform, column-level lineage carries anomaly detection along the path. You are not just seeing how data connects, you are seeing where it is at risk.
This is what full end-to-end lineage is supposed to mean. Without a unified platform underneath, the trail keeps breaking at the seams between tools. Matia traces the journey across ingestion, the warehouse, and back out to BI in a single click. That matters more as AI moves into the analytics layer. When an AI tool answers a question off your Omni data, Matia is the foundational infrastructure that put the data there, monitored it for anomalies, and lets you follow that answer back through every step to the source.
[IMAGE 1: lineage diagram / product screenshot illustrating source-to-Omni column-level lineage, near the "Complete lineage across the whole stack" section]
How teams are already using it
David Protein, which runs its stack on BigQuery, is an early user of the Omni integration.
"Seeing the lineage connect end to end means when something breaks, we trace it in one place instead of digging across tools. Less complexity, faster debugging, pipelines that are easier to maintain. The Matia and Omni integration ties it together, from the data moving through to the dashboards and semantic layer we build on top of it."
Ari Azbel, Senior Data Analytics Engineer, David Protein
Now available
The Omni integration is available now. If you are already on Matia, connect your Omni workspace from the catalog and your assets will start surfacing automatically, with lineage mapped back through your stack.
Today, Matia is launching a new integration with Omni, an AI analytics platform, to bring end-to-end visibility from the data source through your warehouse and into every Omni document, dashboard, visualization, and field.
Most data teams can tell you where a dashboard lives. Far fewer can tell you, in one click, exactly where the numbers in that dashboard came from and what downstream impacts are in the same interface. The journey from a source system through the warehouse and into a business-facing chart usually spans several tools, and the lineage breaks somewhere in the handoffs.
Today we are closing that gap. Matia's Catalog now connects to Omni so you can trace any visualization back through your warehouse to the original source. This provides visibility into where numbers come from to help build trust.
Omni: The last mile of your data stack
Omni sits between the rest of the data stack and the stakeholders they serve. Data flows from sources into a warehouse like Snowflake or BigQuery, gets modeled and transformed, and then gets surfaced in Omni so business teams can act on it. Stakeholders rarely understand the full pipeline, but building trust means giving them visibility into where numbers came from and how they were transformed along the way.
That question gets sharper as teams put AI on top of the analytics layer. When users ask questions with AI, you need governance and traceability to build trust. Omni's built-in semantic layer ensures context and governance, and Matia's connector makes it traceable.
Because Matia already unifies ETL, reverse ETL, observability, and catalog in one platform, connecting Omni completes the picture. You can now follow data all the way from the point it enters your stack to the visualization a stakeholder is looking at, without stitching together separate tools to do it.
What you get with the Omni and Matia integration
Full asset visibility. Once you connect Omni, the Catalog surfaces the entire hierarchy: folders, documents, workbooks, visualizations, and query fields. Your BI assets become as discoverable and governed as the rest of your stack.
Column-level lineage from source to BI. This is the core of it. Lineage runs source to warehouse to BI, so you can trace a single column from an Omni visualization back through the Omni models, a Snowflake data mart, back through the staging tables, and all the way to where it originated. In practice that origin might be a Salesforce integration, a sessions table in MongoDB, a user feedback report in Google Sheets, or a financials table in your warehouse. You can also start from the data store and go forward to see every Omni asset a given source feeds.
Full SQL coverage. Lineage works whether a workbook was built with standard queries or with user-edited SQL, so there are no gaps in coverage. Mapping holds up against the way real teams actually build in Omni.
Complete lineage across the whole stack
Most lineage tools draw a single line: this dashboard, back to that source. Matia and Omni together map the full web of dependencies across your stack, so you can see everything an asset touches in both directions.
Trace in both directions. Start from an Omni visualization and work backward to the source, or start from a source or warehouse table and work forward to every Omni asset it feeds. The same view works either way, so you can answer "where did this come from" and "what breaks if I change this" from the same place.
Surface indirect relationships. A single visualization is often fed by more than one path. Matia shows the full set, including a second data mart or a separate Google Sheet feeding the same Omni asset, so dependencies that normally live in someone's memory become visible in the platform.
Lineage that accounts for observability. Because catalog and observability sit in the same platform, column-level lineage carries anomaly detection along the path. You are not just seeing how data connects, you are seeing where it is at risk.
This is what full end-to-end lineage is supposed to mean. Without a unified platform underneath, the trail keeps breaking at the seams between tools. Matia traces the journey across ingestion, the warehouse, and back out to BI in a single click. That matters more as AI moves into the analytics layer. When an AI tool answers a question off your Omni data, Matia is the foundational infrastructure that put the data there, monitored it for anomalies, and lets you follow that answer back through every step to the source.
How teams are already using it
David Protein, which runs its stack on BigQuery, is an early user of the Omni integration.
"Seeing the lineage connect end to end means when something breaks, we trace it in one place instead of digging across tools. Less complexity, faster debugging, pipelines that are easier to maintain. The Matia and Omni integration ties it together, from the data moving through to the dashboards and semantic layer we build on top of it."
Ari Azbel, Senior Data Analytics Engineer, David Protein
Now available
The Omni integration is available now. If you are already on Matia, connect your Omni workspace from the catalog and your assets will start surfacing automatically, with lineage mapped back through your stack.
Today at Databricks Data and AI Summit 2026, we're announcing a deeper integration between Matia and Databricks Unity Catalog.
If you run Databricks, you already keep a lot of important context in Unity Catalog. Tags that mark sensitive data, descriptions that explain what an asset is for, and the lineage that ties notebooks, jobs, and tables together. That context is valuable, but it lives in Databricks. The rest of your data picture lives somewhere else.
This integration closes that gap. Matia now brings Unity Catalog metadata directly into the Matia Catalog, so your Databricks tags, descriptions, and lineage show up alongside everything else Matia already tracks, in one place. And because that metadata becomes part of Matia's graph, it isn't just visible. It's queryable by an agent, wherever your team works.
Your Databricks context now lives in the Matia Catalog
The integration brings tags and descriptions from Unity Catalog into the Matia Catalog.
Your Unity Catalog asset tags are surfaced in Matia, so the labels you already use to classify and govern data carry over instead of being recreated by hand. Asset descriptions written in Unity Catalog are pulled in too, so the context a teammate added in Databricks is visible to everyone working in Matia.
In other words, the governance work your team already did shows up where the rest of your team can find it, not trapped in a tool only the Databricks admins open.
Matia stitches native Databricks lineage with dbt lineage into one view
Lineage no longer needs to be fragmented. Matia captures native Databricks lineage by querying Unity Catalog system tables, and enriches it by parsing your dbt artifacts. Together they give you a fuller, dbt-aware map of how your Databricks assets connect, in a single view.
That makes it easier to trace where data came from, understand what a change will affect, and triage an issue without hopping between tools.
This deepens an integration that already runs deep
This isn't a standalone bolt-on. It sits on top of the ETL, Reverse ETL, and Observability that Matia already runs alongside Databricks. Teams like Lev use Matia to move data in and out of Databricks, run dbt models, and activate the results in their operational tools, with observability across the whole path.
The Unity Catalog integration adds the governance layer to that same picture. Ingestion, activation, monitoring, and metadata all live together rather than in four disconnected tools. That's the advantage of a unified DataOps platform: your Databricks data doesn't just move through Matia, it's described, monitored, and connected in one place.
The metadata isn't just visible. It's queryable by an agent, wherever you work
Once your Databricks tags, descriptions, and lineage are in Matia, they become part of a graph that Matia's MCP can reason over. That turns metadata from something you look at into something an agent can act on.
Point an agent at it in whatever client your team already uses, and ask the questions that usually take an afternoon of digging:
Trace what depends on a table before you drop it, across tables, columns, dashboards, and the people who rely on it.
Find the root cause behind a wrong number on a dashboard, tracing upstream to the integration or monitor that caused it.
Decide which monitors protect a critical asset, by pointing the agent at the dashboard that matters.
Your metadata stays open to the tools you choose, not locked to one. That means Claude, Cursor, ChatGPT, Slack, or any other MCP-enabled client.
Get started
The Databricks Unity Catalog integration is available now for teams using Matia with Databricks. If you're already connected, your Unity Catalog tags, descriptions, and lineage will start surfacing in the Matia Catalog. If you're at Databricks Data and AI Summit this week, come find us. If you're evaluating Matia, this is a good moment to see what a unified view across your Databricks stack looks like.
And if you're at Databricks Data & AI Summit, stop by to see it in person at booth 525. View the docs here.
If you've spent any time in the data space, you know ETL. It's the backbone of modern data infrastructure, the reason your analytics team can actually answer the question "how are we doing?" without hunting through five different databases. ETL is the OG. Everyone knows it.
But the data stack has gotten more complex, and a new movement has taken hold: Reverse ETL. While ETL moves data into the warehouse, Reverse ETL moves it back out, pushing warehouse data into the tools your business actually runs on. And just like ETL before it, Reverse ETL is quickly becoming something every data team needs to understand.
Here's the thing: modern organizations don't need to choose between ETL and Reverse ETL. They need both. Together, they form the foundation of an analytics-ready, operationally-activated, AI-ready data stack.
What is ETL
ETL stands for Extract, Transform, Load, and it does exactly what the name implies.
Extract: Pull raw data from your source systems.
Transform: Clean, reshape, and standardize it.
Load: Push the processed data into a central destination.
ETL pipelines pull from a wide range of sources:
CRMs, SaaS applications, databases, marketing platforms, product data and funnel everything into a central warehouse like Snowflake, BigQuery, Databricks, or Redshift.
The "why" behind ETL is straightforward: business data lives everywhere, and you can't do much with it when it's scattered. ETL centralizes it so you can actually use it for analytics and reporting, data warehousing, machine learning, and business intelligence. Without ETL, you don't have a data stack. You have a mess.
Why ETL Became Critical
The SaaS explosion of the last decade created a fragmented data landscape. Companies went from running on a handful of core systems to juggling dozens of tools, each with its own data model, schema, and API. Sales data in Salesforce. Marketing data in HubSpot. Product data in your app database. Finance data in NetSuite. And on and on.
ETL became the connective tissue. By pulling all of that data into a single warehouse, data teams could finally build unified reporting, maintain data consistency, establish trusted metrics, and power centralized analytics. The modern cloud data warehouse wouldn't exist without it, and neither would the data teams that run them.
ETL isn't glamorous. But it's fundamental.
What is Reverse ETL?
If ETL is the inbound lane, Reverse ETL is the outbound lane, and it's a newer concept that's gaining serious momentum.
Reverse ETL takes data from your warehouse and moves it back into the operational tools your business runs on, Salesforce, HubSpot, Marketo, Zendesk, support platforms, ad platforms, and more. Instead of analysts pulling reports from the warehouse, the warehouse pushes intelligence directly into the systems where your teams actually work.
Think of it this way: ETL moves data to the warehouse so you can analyze it. Reverse ETL moves data from the warehouse so you can act on it.
Why Reverse ETL Matters
Here's a problem almost every data team knows intimately: your warehouse is full of incredibly valuable data, and almost nobody outside the data team can access it.
Operational teams, including sales, marketing, customer success, support, are working in their own tools, often with incomplete or stale information. The customer health score your data team built? Stuck in Snowflake. The product usage signals that predict churn? Not in Salesforce. The lead enrichment data that would help your SDR team prioritize outreach? Nowhere to be found in HubSpot.
Data gets trapped in the warehouse. Reverse ETL springs it loose.
When warehouse data flows directly into operational systems, teams can act on it in real time. That means:
Customer health scoring surfaced in your CRM, not a dashboard nobody opens
Lead enrichment that makes your sales team smarter before the first call
Product usage syncing that gives customer success the context they need
AI workflows that run on clean, current, warehouse-quality data
Customer personalization at scale, powered by your best data
Reverse ETL doesn't just unlock analytics. It operationalizes the entire data stack.
ETL vs. Reverse ETL: Two Sides of the Same Coin
The core difference is directional:
ETL moves data from source systems into the warehouse.
Reverse ETL moves data from the warehouse into business applications.
But framing this as a competition misses the point. ETL and Reverse ETL are complementary. ETL centralizes and enriches your data. Reverse ETL activates it. You can't have an effective Reverse ETL motion without clean, reliable data in the warehouse, which means you can't skip ETL. And without Reverse ETL, all that carefully centralized data just sits there, accessible only to people who know how to write SQL.
Modern data architectures need both. ETL answers the question "where is our data?" Reverse ETL answers "what are we doing with it?"
The Challenge: Modern Data Stacks Are a Mess
Here's where things get complicated.
As the data stack has matured, so has the tool sprawl. Today, a typical mid-market data team might be running separate vendors for ETL, Reverse ETL, observability, orchestration, and cataloging. According to Enterprise Strategy Group, nearly half of companies at mid-market scale and above are using 26 or more data vendors.
Every tool has its own setup, its own integrations, its own alerts, its own pricing. And none of them talk to each other particularly well. When something breaks – and something always breaks, you're debugging across multiple platforms, correlating logs from different systems, and trying to figure out whether the problem is in the ingestion layer, the transformation, or the sync downstream.
The operational complexity is real. And it compounds. More tools means more surface area for failures, more vendor relationships to manage, more onboarding time for new engineers, and more budget consumed on infrastructure rather than insight.
The Rise of Unified DataOps
The data teams that are winning right now aren't just adding more tools. They're consolidating.
The smartest engineering and data leaders are looking for platforms that unify the core functions of the data stack, reliable ETL, integrated Reverse ETL, observability, governance, and cataloging, without sacrificing the developer control and flexibility they need to operate at scale.
And with AI reshaping everything, the stakes are higher than ever. AI requires large volumes of high-quality data. It demands clean lineage, strong governance, and infrastructure that can support dynamic updates and real-time streams. Fragmented data stacks can't keep up. Unified ones can.
The future of data infrastructure isn't more tools doing more things in isolation. It's fewer, better tools working together, so your data is reliable at ingestion, observable throughout its journey, and activated across every system that needs it.
The Bottom Line
ETL is still the base. Without it, you don't have a warehouse worth working with.
Reverse ETL operationalizes that warehouse, taking your best data and putting it to work in the tools your business runs on every day.
Together, they form the backbone of a modern, operational data stack. And as AI becomes central to how businesses make decisions, reliable data movement in both directions isn't a nice-to-have. It's a requirement.
The future is reliable. Operational. AI ready. And it moves data in both directions.
More and more teams are standardizing on Snowflake as the foundation for analytics and AI. And once you've done that, the next instinct is sensible: stop juggling a dozen point solutions and consolidate the systems that move, monitor, and activate your data.
Being on Snowflake Marketplace removes the friction from that journey. Instead of standing up four separate tools through four separate procurement cycles, you get unified ETL, observability, reverse ETL, and catalog running in a fraction of the time, with the same trust and governance you already rely on in Snowflake.
In other words: the tool your data team picked in May can actually ship in May.
Better together: Matia + Snowflake
Here's what the partnership unlocks for joint customers:
Streamline the stack. Replace fragmented point solutions with a single platform that runs ETL, observability, catalog, and reverse ETL on top of Snowflake.
Get AI-ready, faster. Trusted, well-governed data with end-to-end lineage, purpose-built for Snowflake Cortex AI and the applications built on it.
Spend less. Customers consolidating onto Matia report up to 61% lower data infrastructure spend compared to maintaining separate tools.
Skip the procurement marathon. Streamlined deployment through Snowflake Marketplace for new and existing Snowflake customers alike.
As our co-founder and CEO Benjamin Segal put it:
"Snowflake is the center of gravity for modern data teams, and customers have been asking for the simplest possible path to run Matia right alongside it. Joint customers can now stand up unified ETL, observability, reverse ETL, and catalog in a fraction of the time, with the trust and governance they already count on in Snowflake."
Speaking of unified foundations…
If "give your data the full picture" sounds familiar, that's because we are on a roll this week. Just yesterday we shared Matia MCP, now in private preview: the fastest path from a data question to an answer, built on the same unified foundation that makes a launch like this possible. The theme is consistent: less tool sprawl, more trust, and a data stack that works with your AI instead of tripping over it.
Trusted by teams who don't have time for tool sprawl
Matia already runs data operations at scale for teams at Ramp, Drata, Honeybook, and Lemonade. This Marketplace listing builds on our mission to unify the modern data stack, helping teams streamline their tools, accelerate collaboration, and operate data systems with the same reliability you'd expect of any modern production infrastructure.
Snowflake Marketplace, for its part, helps companies expand what's possible with data and AI through third-party data, apps, and AI products. With on-platform purchasing and immediate access, it lowers integration costs and streamlines procurement, delivering products directly to the customer's data. You can learn more about finding, trying, and buying third-party products here.
Heading to Snowflake Summit? Stop by Booth 1603 to see the platform firsthand and explore the latest in unified ETL, reverse ETL, observability, and catalog.
You can also catch Snowflake Summit 2026 keynotes live or on-demand here, and follow the latest from Snowflake on LinkedIn and X.
Want to see what unified data operations looks like on top of Snowflake? Book a demo and we'll show you.
Today, kicking off Snowflake Summit, we're announcing that Matia MCP is in private preview.
If you've been following the data infrastructure space for the last year, you've watched a wave of MCP server announcements. Catalog vendors, observability platforms, warehouses, BI tools — most of the data stack now exposes an MCP server so AI agents can reach in and pull context.
That's a real shift. AI assistants that used to generate SQL and explain concepts can now actually act on your data stack. We think that's a good thing.
But we've also watched the limits of that approach become clear. And the reason we built Matia MCP the way we did has everything to do with what those limits are.
The problem with stitching context together
Most MCPs do something useful but narrow: they reconcile what your data tools expose through their APIs. The visible layer. The records, the metrics, the dashboards.
The challenge is that the failures that cost data teams the most don't always live at that visible layer. When a pipeline breaks mid-run, the API tells you it failed. It can't always tell you where it failed, what made it through, or what didn't. When a column changes silently between syncs, the dashboard tells you the number is off. It can't tell you why.
Agents can compensate for this by calling multiple MCPs in sequence. Pull metadata from the catalog, then alerts from observability, then query history from the warehouse, then dashboard dependencies from BI, then stitch it all together to form a working theory of what happened.
That works, in a limited way. But every added MCP burns more tokens, takes more time, and introduces more room for error. And the stitching itself is exactly the kind of multi-step reasoning current models are still unreliable at, especially under latency and context pressure.
This is the problem we set out to solve when we started Matia, well before MCP existed.
That wasn't a marketing decision. It was an engineering one. When you build these four functions as separate tools and try to stitch them together later, what you get is a partial picture. Schema changes don't reach lineage. Monitor failures don't connect to integration health. Catalog ownership doesn't connect to BI consumers. The data team ends up doing the stitching by hand, in Slack threads and Looms and runbooks.
When all four are unified, something different becomes possible. Pipelines, lineage, monitors, modeled data, and BI consumers exist in one connected graph. Every asset knows its upstream sources, its downstream consumers, and its operational state. The graph is the platform.
That's the foundation Matia MCP exposes.
What this means for your agent
When your AI agent calls Matia MCP, it isn't pulling one slice of context and asking for more. It's getting a connected view across the stack in a single response.
A few examples of what that looks like in practice:
A bad number on a dashboard. Matia traces upstream and surfaces the failing monitor or integration behind it, with investigation context inline.
A failing integration. Ask the agent what broke. Matia returns the root cause and the full downstream impact — affected models, dashboards, and consumers — in one answer.
A table deprecation. Ask which queries, dashboards, and people depend on a table before you drop it. Matia traces impact all the way through to the Tableau view.
In our testing, workflows that took an agent ten or more tool calls against single-vendor MCPs now take one or two against Matia. Fewer tokens. Sharper answers.
What's in the private preview
We're opening Matia MCP to a small group of customers and design partners first, so we can validate quality on real workflows before opening it more broadly.
The preview includes:
A standalone MCP server compatible with Claude, Cursor, ChatGPT, and other MCP-enabled clients
Slack as a supported surface
Production safety primitives: request auditing, sensitive-data redaction, scoped permissions, and governed write access
A few of the use cases we're working through with early preview teams:
Triaging a failed pipeline end-to-end, including identifying who to notify downstream
Mapping deprecation impact from a table all the way to the Tableau view
Diagnosing a bad number on a dashboard back to the failing monitor or integration
Resetting false-positive monitor baselines with investigation context surfaced inline
Cross-stack root cause analysis combining Matia MCP with Snowflake's MCP for workflows that span metadata and live data
We're also actively exploring how Matia MCP works alongside Snowflake's MCP for workflows that require both governed metadata and live query results. If you're at Snowflake Summit, we'll be demoing this live at booth 1603.
And if you're at Snowflake Summit this week, come find us at booth 1603. We'll be running the agent live on a real data stack and answering questions about how we built it.
This is a moment we've been working toward since we started Matia. We built a unified platform so that data teams could finally have one connected view of their stack. Now AI agents can have that same view. We can't wait to see what your team does with it.
Most teams assume AI failures happen because the models are bad.
In reality, the problem usually starts much earlier, with the data itself.
That was one of the biggest themes from Matia’s recent webinar with Nathan Loding, Data Advocate at Matia, and Matthew Shump, Head of Data & Analytics at Drata. The conversation focused on a growing challenge facing modern data teams: pipelines may look healthy on the surface, while quietly delivering stale, incomplete, or corrupted data into downstream AI systems.
And when that happens, the outputs can look correct while being fundamentally wrong.
The Problem with “Green” Pipelines
One of the most important points discussed during the webinar was the difference between a pipeline that is operational and a pipeline that is trustworthy.
Many organizations monitor whether jobs are completed successfully. But success states alone don’t guarantee data quality, freshness, or reliability. A pipeline can technically “run” while still introducing silent issues downstream:
Schema changes that quietly break transformations
Delayed or stale data feeding dashboards and AI models
Duplicate or incomplete records
Context loss across systems
Failures that don’t surface until business decisions are already affected
This becomes especially dangerous in AI workflows, where systems consume and act on data automatically at scale.
As AI adoption accelerates, the cost of these hidden failures grows significantly. Teams aren’t just powering dashboards anymore: they’re feeding data directly into operational systems, decision engines, copilots, and AI driven workflows.
Why Observability Alone Isn’t Enough
Another major theme from the discussion was the idea that modern data stacks have become increasingly fragmented.
Over the last decade, teams adopted separate tools for ETL, orchestration, observability, governance, activation, and transformation. While each category solves a specific problem, the result is often a disconnected ecosystem where teams lack complete visibility into how data moves, changes, and impacts downstream systems.
The webinar explored how observability needs to evolve beyond simple alerting.
It’s no longer enough to know that a pipeline failed. Teams need context around:
What changed
Which downstream systems are affected
Whether data freshness has degraded
How schema drift impacts AI outputs
Where trust in the data begins to break down
This is especially critical as organizations begin operationalizing AI across the business.
Drata’s Perspective on Reliable Data Operations
Matthew Shump shared insights into how Drata approaches reliability and operational trust within modern data systems.
One of the key takeaways was that reliability isn’t something added later, it has to be designed into the workflow itself. As data systems scale, small inconsistencies compound quickly, particularly when multiple downstream teams and AI systems rely on the same datasets.
The discussion emphasized the importance of:
Monitoring freshness and schema changes proactively
Building systems that surface issues before they become business problems
Creating visibility across the entire data lifecycle
Reducing operational complexity while maintaining trust
Rather than treating data quality as a reactive exercise, leading teams are moving toward more continuous, context aware approaches to reliability.
AI Raises the Stakes for Data Teams
Perhaps the clearest message from the webinar was this:
AI increases the importance of reliable data infrastructure.
When humans consume bad data, they may eventually spot inconsistencies. AI systems often do not. They continue producing outputs confidently, even when the underlying data is flawed.
That creates a new operational challenge for modern data teams.
The future of AI readiness is not simply about deploying more models. It’s about ensuring the systems feeding those models are observable, trustworthy, and resilient enough to support production scale decision making.
As organizations continue investing heavily in AI initiatives, the teams that succeed will likely be the ones that solve the foundational reliability problem first.
Watch the on demand webinar featuring Nathan Loding from Matia and Matthew Shump from Drata to learn more about silent data failures, AI readiness, and the future of reliable data systems.
The Summer G2 reports are out, and Matia was featured in 29 reports this season, with Matia clenching six #1 spots.
Most notably, Matia took the #1 spot on the Momentum Grid for ETL Tools, tying with Databricks for the highest cumulative score in the category. Matia also took home #1 on the Usability and Results Indexes for Reverse ETL as well as the Mid-Market Results Index for Data Extraction.
For context, G2's Momentum Grid measures growth: how fast a product is gaining traction, satisfaction, and market presence relative to the rest of the category. Sharing the top spot in ETL with one of the most established names in data, in the same quarter, is a strong signal of where the market is moving and how quickly Matia is moving with it.
What we earned this season
Alongside the Momentum results, Matia was recognized as a High Performer across five categories that span the full surface area of what we do:
That spread matters more to us than any single badge. Most platforms in this space do one of these things well. Matia is built to do all of them on a single foundation, covering ingestion, replication, reverse ETL, and observability, so data teams aren't stitching together four vendors and four contracts to move data from source to destination and back, with confidence that it arrived intact.
Why momentum, specifically
Momentum is the metric we watch most closely because it's forward-looking. Grid leadership reflects who's biggest today. Momentum reflects who customers are choosing now and how quickly those customers are succeeding. Tying with Databricks on the ETL Momentum Grid says something specific: data teams evaluating modern ETL aren't just defaulting to incumbents anymore. They're picking platforms that ship faster, integrate the rest of the stack, and don't make them choose between flexibility and reliability.
This is also the second quarter in a row that our G2 footprint has grown. In Spring 2026 we earned 34 badges across 27 reports, including our first recognition in Data Observability. Summer's results, including the #1 Momentum result in ETL, show that growth compounding.
Thank you
Every G2 result is built on verified customer reviews from actual data engineers, analytics leaders, and platform teams taking the time to write about their experience. We read every one of them, and they shape what we build next.
If you're a Matia customer and you haven't shared your experience yet, we'd love to hear it. And if you're evaluating a unified data platform and want to see what's behind the badges, get in touch. We'd be glad to show you.
You've built the stack. You've got the warehouse, the pipelines, the models. So why isn't the AI delivering?
Every data team we talk to has the same story. The pipelines are running. The dashboards are green. And yet, when they put AI to work, the outputs are unreliable, the insights are off, or the whole thing quietly falls apart in production.
The instinct is to blame the model. But here's what's actually happening:
AI fails because of data, not because of models.
The Myth of the "Working" Pipeline: A pipeline that's running isn't the same as a pipeline that's trustworthy. Data can be moving on schedule and still be stale by the time a model consumes it. Schema changes can silently corrupt downstream tables for days. Duplicate records and inconsistent field definitions don't announce themselves—they just make your AI outputs subtly wrong in ways that are hard to trace.
This is what we call silent data failures. No alert, no error message. Just a slow erosion of trust in the outputs your AI is producing.
What AI Actually Needs
For AI to work reliably, your data stack needs to guarantee freshness, context, consistency, and visibility—simultaneously. Most modern stacks are good at moving data. They're not yet good at guaranteeing all four. That gap is exactly where AI initiatives break down.
On Wednesday, May 27, Matthew Shump, Head of Data & Analytics at Drata, and Nathan Loding (Data Advocate at Matia) will walk through the most common gaps in modern data systems, and what it actually takes to fix them.
Matthew will share how Drata uses Matia to monitor data freshness, detect schema changes, and track pipeline health so their AI outputs stay trustworthy.
You'll walk away understanding:
Why well-architected pipelines can still undermine AI reliability
How silent failures go undetected until they've already done damage
What an AI-ready data stack looks like in practice
I keep getting asked the same question: is AI going to replace ETL platforms?
The short answer is no. The longer answer is that AI is exposing how outdated most ETL platforms actually are, and forcing the entire category to evolve or become irrelevant. This was originally going to be a LinkedIn post, but I realized I had way too much to say about this topic.
The problem is getting worse, not better
According to a recent MIT Technology Review survey of 400 senior tech executives, 77% say their data engineering teams' workloads are getting heavier despite deploying AI tools. Gartner estimates poor data quality still costs organizations an average of $12.9 million per year.
Teams are adding more tools and spending more money. The problem keeps growing. That should tell us something.
Where AI actually helps
AI is solving real problems in data engineering. Schema mapping that used to take weeks now takes days. Pipelines can detect anomalies and self-correct. Natural language interfaces let analysts self-serve instead of filing tickets and waiting. AI can write a script, generate SQL, build dbt models, and debug transformation logic faster than any human.
But the pipeline itself still needs to run deterministically. Filtering records, joining tables, running calculations. These need to produce the exact same result every time. The value of AI is in building and maintaining that logic faster. The value of the platform is making sure it executes reliably.
"Why not just run Claude Code on open-source tools?"
This is the other question I keep hearing. And it's a fair one. Teams are already using AI agents to debug Airflow DAGs, fix broken dbt models, and investigate data quality issues.
But there's a meaningful gap between "AI can fix a pipeline when you point it at one" and "AI can run your data infrastructure." Who's monitoring at 3am? Who handles schema drift automatically across hundreds of connectors? Who owns lineage at scale?
The connectors themselves are becoming table stakes. The real value is in operational reliability. And that's still platform territory.
That said, I've seen some awesome implementations of open source tools with Claude running maintenance and self-healing pipelines. It's impressive, and it's only going to get better. Our goal with Matia is to run alongside these, not compete with them.
The market is shifting fast
Look at what's happened in just the last two years. Salesforce acquired Informatica. Qlik absorbed Talend. Fivetran and dbt merged. A number of smaller catalog and observability players have been gobbled up by larger companies. That's a market screaming for consolidation and unification.
Open table formats like Apache Iceberg are accelerating this. When your data lives in open, engine-agnostic formats, you're no longer locked into one vendor's view of your ecosystem. A platform built on that foundation can provide true unified context, lineage, schemas, dependencies, across everything. And that's the context AI needs to be genuinely useful.
Unification matters more than people realize. AI needs context to work. An agent can fix a broken pipeline, but without visibility into the full data ecosystem, it's working blind. It doesn't know what's connected to what, what depends on what, or what breaks downstream when something changes upstream. A unified platform provides that context. It knows the lineage, the schemas, the dependencies, the schedules. That's what makes AI actually useful at scale, not just another tool duct-taped to the side.
The platforms that win won't be the ones that just bolted an AI assistant onto the sidebar. They'll be the ones that can handle the full breadth of modern data needs: real-time streaming, unstructured data, integration with LLM and RAG architectures, and expanding connector ecosystems that keep pace with how fast teams adopt new tools.
And they still need to do the "boring" stuff reliably. Move data from point A to point B. Clean it up. Land it somewhere useful. Every time, without fail.
The question was never really "will AI replace ETL platforms."
It's which platforms are built for what data engineering actually looks like now and in the future.
Today, Matia was recognized as one of Tomorrow’s Growth Companies by Qumra Capital. This recognition highlights some of the most promising growth stage technology companies emerging from Israel’s tech ecosystem, and we’re honored to be included alongside so many impactful teams shaping the future of enterprise technology.
The rise of AI is changing the role data infrastructure plays inside organizations. Data pipelines don’t just power dashboards and reporting-they drive applications, business operations, customer experiences, and increasingly, AI powered workflows and automated decision making systems. But as organizations scale their AI initiatives, they are also discovering a growing challenge: modern data stacks remain fragmented.
Teams usually manage separate tools for ETL, reverse ETL, observability, and catalog. As the complexity of this grows, issues like stale data, schema drift, missing records, and silent pipeline failures become harder to detect, especially when AI systems are consuming that data and making decisions on this downstream.
At Matia, we believe the next generation of data infrastructure needs to be unified, observable, and AI ready by design. We are collapsing the data stack.
That’s why we’re building a Unified DataOps platform that helps organizations move, manage, and monitor data from a single foundation.
Why This Recognition Matters
Being recognized by Qumra Capital as a “Tomorrow’s Growth Company” is meaningful because it reflects not only our momentum as a company, but also the growing demand we’re seeing across the market.
Organizations are rethinking how modern data systems should work in the AI era. Reliability, observability, and operational simplicity are no longer optional they are foundational requirement as we deploy AI successfully at scale.
Over the past year, we’ve 10x’d our growth and had the opportunity to work with innovative companies building modern, AI driven data systems, and we’re incredibly grateful to our customers, partners, investors, and team for helping drive this journey forward.
Looking Ahead
We’re excited to participate in Mind the Tech NYC and continue conversations with technology leaders, investors, and builders about the future of AI ready data infrastructure.
Most importantly, Matia is just getting started. With our recent closing of series A funding, our team in both Israel and the USA are accelerating product innovation, expanding our go to market efforts, and continuing to build the unified DataOps platform for the AI era.
Thank you to everyone who has supported Matia along the way! We look forward to sharing what’s next!
Read the full article in Calcalist and if this sounds appealing (and it should), we’re hiring.
BigQuery is where many enterprise data teams run their warehouse. Matia is the control plane around it: ingesting data into BigQuery, observing every table, cataloging the estate, and activating warehouse-modeled data out to the operational tools your teams rely on. Today's release deepens three of those layers in direct response to enterprise customer demand. Observability coverage expands across BigQuery workloads, spanning auto-generated monitors, ML Monitors, custom monitors, custom SQL, and schema change tracking. Salesforce Formulas, a big pain point many teams face when ETLing data, now can move seamlessly into BigQuery. And BigQuery is now available as a Reverse ETL source. Both land on the same shift-left foundation: catch data and pipeline issues at the BigQuery workload itself, before they cascade into broken dashboards, bad ML inputs, or silent downstream failures. Here's what's new.
Expanded Observability for BigQuery
BigQuery customers now get the full set of Matia monitor types, covering data quality, profiling, freshness, schema, and query performance in one place. Every monitor runs against the BigQuery workload directly, keeping data quality checks close to the source.
Auto-Generated Monitors
Matia automatically generates monitors on your BigQuery tables as they're discovered, measuring freshness to surface delays and gaps, and tracking row counts to catch unexpected swings. No manual setup required.
ML Monitors
Profile your BigQuery data on a schedule to track trends and flag anomalies automatically. ML Monitors baseline normal behavior for a metric and alert when values drift outside the expected range, catching data quality issues that fixed thresholds would miss.
Custom Monitors
Configure monitors on BigQuery tables to match the accuracy and reliability standards that matter most to your business. Set your own thresholds, cadences, and alert rules on the metrics your team cares about.
Custom SQL Monitors
For checks auto-generated and custom monitors can't express, write your own in SQL. Custom SQL monitors run on your schedule against BigQuery and alert when the query returns unexpected results, ideal for business logic validation and bespoke data quality rules.
Schema Change Monitoring
Detect column additions, deletions, and type changes on BigQuery tables so your team can react before upstream schema drift breaks downstream pipelines, dashboards, and ML models.
BigQuery Now Supports Salesforce Formulas
BigQuery's new Salesforce formula support works by retrieving formula expressions directly from Salesforce object metadata via the Describe API, parsing each expression, and translating it into equivalent BigQuery SQL.
The result is a generated table with formulas in native SQL - the base table with the translated formula expressions, giving you the ability to calculate the fields as a view alongside your raw data. This means formulas involving logic, text manipulation, math, date operations, and even cross-object references through relationship traversals can be evaluated natively in BigQuery, keeping your analytics layer in sync with how your team has modeled the data in Salesforce.
BigQuery Is Now a Reverse ETL Source
BigQuery is now a native source for Matia's Reverse ETL capabilities.. Activate your warehouse-modeled data in the operational tools your GTM, product, and support teams live in, without routing through another system first. It's the same control plane that handles ingestion, observability, and catalog, now closing the loop back out to your stack.
Incremental Sync Support
Move only what changed. Incremental sync watches your BigQuery tables for new and updated rows by reading the journal of row-level changes - inserts, updates, and deletes - that have occurred since the last sync. Only those changes are fetched and pushed to your downstream destinations, giving you faster syncs, lower compute spend, and fresher data in the tools that matter.
BigQuery customers no longer have to stitch together a separate tool for each layer of the lifecycle. Matia ingests into BigQuery, observes every table, catalogs the estate, and now activates warehouse-modeled data out to your operational stack, on one platform with one SLA. And because every layer sits close to the BigQuery workload, data quality, freshness, schema, and performance issues get caught at the source, before they reach Looker dashboards, ML models, and GTM tools that depend on them.
Getting data into the new system is not the end of migration, it’s the beginning of a more complex phase. Once pipelines are live, teams must operate legacy and modern systems in parallel, validate outputs continuously, and manage growing operational complexity. This is where many migrations start to struggle—not because the data wasn’t moved, but because the system isn’t yet stable, observable, or optimized.
In Part 3, we focus on what comes after cutover: managing dual-system operations, preventing data drift, reducing tool fragmentation, and using unified DataOps to maintain control. We also cover how to optimize performance, cost, and reliability so the new platform delivers real value.
The Dual-System Operations Problem
The dual-write problem occurs when a system needs to update two separate systems as part of a single operation, but cannot guarantee that both updates will succeed or fail together due to the lack of atomic transactions in distributed environments. As a result, if one write succeeds and the other fails, the systems become inconsistent. For example, in an e-commerce application, when a user places an order, the system may need to both save the order in a database and send an event to a messaging system (like Kafka) to trigger downstream processes such as notifications or shipping. If the database update succeeds but the event fails to publish, the order exists in the system, but no downstream actions are triggered—leaving the system in a partial and unreliable state.
So there is data drift between source and destination systems, and to solve this one cloud try patterns like:
Retry Mechanisms + Idempotency: Separate the two writes and ensure the second write is retried until it succeeds. By making operations idempotent, repeated retries do not create duplicates or corrupt data, ensuring eventual consistency without side effects.
Transactional Outbox Pattern: Write the primary change and an “event” record to an outbox table within the same database transaction, then use a separate process (or CDC) to reliably publish that event to downstream systems like Kafka, retrying until successful.
Event Sourcing (with CDC): Treat every change as an event stored in the database, and use CDC tools (e.g., Debezium) to stream those changes to other systems. This ensures that updates propagate automatically without requiring a second direct write.
But they introduce another layer of complexity, one that teams must now operate, monitor, and debug continuously. Matia centralizes ingestion, orchestration, and monitoring, allowing teams to manage dependencies between systems in one place, track data flow end-to-end, and validate consistency without duplicating logic across multiple tools.
Tool Sprawl and Fragmentation
Tool sprawl and fragmentation happen when organizations assemble their data stack one point solution at a time, adding separate tools for ingestion, orchestration, transformation, observability, and governance without a unifying operating layer.
What begins as flexibility quickly becomes dependency: every new tool introduces another integration surface, another set of alerts, and another version of the truth. The result is not a modern stack, but a fragmented one, where engineers spend more time switching between platforms, debugging compatibility issues, and manually tracing lineage than delivering business value.
The key to avoiding tool sprawl is:
Prioritize platform vendors over point solutions: distinguishing between vendors who create dependencies and those who reduce them by prioritizing platform vendors over point solutions
Integrate multiple capabilities into one cohesive environment because this reduces integration complexity while still preserving portability at the architectural level.
Reduce integration complexity: while keeping architecture portable (avoiding lock-in)
Implement unified observability: centralized visibility, integrated lineage, and observability that shows how pipelines, transformations, and downstream dependencies behave together.
Matia fit this model by consolidating ingestion, observability, cataloging, and lineage into a single platform, giving teams one place to monitor pipeline health, trace data flows, and validate changes across systems instead of stitching context together across disconnected tools. Matia specifically positions this as a unified DataOps platform, with built-in observability, data catalog capabilities, and end-to-end lineage captured across ingestion, models, and pipelines, helping teams reduce operational fragmentation and manage the stack with more clarity and control.
Migration-Specific Operations Challenges
Data migration creates unique operational burdens because teams must maintain data reliability while the underlying architecture actively changes. The real challenge isn't just moving data—it's maintaining consistency, visibility, and control across parallel environments while managing the human and organizational complexity that comes with running dual systems.
Dual Validation Burden: Every pipeline change must be validated in both legacy and modern systems for technical correctness *and* business accuracy. This doubles testing effort and extends migration timelines.
Data Drift Between Systems: Legacy and destination systems gradually fall out of sync due to timing differences, failed writes, or transformation logic mismatches. Without continuous reconciliation, teams lose confidence in which system represents truth.
Pipeline Latency and Scheduling Conflicts: Running dual pipelines creates resource contention, delayed jobs, and freshness gaps. Business users see conflicting numbers depending on which system their report queries.
Broken Downstream Dependencies: Changes made during migration—renamed fields, restructured tables, deprecated endpoints—cascade unpredictably to downstream dashboards, ML models, and third-party integrations.
Visibility Gaps Across Hybrid Architectures: As systems evolve, teams struggle to maintain end-to-end observability. Legacy monitoring tools don't cover new infrastructure, and modern observability platforms lack visibility into legacy systems, creating blind spots.
Rollback Complexity: When issues arise, rolling back becomes nearly impossible without risking data loss or extended downtime. The dual-system state makes it unclear which version to trust.
Compliance and Audit Trail Fragmentation: Regulatory requirements demand clear data lineage and change tracking, but migrations fragment audit trails across multiple systems, making compliance verification difficult.
Team and Organizational Challenges:
Knowledge Silos and Succession Risk: Legacy system expertise resides with a few senior engineers, while new platform knowledge sits with recent hires or external consultants. This creates bottlenecks and dangerous single points of failure. When key people leave or are unavailable, migrations stall.
Distributed Ownership and Accountability Gaps: During migration, responsibility blurs. Is the data engineering team responsible for both systems? Does the migration team own consistency checks? Who handles downstream breakages discovered weeks after a cutover? Unclear ownership leads to finger-pointing and delayed incident resolution.
Communication Breakdowns Across Stakeholders: Business stakeholders, data consumers, and engineering teams operate with different timelines and priorities. Business users don't understand why "the same report" needs rebuilding. Engineers underestimate downstream dependencies. Misalignment leads to surprise disruptions and eroded trust.
The Case for Unified DataOps
Data migrations fail not because teams lack technical capability, but because the operational complexity of managing dual systems overwhelms fragmented tooling. Unified DataOps addresses this by consolidating critical capabilities—orchestration, observability, validation, and governance—into a cohesive platform that treats migration as an end-to-end operational challenge rather than a collection of isolated technical tasks.
What is Unified DataOps?
Unified DataOps is an operational framework that integrates data engineering, quality assurance, observability, and governance into a single platform to improve the speed, reliability, and collaboration of data workflows. Unlike traditional approaches where teams assemble separate point solutions for each capability, unified DataOps provides:
Centralized orchestration across ingestion, transformation, and validation workflows
End-to-end observability with integrated lineage, data quality monitoring, and alerting
Collaborative development where engineers, analysts, and stakeholders work from shared context
Automated governance that enforces policies without slowing development velocity
Unified DataOps for Migration Success
During migration, unified DataOps transforms operational chaos into manageable workflows by addressing the three core challenges that derail most migrations:
Dual-System Visibility: Traditional monitoring tools show either legacy or modern infrastructure—never both simultaneously. Unified DataOps provides a single pane of glass where teams see data flowing through both systems, compare outputs in real-time, and identify drift before it impacts business users.
Validation at Scale: Migrations require constant validation: schema compatibility checks, data reconciliation, business logic verification, and downstream impact analysis. Unified platforms automate these checks as first-class workflows rather than forcing teams to build custom scripts in multiple languages across different tools.
Coordinated Cutover Management: The riskiest moment in any migration is cutover—switching production traffic from legacy to modern systems. Unified DataOps orchestrates this transition: gradual traffic shifting, automated rollback triggers, parallel running for validation periods, and centralized incident response when issues arise.
Core Capabilities of DataOps for Migration Scenarios
Effective unified DataOps platforms provide capabilities specifically designed for migration complexity:
Data pipeline orchestration: Automates, coordinates and monitors existing and new data pipelines from a single integrated platform simplifying the management of end-to-end data flow complexity through a common control plane.
Data pipeline Observability: keep an eye on data pipelines to detect issues, monitor performance, track data flow, and flag anomalies using real-time and historical data.
ELT: Modern cloud data warehouses enable data to be transformed after loading through the extract, load, transform (ELT) process. ELT speeds DataOps because it allows data to be loaded to the final destination system rather than first passing through staging. With a modern data platform, data can be transformed within the platform itself rather than extracting it to transform it off-platform. This reduces latency and increases agility, enabling faster time to insight.
Environment Management: reduce manual setup by using templates and automation to manage development, testing, and production environments. This covers infrastructure-as-code (IaC), resource provisioning, and credential management to ensure each pipeline runs the same way across every stage.
Agility and CI/CD: manage version control, DevOps integration, pipeline releases, and approvals to make it easier to update and roll out changes using agile CI/CD (continuous improvement / continuous delivery) practices.
Test Automation: runs test versions of pipelines to check for errors. It validates business rules, manages test scripts, and ensures data quality before moving to production.
Collaboration and self-service: Using a cloud data platform that enables users and teams to collaborate using self-service data results in faster development and more-comprehensive finished data products.
DataOps Tools and Platforms
The DataOps tools market experienced significant growth in 2024, expanding by 21% to reach $424 million according to Gartner's Market Share Analysis for Data Management Software. This growth rate substantially outpaced the overall data management software market, which grew at only 9% during the same period. Gartner projects this momentum will continue over the next one to two years as organizations increasingly require cross-platform data orchestration and observability capabilities to manage complex, distributed data architectures.
Here are some popular DataOps Tools and Platforms:
Vendor
Platform Name
DataOps Category
Geographic Presence
About
Matia
Matia DataOps
Generalist (Unified DataOps)
All regions
Unified DataOps platform specifically designed for migration scenarios and dual-system operations.
Prefect
Prefect Cloud
Orchestrator
Americas, EMEA, APAC
Prefect Cloud is primarily a data pipeline orchestration tool. It orchestrates pipelines built in Databricks, Snowpipe, dbt, and Fivetran, etc.
Dagster Labs
Dagster+
Orchestrator
North America, Europe, APAC
Asset-based orchestration platform that treats data as first-class software artifacts. Focuses on software-defined assets (SDAs) with built-in testing, type checking, and data quality validation.
Google Cloud Composer
Orchestrator
All regions
Google's managed Apache Airflow offering built on Google Cloud Platform. Provides seamless integration with BigQuery, Cloud Storage, and other GCP services.
Amazon MWAA is a managed orchestration service for Apache Airflow that allows data engineers to execute data processing workflows in the cloud.
Astronomer
Astronomer Astro
Orchestrator
All regions
Astronomer Astro delivers a fully managed Apache Airflow service with day zero support for the latest version of Airflow, DAG versioning, GitHub integration, remote execution, inplace upgrades, and deployment rollbacks.
Ascend.io
Data Automation Cloud
Generalist
North America, Europe, APAC
Ascend’s platform provides pipeline ingestion, transformation, orchestration, and observability capabilities, including DAG traversal, multi-DAG links with workflow dependency.
IBM
watsonx.data intelligence
Generalist
All regions
Enterprise-grade data and AI platform that combines data management, governance, and analytics capabilities.
When evaluating DataOps platforms, prioritize tools that match your migration complexity and organizational maturity:
Unified Cross-System Operations: orchestrate, observe, and automate across siloed environments, enabling consistent monitoring, implementation, and governance. Ensure unified dashboards for lineage, SLAs, and health check.
AI-Augmented Capabilities: Evaluate AI-assisted DataOps tools for their ability to accelerate workflow integration, task automation, and pipeline reliability. Look for embedded AI and agentic features such as autonomous monitoring, anomaly detection, and optimization recommendations, along with NLP interfaces to minimize manual effort.
DevOps-Ready Infrastructure: Prioritize solutions that support CI/CD pipelines, environment management, and end-to-end observability to reduce deployment friction.
Match Tools to Organizational Maturity: For early-stage teams or traditional batch ETL workloads, focus on platforms with strong orchestration and test automation fundamentals. Advanced teams pursuing real-time analytics or AI-driven data products should evaluate platforms with streaming support, semantic layer integration, and ML lifecycle management alongside DataOps capabilities.
The right platform reduces tool sprawl while providing the flexibility to evolve as your data architecture matures.
Post-Migration Optimization
Migration doesn't end at cutover—it enters a make-or-break optimization phase that determines whether your new system delivers promised value or becomes an expensive disappointment.
Performance Tuning
Real production workloads expose bottlenecks testing never revealed. Establish baseline metrics immediately after cutover and compare against legacy performance and migration goals. Modern cloud platforms require different optimization strategies—what worked as indexed tables in Oracle may perform better clustered in Snowflake or partitioned in BigQuery. Profile slow queries, eliminate resource contention in pipeline schedules, and implement caching for frequently accessed datasets based on actual usage patterns, not assumptions.
Cost Optimization
Cloud platforms charge for compute, storage, and data transfer in ways teams don't anticipate, making cost control essential to ROI. Implement granular cost tracking to identify the 20% of pipelines consuming 80% of budget. Move infrequent data to cheaper storage tiers, right-size over-provisioned warehouses, and eliminate duplicate datasets created as migration hedges. Educate users that poorly written queries scanning entire tables can cost thousands—then implement guardrails that alert when queries exceed thresholds.
Continuous Validation and Quality
Post-migration validation evolves from migration-specific reconciliation to comprehensive quality monitoring. Shift from full data comparisons to statistical sampling as confidence builds, then implement anomaly detection that catches drift rule-based checks miss. Define SLAs for freshness, completeness, and accuracy, and validate that business metrics match expected ranges before stakeholders lose trust. Create feedback loops where production issues inform upstream improvements.
Documentation and Knowledge Transfer
Knowledge trapped in engineers' heads becomes a critical risk when people leave. Document architecture decisions with context about trade-offs and constraints that influenced design. Create executable runbooks for common incidents, build data catalogs where technical and business context live together, and conduct hands-on knowledge transfer sessions while details are fresh. Establish explicit transition points where migration teams hand off to operations with shadow periods—not abrupt handoffs that strand operational teams with unfamiliar systems.
Common Pitfalls and How to Avoid Them
Even well-resourced migrations fail when teams fall into predictable traps. Here are the most common pitfalls and how to avoid them:
Planning and Scoping Pitfalls
1. Underestimating Hidden Dependencies
Teams map obvious pipelines but miss the Excel macros pulling from production databases, the legacy scripts running on someone's desktop, and the third-party integrations no one documented. These surface during cutover when critical reports break.
How to Avoid It: Conduct comprehensive discovery by analyzing database query logs, interviewing power users, and mapping all data consumers—not just the ones engineering knows about.
2. The "Lift-and-Shift" Trap:
Replicating legacy architecture in modern platforms wastes the migration's potential. Teams rebuild the same monolithic pipelines, complex stored procedures, and brittle orchestration patterns—just on expensive cloud infrastructure.
How to Avoid It: Use migration as an opportunity to re-architect. Decompose monoliths into modular pipelines, replace procedural code with declarative transformations, and adopt cloud-native patterns that weren't possible in legacy systems.
3. Inadequate Data Quality Management
Migrating inaccurate, duplicate, or incomplete data simply transfers problems from one system to another. This can undermine confidence in the new platform from day one.
How to Avoid It: Treat data cleansing as a core phase, not an afterthought. Establish validation rules, standardization frameworks, and governance controls before migration. Prioritize critical data elements that directly impact operations or customer experience.
4. Business Pressure and Compressed Timelines
Organizations face intense pressure for rapid digital transformation, often compressing critical testing and validation phases. Migrations attract feature requests: "While we're rebuilding this pipeline, can we add real-time updates?" "Since we're migrating anyway, let's fix this ten-year-old data quality issue." Scope explodes, timelines slip, and teams lose focus.
How to fix it: Establish a ruthless "migration-only" scope. Capture improvement ideas in a post-migration backlog, but don't let them derail cutovers. Ship the migration first, optimize second.2
Technical Execution Pitfalls
Schema Incompatibilities: Legacy schemas rarely map cleanly to modern data models. Incompatible data types, field name collisions, and structural differences break transformation logic. To avoid this, build comprehensive schema mapping early with automated compatibility testing. Validate type conversions and identify breaking changes before production.
Deferred Data Quality Validation: Migrating poor-quality data creates immediate trust issues when users encounter null values, duplicates, and invalid references. Implement data quality validation during migration. Profile legacy data early to identify issues requiring remediation before cutover.
Indefinite Incremental Migration: Migrating one pipeline at a time leads to unsustainable dual-system operations that stall at 80% complete. Set firm cutover dates by business domain. Migrate related pipelines together, validate in parallel-running periods, then cut over decisively.
Downtime and Business Disruption: Downtime during migration can disrupt core business operations, leading to data gaps, employee frustration, and potential loss of valuable insights. Extended downtime may also affect customer interactions, resulting in reputational and financial losses.
Transformation Logic Errors: Complex business rules buried in legacy code get misinterpreted, producing subtly different calculations that stakeholders notice later. Involve business stakeholders in validating transformation logic. Run parallel pipelines with output comparison to catch calculation drift early.
User Training Needs: A new data environment often requires staff to adapt to different workflows and functionalities, increasing the risk of human error without proper training.
Operational Pitfalls
Cost Overruns and Timeline Issues: Data migration projects often surpass initial budgets and timelines due to unforeseen complexities, such as additional testing needs or unexpected data compatibility issues. Unrealistic projections can lead to rushed processes, compromising migration accuracy and potentially causing data gaps.
Inadequate Rollback Planning: Teams discover they cannot revert when cutover issues occur, leading to extended outages. Design explicit rollback procedures before cutover. Maintain legacy systems in read-only mode, implement traffic splitting for instant redirection, and test rollback scenarios proactively.
Monitoring Gaps: Legacy monitoring tools lack new infrastructure coverage; modern platforms miss legacy visibility. Implement cross-platform monitoring spanning both environments. Use unified DataOps platforms or federate alerts into centralized dashboards.
Performance Degradation: New systems perform slower than legacy for specific workloads, frustrating users and requiring urgent optimization. Conduct realistic performance testing with production-like data volumes and query patterns before cutover. Validate that performance-critical workloads meet SLAs.
Organizational Pitfalls
Knowledge Silos: Critical expertise resides with individuals who become single points of failure.
Misaligned Success Criteria: Engineering considers cutover complete while business expects immediate feature parity and performance improvements.
Communication Failures: Teams work in isolation, discovering changes during incidents or through broken dashboards.
Post-Migration Pitfalls
Cost Overruns: Cloud bills significantly exceed estimates due to unoptimized queries, forgotten resources, or over-provisioned infrastructure. Solution: Implement cost monitoring from day one of production. Set budget alerts, review cost attribution weekly, and optimize aggressively during the first month.
Accumulated Technical Debt: Shortcuts taken to meet deadlines—hard-coded configurations, skipped documentation, deferred refactoring—become permanent problems. Solution: Track technical debt explicitly with agreed remediation timelines. Schedule cleanup sprints within the first quarter post-cutover.
Indefinite Legacy System Operation: Parallel running extends indefinitely, doubling operational burden and preventing completion. Solution: Set firm decommissioning dates during planning. After defined validation periods, force legacy system shutdown to prevent indefinite dual operations.
Teams that anticipate these challenges build mitigation strategies proactively rather than reactively managing crises.
Measuring Migration Success
Once live, migration isn’t done: monitor KPIs such as data-latency, error-rates, and rollback events. By following these four pillars — rigorous assessment, smart automation, strong governance, and ongoing monitoring; organizations can mitigate risk, accelerate timelines, and build a future-ready data environment.
Key success metrics include data accuracy, system performance, user adoption, and alignment with business goals, with evaluation comparing migration results against initial objectives and KPIs defined during planning. Success measurement requires a multidimensional framework spanning technical execution, business value, operational efficiency, and stakeholder communication.
Technical Success Metrics
Data Integrity and Quality
Percentage of error-free data is the most important quality metric, measuring migrated data without errors or inconsistencies. It is important to track completeness (no missing data), accuracy (correct values), and consistency across systems.
Data integrity rate compares source and target to identify corruption, truncation, or transformation errors.
Validation pass rate confirms data meets operational requirements in the new environment
Migration Performance: Downtime duration quantifies when systems are inaccessible, reducing downtime from 24 to 12 hours demonstrates efficiency. Organizations reducing downtime by just 10% save an average of $150K annually in lost productivity. We can track migration performance through its velocity of volume of data successfully migrated per hour or day to forecast timelines and identify bottlenecks.
System Performance Post-Migration: Monitor response times and data throughput before, during, and after migration—a 20% throughput increase signals enhanced performance.
Business Success Metrics
ROI and Cost Efficiency: ROI formula: ((Total cloud value – Initial investment) ÷ Cost of investment) × 100% including cost savings, increased output, and strategic advantage. Compare Total Cost of Ownership before and after migration, including hardware, software licenses, and labor expenses.
Time-to-Value: Migration velocity (servers migrated per month) estimates whether required goals will be met on deadline. Automated processes speed up timelines by 80%, shortening duration between kickoff and go-live. Track time from cutover to business users realizing value—faster adoption means quicker ROI.
Business Impact: Measure deployment frequency improvements (monthly to weekly releases) and cost efficiency gains (40% infrastructure cost reductions compared to on-premises). Combine ROI calculations with intangible benefits companies expect—costs don't capture full value (McKinsey & Company)
User satisfaction scores: indicate successful migration, while low scores highlight improvement areas.
Adoption rate of cloud tools: monitors how quickly employees embrace new features, slow rates signal need for training or interface improvements.
Operational Success Metrics
Deployment Time: Track deployment time for new applications to ensure cloud enables faster adaptation to business needs
IT operations costs and staff productivity: Monitor reduced costs and improved productivity indicate successful setup
Mean Time to Recovery (MTTR): measures how quickly teams restore service after failures, with good performers recovering in under one hour.
Recovery Time Objective (RTO): measures restoration speed after outages.
Recovery Point Objective (RPO): defines maximum acceptable data loss
Backup Success Rate: Track backup success rates and rollback readiness throughout migration to ensure business continuity.
Risk identification effectiveness metrics: by comparing planned versus unexpected risks during execution.
Security and Compliance metrics: help detect vulnerabilities early and reduce risks of breaches and non-compliance penalties.
Reporting and Communication During Data Migration
Reporting and communication are often underestimated during data migration, yet they play a central role in whether a migration feels controlled or chaotic. As data moves across systems, teams need visibility into what is happening, what is at risk, and where intervention may be needed.
Role-specific dashboards
Role-specific dashboards make reporting more actionable by ensuring that each stakeholder sees the level of detail most relevant to their decisions.
Executives need concise summaries focused on business outcomes, migration milestones, risk exposure, and overall delivery health
Engineers need detailed views into pipeline failures, schema drift, sync delays, and data quality checks.
Integrated monitoring
During migration, organizations often operate across legacy systems, cloud platforms, staging layers, and destination warehouses at the same time.
Integrated monitoring tools such as AWS CloudWatch, Azure Monitor, or Google Cloud Operations Suite help centralize operational visibility and reduce fragmentation.
Real-time migration dashboards can track progress continuously, surface anomalies early, and trigger alerts when performance degrades or data validation checks fail.
Transparent communication
Share real-time migration dashboards and recurring status updates with stakeholders.
Communicate progress, blockers, risks, and dependency changes clearly.
Use stakeholder workshops to align on priorities, scope, and expectations.
Tracking Lineage
Use data flow diagrams and lineage diagrams to explain migration processes.
Help non-technical stakeholders understand how data moves and transforms.
Improve trust and visibility across teams.
Data catalog and prioritization
Use a catalog to identify the most valuable and widely used data assets.
Prioritize migration based on business value rather than moving everything at once.
Support governance by helping data stewards track ownership, sensitivity, and policy compliance.
Conclusion
Recap of Key Principles
Data warehouse migration is fundamentally a strategic transformation, not merely a technical transfer of data from one system to another. The organizations that succeed treat migration as an opportunity to modernize their entire data ecosystem: rethinking architecture, eliminating technical debt, and building foundations for AI-driven analytics and real-time decision-making.
Assessment and planning determine success more than execution speed
The migrations that fail typically skip comprehensive data asset inventory, dependency mapping, and performance baselining. Teams discover hidden dependencies during cutover when critical reports break, not during planning when they're cheapest to address. Thorough pre-migration assessment: cataloging data sources, documenting volumes and growth patterns, mapping downstream consumers, and establishing clear performance baselines, provides the contract between business stakeholders and technical teams that prevents costly assumptions later.
Choose your migration strategy based on organizational capacity, not vendor marketing
Lift-and-shift moves quickly but wastes cloud-native capabilities. Re-platforming selectively modernizes pipelines for better performance without complete redesign. Re-architecting eliminates technical debt entirely but requires the longest timeline and highest investment. Hybrid migration reduces risk through parallel running, while CDC-based real-time migration enables near-zero downtime for mission-critical systems. The right approach matches your workload complexity, team capability, and tolerance for disruption—not what sounds most modern.
Migration without governance is just moving problems faster
Data quality issues, inconsistent metric definitions, and undocumented logic don't disappear in the cloud—they surface faster and more expensively with higher query volumes and broader access.
Migration without governance is just moving problems faster
Data quality issues, inconsistent metric definitions, and undocumented logic surface faster and more expensively with higher query volumes and broader access. Organizations must establish clear data ownership, implement role-based access controls, and define governance structures before migration begins. Treating governance as a post-migration cleanup task virtually guarantees failure.
Validation is continuous, not a phase
Migration validation doesn't end at cutover—it becomes the foundation of data reliability. Automated quality checks, anomaly detection, and performance monitoring shift teams from reactive debugging to proactive operations. The teams that succeed build validation as a first-class capability, not an afterthought.
Dual-system operations create the highest operational risk
The period when legacy and modern environments run in parallel introduces data drift, validation burden, pipeline conflicts, and visibility gaps. Teams must maintain consistency across systems while keeping everything reliable and observable. This is where tool sprawl becomes dangerous—stitching together separate solutions for ingestion, orchestration, transformation, observability, and governance fragments operational context exactly when teams need it most. Unified DataOps platforms that consolidate these capabilities reduce coordination overhead and provide the cross-system visibility essential for confident cutover.
Migration success requires organizational alignment, not just technical execution
Cloud architects, data engineers, DBAs, security leads, and business stakeholders each own distinct responsibilities that strong governance must coordinate. Building a stakeholder register, establishing communication channels before migration begins, and conducting regular alignment sessions prevents the finger-pointing and accountability gaps that derail projects.
Final Thoughts
Migration isn't a technology decision—it's a business decision disguised as one.
The companies treating this as an IT project to replace aging infrastructure are missing the point. The winners are using migration as a strategic reset: eliminating a decade of technical debt, implementing modern data practices, and building the real-time, AI-ready infrastructure that separates leaders from laggards.
But here's the uncomfortable truth: most organizations aren't ready to migrate. They can't articulate clear data ownership. They don't know what depends on what. Their governance is aspirational, not operational. Their teams lack cloud-native skills. And they're being pressured to move anyway because "everyone else is doing it."
Rushing into migration without foundations is worse than staying put. It's expensive, disruptive, and delivers a cloud bill instead of business value.
The migration decision has three paths:
You're ready. Clear ownership, documented dependencies, governance in place, capable team. Migrate strategically and use it as a catalyst for transformation.
You're not ready, but you can get there. Invest 3-6 months fixing governance, documenting assets, and building capability. Then migrate with confidence.
You're not ready and can't prioritize getting ready. Don't migrate. The disruption will outweigh the benefit. Wait until business conditions create space to do it properly.
The mistake is migrating when you're in bucket three while pretending you're in bucket one.
For those who are ready: migration is the foundation for everything else. Faster analytics. Reliable data products. Self-service at scale. The infrastructure to compete as data becomes the primary competitive advantage.
For those who aren't: be honest about it. Fixing governance isn't glamorous, but it's cheaper than a failed migration that costs millions and destroys stakeholder trust.
The real question isn't whether to migrate. It's whether you'll do it strategically—on your terms, with clear business outcomes—or reactively, when legacy systems collapse under demands they can't meet.
Migration done right is transformational. Migration done poorly is just expensive chaos in a different environment.
In Part 1 of this series, we covered why organizations migrate and how to plan for it. Technical execution is where those plans meet reality.
This section focuses on executing migration at scale—translating schemas, moving data efficiently, modernizing pipelines, and validating outcomes. The goal is not just a successful cutover, but a system that is reliable from day one and easier to maintain going forward.
Schema Translation and Mapping
Schema translation is the process of converting the structural definition of your legacy data warehouse — tables, data types, constraints, indexes, and relationships — into an equivalent structure on the target platform. It is rarely a clean one-to-one mapping. Legacy warehouses built on Oracle or SQL Server use proprietary data types, platform-specific syntax, and procedural logic that does not translate directly to modern cloud based data warehouses such as Snowflake, BigQuery, or Redshift.
The database code conversion process involves extracting code directly from the source systems' database catalog, such as table definitions, views, stored procedures and functions. Once extracted, you migrate all this code to equivalent data definition languages (DDLs). This step also includes migrating data manipulation language (DML) scripts, which may be used by business analysts to build reports or dashboards.
For large-scale tables (billions of rows), a “big bang” migration introduces significant risk. Instead, teams should adopt scalable strategies:
Parallel ingestion: Partition large tables into logical segments and load them concurrently to maximize throughput Schema optimization: Reassess clustering, partitioning, and distribution strategies for the target system
For example, in Snowflake:
Use native loading utilities for optimal performance and built-in error handling
Configure separate warehouses for loading, with auto-scaling and auto-suspend enabled
Optimize file sizes (100–250 MB) and stage organization for efficient ingestion
Remove or purge staged files post-load to maintain performance
These optimizations ensure the new warehouse performs efficiently from day one.
Data Movement Strategies
A well-defined data architecture must specify how data flows across ingestion, staging, transformation, and consumption layers. Choosing the right movement strategy is critical:
1. Full load: A full load transfers a complete snapshot of all source data to the target system in a single operation. This approach is straightforward and works well for smaller datasets or isolated systems where downtime is acceptable.
However, full loads require a data freeze window, as data must be exported from the source and imported into the target without ongoing changes. This introduces operational risk for large or business-critical systems. Additionally, careful alignment of file formats and data types is required to prevent truncation or type mismatch errors during transfer.
Example: Bulk copy operations from SQL Server into Azure SQL.
2. Incremental load: Incremental loading reduces migration overhead by transferring only new or updated records after an initial full load. This eliminates the need for extended downtime and significantly reduces data movement volume. This approach depends on reliable change tracking mechanisms—such as timestamps, watermarks, or version columns—to identify updates accurately.
Example: Transactional replication in SQL Server, where changes in the source (publisher) are continuously propagated to the target (subscriber), maintaining near real-time consistency. Incremental loading is often used as a bridge between full load and more advanced streaming approaches.
3. Change Data Capture (CDC): Change Data Capture (CDC) captures insert, update, and delete events at the source in real time, enabling continuous synchronization between legacy and target systems. This allows migration to occur with near-zero downtime, as both systems remain aligned throughout the transition.
In modern data architectures, CDC is increasingly the default—not just for efficiency, but for resilience. Instead of relying on a single high-risk cutover event, teams can validate data continuously as it flows into the target system.
CDC also plays a critical role in handling schema evolution. As source systems change—new columns, modified data types, or deprecated fields—CDC enables early detection of these changes.
Full Load vs Incremental vs CDC
However, detection alone is not enough. Teams must also enforce consistency and data quality across the pipeline.
dbt (data build tool) provides a structured way to define schema expectations, document transformations, and run automated tests (e.g., null checks, uniqueness, referential integrity). These tests catch schema drift and data quality issues before they impact downstream analytics
Observability platforms (such as Matia) complement this by providing real-time visibility into pipeline health, surfacing failures, anomalies, and schema changes as they occur
This combination: CDC for detection, dbt for enforcement, and observability for monitoring shifts data engineering from reactive debugging to proactive reliability.
Refactoring vs. Rebuilding: A Strategic Decision
Migration is not just a technical exercise—it’s a decision point. Teams must determine whether to preserve existing logic or rebuild it entirely.
Refactoring is the right approach when the underlying business logic is still valid but needs to be modernized. In these cases, teams can extract core transformations into modular SQL models and leverage tools like dbt for testing, documentation, and dependency management. This allows organizations to retain proven logic while improving maintainability, transparency, and scalability.
Refactoring also aligns well with modern architectural patterns. For example, Databricks’ Medallion architecture (Bronze, Silver, Gold) supports layered transformation and validation, where raw data is incrementally refined into high-quality, analytics-ready datasets. This structure makes it easier to systematically validate and improve legacy logic without rebuilding everything from scratch.
At the same time, modern ingestion platforms reduce the need to rebuild pipelines from the ground up. Rather than creating custom ingestion workflows for each source, platforms like Matia provide pre-built connectors that replicate data directly into the target warehouse. Its unified ingestion and observability layer enables real-time monitoring of pipeline health—surfacing failures, schema drift, and data quality issues as they occur, rather than after cutover. This is especially valuable in incremental or CDC-based migrations, where pipeline reliability is the primary risk.
However, refactoring is not always sufficient.
Rewriting becomes necessary when legacy logic is outdated, overly complex, or incompatible with modern systems. This is often the case when:
Business requirements have evolved significantly
Legacy code is tightly coupled, poorly documented, or difficult to maintain
Platform-specific logic cannot be translated effectively
While rewriting requires more upfront effort, it provides an opportunity to eliminate technical debt, simplify transformations, and align data models with current business needs.
In practice, most successful migrations adopt a hybrid approach—refactoring where logic is still relevant, and rewriting where it no longer serves the organization. The goal is not just to move pipelines, but to improve them.
Data Validation and Testing
Validation is one of the most underestimated phases of migration—and one of the most critical. Even after data is ingested and transformations are implemented, migration projects often slow down during validation due to unexpected discrepancies. A structured validation strategy is essential.
The key stages of validation includes:
Data Replication: Before formal validation begins, data replication establishes the foundation that all subsequent stages depend on. Replication is the process of copying and continuously synchronizing data from the source system to the target warehouse — ensuring both environments reflect the same state throughout the migration window. It enables parallel validation, allows teams to run bridging jobs and aggregate comparisons without freezing the source system, and provides a safety net for rollback if issues are discovered late in the validation process.
Data Profiling: Profiling analyzes the source data's structure, quality, and content before migration begins. Early profiling uncovers gaps — missing identifiers, duplicate records, non-standard formats — that could derail the project later. Fixing these at the source is significantly cheaper than discovering them post-cutover.
Unit/Transformational Testing: Unit testing validates individual components of the migration process — ensuring transformation rules are applied correctly across currency conversions, schema type changes, business logic translations, and custom calculations embedded in stored procedures or ETL logic.
Post-Migration Validation (Reconciliation): Reconciliation verifies that the migrated data matches the source, performing 100% checks or automated reconciliation of counts and data types.
Log Review and Data Lineage: When discrepancies occur, data lineage becomes essential. By tracing how data flows across pipelines, teams can quickly isolate root causes—whether they originate from source inconsistencies, transformation errors, or ingestion issues. dbt's built-in lineage graph covers the transformation layer; Matia extends visibility to the ingestion layer, giving teams end-to-end traceability from source system to target warehouse.
Cutover execution: Plan the cutover down to the hour. Document every step. Assign clear ownership. Have rollback procedures ready. Stop writes to the legacy system. Run final incremental sync. Switch applications to the new platform. Monitor closely for the first 48 hours. Performance problems and data mismatches surface fast.
SQL Validation Checks
Data validation should go beyond simple row counts. A strong validation framework combines business-level metric checks, record-level comparisons, schema and precision review, and integrity testing to confirm that migrated data is both complete and trustworthy.
Aggregate Validation (Business Metrics)
Aggregate validation helps confirm that the migrated system still reflects the business accurately at a summary level. This is often the fastest way to catch major issues, because even when individual records look fine, problems such as dropped rows, duplicate records, incorrect joins, or broken filters usually show up in rolled-up totals.
In practice, teams typically compare a small set of high-value metrics across source and target systems, such as counts, revenue totals, averages, or activity volumes, segmented by dimensions that matter to the business, like region, product line, or month. The goal is not just to prove the totals match exactly, but to isolate where they diverge so investigation can begin quickly.
A useful strategy is to start with a few trusted KPIs and compare them at multiple levels of granularity. First validate the overall totals, then break them down by time period, geography, or customer segment. This layered approach makes discrepancies easier to diagnose and reduces the time spent searching for the root cause.
Record-Level Sampling
Aggregate checks are necessary, but they are not sufficient. A migration can preserve totals while still introducing record-level errors through incorrect transformations, bad mappings, or subtle logic differences. Record-level sampling helps confirm that individual rows have been moved and transformed correctly.
This type of validation works best when teams select a representative mix of records rather than relying on purely random inspection. For example, it is often helpful to review high-value transactions, edge cases, null-heavy records, recently updated data, and records that pass through especially complex transformation logic. Looking at these records side by side in the source and target systems can reveal problems that would never appear in summary totals.
A practical strategy is to define sampling rules ahead of time so validation is repeatable. Instead of checking a handful of records informally, establish a process for reviewing records from multiple categories, document the expected outcomes, and track discrepancies as defects. This turns sampling from an ad hoc QA exercise into a structured part of the migration plan.
Data Type and Precision Verification
Schema alignment matters because migrations often fail in subtle ways when fields are technically loaded but no longer behave the same. Changes in data type, scale, precision, encoding, or null handling can introduce downstream issues even if the values look roughly correct at first glance.
Validation here should focus on whether fields in the target system preserve the same meaning and usability as they had in the source. Numeric fields may be rounded or truncated, timestamps may lose time zone context, text fields may be shortened, and boolean or categorical fields may be remapped inconsistently. These are the kinds of issues that quietly break reporting logic and analytical models later.
A good strategy is to review both metadata and actual values. Start by comparing field definitions
between source and target, then test real distributions for sensitive columns such as monetary amounts, dates, IDs, and free-text fields. Pay special attention to fields used in joins, filters, calculations, or compliance reporting, since small precision changes in those areas can create outsized downstream risk.
Constraint and Referential Integrity Checks
Referential integrity checks help ensure that relationships between records remain intact after migration. Even when row counts and summary metrics look healthy, broken relationships can undermine trust in the dataset and create failures in reporting, analytics, and applications.
These checks are especially important for parent-child relationships such as customers and orders, accounts and transactions, or products and inventory records. If keys are transformed incorrectly, loaded out of order, or excluded during migration, the target system may contain orphaned or mismatched records that are difficult to detect through aggregate validation alone.
The best approach is to identify the most business-critical relationships first and validate them systematically. Start with the joins that power core reporting and workflows, then expand outward to less critical dependencies. Teams should also decide in advance how to handle expected exceptions, since not every missing relationship is necessarily an error, but every exception should be explainable and documented.
Query Optimization Techniques
Query performance often becomes a hidden challenge during migration. Even when data is successfully moved, queries written for legacy systems may perform poorly in modern cloud warehouses. This is because platforms like Snowflake operate on fundamentally different principles—columnar storage, distributed compute, and separation of storage and compute.
Optimizing queries in this environment requires a shift from traditional database tuning to focusing on how data is accessed and processed at scale.
Filter Early and Effectively: Apply filters as early as possible to reduce the amount of data processed. Filtering on high-cardinality columns—such as dates, IDs, or partition keys—enables efficient pruning and improves query performance.
Avoid repeatedly transforming data: Repeatedly applying transformations (e.g., string manipulation, regex) increases compute overhead. Instead, materialize transformed data once and reuse it, reducing redundant computation in downstream queries.
Avoid repeated joins and subqueries: Frequent joins and repeated subqueries can significantly impact performance due to increased I/O and data movement. Where possible, simplify relationships or precompute results to avoid reprocessing the same data multiple times.
Split complex queries into smaller ones: Large, monolithic queries with layered joins, subqueries, or heavy transformations can be resource-intensive. Splitting them into smaller, modular steps improves readability, maintainability, and execution efficiency.
Optimize Table Design for Access Patterns: Query performance depends not only on SQL but also on how data is stored. Structuring tables based on common access patterns—such as filtering by date or region—enables more efficient data pruning.
Partitioning: Partitioning divides data into physical segments based on a column (e.g., date). Queries that filter on this column scan only relevant partitions, reducing data read. It works best for low-cardinality fields and sufficiently large partitions.
Clustering: Clustering organizes data within partitions based on selected columns. This improves performance for queries that filter or aggregate on high-cardinality fields and works well alongside partitioning to further reduce scanned data.
Stored Procedure Conversion
Before we can begin converting stored procedures to a pipeline methodology, it’s important to understand what the code in the stored procedures is accomplishing. Understanding the logic of the stored procedure allows you to build a modular framework for how the same logic should be developed in a pipeline approach.
Not every procedure should be migrated in the same way.
We can retain logic with minor changes when the logic is simple and compatible with the target platform, refactor when the business logic is still valid but the code is too procedural or monolithic or rewrite when the code is outdated, poorly documented, heavily cursor-based, or depends on platform-specific syntax
During data migration, when dealing with stored procedures that have a lot of data transformation logic, making use of temporary tables inside the stored procedures could be useful as an intermittent staging between databases. When you have to pull data from one database, transform or filter it, and then use it to insert into the final destination in another DB.
Example
Suppose a legacy stored procedure:
reads orders_raw
trims and standardizes text fields
joins customers
calculates revenue category
inserts results into sales_summary
Instead of migrating that one procedure as-is, you would usually do this:
stg_orders → cleaned raw order data
stg_customers → cleaned customer data
int_orders_enriched → joined and standardized intermediate table
fct_sales_summary → final destination table
So the logic is preserved, but the implementation becomes modular and easier to test.
Standardize function conversion
Simple scalar functions can often be rewritten directly in the destination SQL dialect
Reusable business rules should be centralized so they are not duplicated across models
Complex functions may need to move into Python, Spark, or another processing layer if the destination platform does not support them well
ETL/ELT Pipeline Migration
Migrating data pipelines is not just about recreating existing workflows—it’s about rethinking how data is ingested, transformed, and delivered in a modern architecture.
Traditional ETL pipelines perform heavy transformations before loading data into the warehouse. While this worked for legacy systems, it introduces rigidity, limits scalability, and increases operational overhead. Modern data platforms shift toward an ELT approach, where raw data is first loaded into the warehouse and transformations are applied afterward using scalable compute.
This shift simplifies pipeline design and allows teams to:
Retain raw data for reprocessing and auditability
Iterate on transformations without re-ingesting data
Leverage warehouse-native performance for large-scale processing
Platforms like Matia streamline this process by providing:
Pre-built connectors to ingest data from multiple source systems directly into the target warehouse
Support for incremental and CDC-based ingestion, reducing data movement and enabling near real-time updates
A unified layer for ingestion and observability, allowing teams to monitor pipeline health, schema changes, and data quality issues in real time
This reduces the need to rebuild pipelines from scratch and accelerates migration timelines.
Example Architecture: Matia → Snowflake → dbt
A modern pipeline-based migration can be implemented using a layered architecture that separates ingestion, storage, and transformation:
Ingestion Layer (Matia): Matia connects to source systems (e.g., SQL Server, APIs, SaaS tools) and replicates data into Snowflake using incremental or CDC-based ingestion.
Handles schema changes and data updates in near real time
Eliminates the need for custom ingestion scripts
Provides observability into pipeline health, failures, and data freshness
Storage Layer (Snowflake): Raw data is landed into Snowflake staging tables (often in a “Bronze” layer).
Stores data in its original format for traceability and reprocessing
Scales compute independently for ingestion and querying
Serves as the central data platform for downstream transformations
Transformation Layer (dbt): dbt models transform raw data into clean, analytics-ready datasets
Staging models standardize and clean raw data
Intermediate models apply joins, business logic, and enrichment
Final models (Gold layer) produce reporting-ready tables
Version Control and CI/CD
Data migration involves far more than moving tables. Transformation logic, pipeline definitions, schema changes, and orchestration code are all subject to change throughout the migration window — and without version control and automated deployment practices, those changes become a source of risk rather than progress. Version control should cover all data pipeline artifacts — not just application code, but SQL scripts, pipeline definitions, infrastructure-as-code, and database schema migration scripts. Treating the data warehouse schema as code, tracked through DDL scripts, is the foundation of reliable CI/CD for data teams.
Git Branch Strategy for Migration Projects
A practical Git strategy for data migration follows a four-branch model: **main** represents the production-ready state of the warehouse — only code that has passed QA and peer review merges here. **develop** serves as the integration branch for new models, dependency testing, and schema consistency validation. **feature branches** isolate individual models, macros, or transformation changes — for example, `feature/add_customer_dim` or `feature/update_sales_funnel_kpi` — and merge into develop via pull request once tested. **hotfix branches** are cut directly from main to patch critical production issues without waiting for the full release cycle.
Schema changes should be tracked explicitly. dbt's `schema.yml` tracks schema modifications and version-controls the schema history — combined with Git diffs and dbt docs, this provides full transparency over how the warehouse structure has evolved throughout the migration.
CI/CD with GitHub Actions and dbt
dbt integrates with GitHub Actions, GitLab CI, and Apache Airflow to validate and deploy data pipelines through version control — making it easier for teams to collaborate on shared models, review changes, and enforce testing before deployment. Atlan
A standard CI pipeline triggers dbt tests on every pull request — building models, validating lineage, and running data quality checks before any change is merged. Here is a basic GitHub Actions configuration for a Snowflake-backed dbt project:
For orchestration, Apache Airflow schedules and monitors dbt runs in production — triggering model builds on a defined cadence, surfacing failures, and managing dependencies between pipeline stages. A basic Airflow DAG that runs dbt on a schedule looks like this:
from airflow import DAG
from airflow.operators.bash import BashOperator
from datetime import datetime
with DAG(
dag_id="dbt_migration_pipeline",
schedule_interval="@daily",
start_date=datetime(2025, 1, 1),
catchup=False) as dag:
dbt_run = BashOperator(
task_id="dbt_run",
bash_command="dbt run --target prod" )
dbt_test = BashOperator(
task_id="dbt_test",
bash_command="dbt test --target prod" )
dbt_run >> dbt_test
This ensures models run before tests, failures are surfaced immediately, and no untested code reaches production consumers.
Use separate environments — development, staging, and production — to isolate deployments. Development and staging should mirror production as closely as possible. Use environment-specific dbt profiles and variables rather than code forks to maintain consistency without duplicating the codebase.
Security, Access, and Governance
Data security, compliance, and governance are essential for managing sensitive information across its lifecycle — security protects data from unauthorized access and breaches, compliance ensures adherence to regulations, and governance aligns data practices with business goals ensuring quality, consistency, and regulatory compliance.
Authentication and Access During Migration
Access management during migration is one of the most overlooked security risks in the entire programme. Credentials are shared across teams, temporary access is granted for cutover tasks, and new tooling introduces new authentication surfaces — all at the same time.
The core authentication controls that must be in place before migration begins:
Multi-Factor Authentication (MFA) — enforce for all accounts accessing migration tooling, source systems, and target environments throughout the migration window, not just in production
OAuth 2.0 and SSO — use federated login via an existing identity provider rather than managing separate credentials for each migration tool, ingestion platform, and target warehouse. This is particularly important when the migration stack spans multiple platforms simultaneously
Service accounts over individual credentials — ingestion pipelines should authenticate via dedicated service accounts with scoped permissions, not individual engineer credentials that change or expire mid-migration
Temporary access with defined revocation — engineers who need elevated access for cutover tasks should be granted it via temporary roles with an explicit revocation date. Permission sprawl from migration projects is one of the most common post-migration security audit findings
Data Governance and Compliance
Data governance during migration spans the full data lifecycle—from collection to retention and disposal—and must comply with regulations such as **GDPR, CCPA, HIPAA**. Because migration often involves sensitive information, it introduces additional compliance risk. Without proper controls, organizations can face regulatory violations, unauthorized access, or data loss. Embedding governance and security directly into the migration process is therefore critical.
Key tactics engineering teams should implement or evaluate in migration solutions include:
Encryption in transit and at rest to protect data as it moves between systems and while stored in target environments
Role-Based Access Control (RBAC) to define who can access or modify data and pipelines based on their role
Fine-grained access controls (row- and column-level) to limit how much data a user can see, even when access is granted
Audit trails and logging to track access, changes, and permission updates for compliance and incident investigation
Matia centralizes access management across the entire data platform, enabling consistent and scalable control across systems.
Key capabilities include:
Centralized RBAC: Define roles once and apply them across integrations, observability, and catalog layers—eliminating fragmented access management
Fine-Grained Access Governance: Ensures sensitive data is only accessible where necessary, supporting secure collaboration across teams working on migration and AI workflows.
Audit Logs and Activity Tracking: Captures user access, role assignments, and permission changes over time. Provides a complete history of who accessed or modified data workflows—critical for SOC 2 and internal audits.
API-driven access control: Automate user provisioning and integrate with existing identity management systems
Centralized Access Visibility: Offers a single view of platform-level permissions across integrations, observability, and catalog layers, eliminating fragmented access tracking.
By combining cataloging, access control, and auditability, Matia ensures governance is not a separate layer but an integrated part of the migration process—keeping data secure, compliant, and fully traceable as it moves across systems.
Successful execution is not about speed—it’s about control. Teams that invest in structured validation, modular pipelines, and modern ingestion strategies reduce risk and avoid costly rework. By the end of execution, the system should not only be live, but stable, testable, and ready for production workloads.
In Part 3 of this series, we move beyond execution into what comes next: the operational challenges of running dual systems, avoiding tool sprawl, and optimizing performance, cost, and reliability post-migration.
Company: Recharge Location: Los Angeles, CA Industry: Subscription Management / E-commerce SaaS Solutions: Matia ETL, Matia Reverse ETL Website:https://getrecharge.com/
The Data Stack
Ingestion: Matia Reverse ETL: Matia Warehouse: Snowflake Transformation: dbt Core Cost Optimization: Select.dev Connectors Used: PostgreSQL, Mysql, Salesforce, Snowflake, plus more than a dozen more
The Company
Recharge is the leading subscription management platform for e-commerce merchants, primarily those selling on Shopify. Recharge helps merchants convert one-time buyers into loyal subscribers and retain them over time through a suite of tools spanning subscription management, analytics, and AI-powered customer retention.
David Lexa is Senior Engineering Manager for the Data Engineering team at Recharge, overseeing a team responsible for data ingestion, transformation, and powering internal analytics, merchant-facing data products, and billing operations, all running through Snowflake.
Recurring Replication Failures
The more operationally disruptive issue was a recurring pattern of MySQL replica failures in Fivetran. When Google automatically recovered a replica, it would sometimes reconstitute without the necessary binary logs. Fivetran would then flag the pipeline as broken and require a full table reload to re-sync.
For Recharge's largest tables (some requiring up to 5 days to fully refresh), this was untenable. The team couldn't afford days of stale data. Their workaround was painful: get on a call with Fivetran support, manually set the binary log position to the time of failure, then push the missed records back through the pipeline by manually triggering updates on affected rows.
"We would get on a call with Fivetran, and we would need to work with them to set the bin log position to a certain time manually. They would need to do it. It's not something we could do ourselves." — David Lexa, Senior Engineering Manager, Data Engineering, Recharge
The combination of cost pressure and operational fragility made the case for switching clear.
Escalating Costs
Approximately nine months before Recharge's ingestion contract renewal, David's team received a preview of the upcoming pricing: a projected increase of 75–100%. The scale of the jump was significant enough to prompt a formal evaluation of alternatives.
Fragmented Tooling
Running ETL and reverse ETL across two separate platforms added operational overhead. Even as tools merged, they were missing functionality and integration that could be gained from a native, unified platform
The Solution
After evaluating alternatives, Recharge selected Matia to streamline both ETL and reverse ETL into a single platform. Key factors in the decision:
Binary Log Recovery Feature: Matia platform has a capability that allows Recharge to temporarily switch to the master MySQL endpoint for a single sync during a replica failure, then return to the replica, eliminating the manual Fivetran support calls that had been a recurring time drain
Cost Efficiency: Recharge's renewal quote came in at nearly 70% their existing rate. Migrating platforms also gave them the opportunity to audit which tables were used downstream in dbt, leading to a reduction in unnecessary syncs.
Roadmap Influence: Matia offered a more collaborative relationship, with the ability to request and receive specific features quickly
Unified Data Movement: One platform to replace both Fivetran (ETL) and Hightouch (reverse ETL), reducing context-switching and operational complexity
The Impact
Incident Response Time Reduced
The binary log recovery feature eliminated what had been a recurring, multi-hour incident response process. What previously required a coordinated call with Fivetran support and manual data backfilling now takes a single self-service action.
32% Reduction in Snowflake Costs
Following the migration, Recharge saw a 32% decrease in Snowflake compute costs. This was driven by Matia's more efficient sync behavior, as well as the opportunity the migration provided to audit and remove tables that weren't being actively used downstream in dbt.
“The migration forced us to ask: what data are we actually using? Cutting the noise, combined with Matia's efficiency, brought our Snowflake costs down around 32%."
By replacing Fivetran and Hightouch with a single Matia platform, Recharge simplified its data movement stack. Reverse ETL syncs to Salesforce and HubSpot now run alongside ETL pipelines in one tool, reducing the operational burden on the data team.
Faster Innovation Through Collaboration
The Matia team has delivered custom capabilities, including the binary log endpoint switching feature and a solution for handling new Elasticsearch index versions, in response to Recharge's specific needs. Critically, having a reliable and unified data foundation in Snowflake is what makes Recharge's growing AI initiatives possible. Clean, trusted data flowing from production systems through Matia into Snowflake is the prerequisite for every LLM-powered feature the team builds on top of it.
Making AI Reliable Enough for Customer-Facing Products
Recharge already had access to AI capabilities. The challenge was delivering AI in ways that could reliably power merchant-facing experiences.
With a stable, unified data foundation in place, the team can now build and operate AI capabilities that directly impact customers without risking downtime, stale data, or broken pipelines.
Three use cases are already in production:
Merchant Vertical Classification Recharge uses Snowflake's built-in LLM capabilities to automatically classify merchants into verticals and subverticals based on their products and website data, replacing what would otherwise be manual tagging at scale.
Cancellation Reason Summarization The data team aggregates subscriber cancellation reasons and uses AI to surface synthesized insights to merchants, giving them a clear view of why subscribers are churning and where to focus retention efforts.
Text-to-SQL for Merchant Analytics(beta) Recharge is building a natural language interface on top of its merchant analytics product, letting merchants query their subscription data by asking plain-language questions rather than navigating pre-built dashboards.
Product Performance AI Report Recharge’s data team produces a monthly email that scores top 5 products based on revenue and provides insights about churn rate, benchmarks, user acquisition, and other relevant metrics for that specific product.
Looking Ahead
Recharge's data team is actively expanding its AI-powered product surface, with new use cases in development. As Recharge continues to build data products that power both internal operations and merchant-facing experiences, Matia's role as a reliable, responsive partner in the data stack will remain central to that work.
Good documentation doesn't just answer questions. It removes the gap between "I want to build this" and "I built it." For data engineers and developers working with Matia, that gap just got even smaller. As AI agents become a bigger part of how data teams operate, that gap extends beyond your engineers. Agents need to understand your platform just as well as the people building on top of it.
Today, we're launching the Matia Documentation Hub, a centralized, structured knowledge base covering every part of the platform. Connector schemas. API references. Setup guides. Step-by-step workflows for syncs, monitors, Reverse ETL, and more. Matia is a unified data operations platform. Your documentation should reflect that.
What’s Included?
150+ Connector Schemas, Fully Documented
Every connector in Matia now has a dedicated reference page covering stream-level schema information, field types, primary keys, replication methods, and freshness behavior. If you're evaluating whether a source connector will give you the data you need before you configure it, that information is now available without a support ticket.
This covers all 150+ connectors across Matia's supported sources and destinations. A few of the most commonly used:
Postgres: table-level stream configs, replication slot behavior, column types, and primary key handling.
HubSpot: CRM object streams including contacts, companies, deals, engagements, and custom properties.
Salesforce: object schemas across standard and custom objects, field-level metadata, and incremental replication details.
Salesloft: cadence, person, and activity stream schemas with field type references.
Stripe, Snowflake, BigQuery and 150+ more: each with the same depth of stream and schema coverage.
If you're evaluating whether a connector will surface the data your models depend on, the answer is in the docs before you even attempt to configure it.
You can navigate to each of the documentation pages directly from the documentation hub, or from the site.
Getting Started: Core Concepts
New to Matia, or onboarding a new engineer onto the platform? The Getting Started section walks through the fundamentals without assuming context.
Three core tracks to get you operational:
First Integration: Connect a source, configure a destination, and understand how Matia handles schema detection, sync scheduling, and replication modes.
First Monitors: Set up observability on a pipeline. Understand freshness checks, row count monitoring, and how alerting routes through to your team.
First Reverse ETL Sync: Sync modeled data from your warehouse to a downstream tool. Configure field mappings, set sync behavior, and validate that records are landing correctly. You can trigger Reverse ETL based on the success of a dbt job.
Each track is structured as a step-by-step flow, allowing you to be able to get something operational with the documentation.
API References
Matia's API is the backbone for teams that build internal tooling or integrate Matia into broader data platform workflows.
The API section covers authentication, endpoint structure, request and response formats, rate limits, error codes, and pagination behavior. If you're building against the API, this is the reference you'll keep open.
Platform Guides: Operational How-Tos
Beyond getting started, most teams have recurring operational questions. How do you handle a schema change without breaking a downstream model? How do you configure a sync to run on a custom schedule? How do you set up notifications so the right person gets paged when a pipeline goes stale?
The Guides section answers these with focused, task-oriented walkthroughs. Current guides include:
This list will grow continuously. When a question comes up repeatedly in support or in conversation with customers, the answer should exist in the docs.
Built for How Engineers Actually Work
Documentation that requires you to read everything to find anything is not documentation. The Matia Documentation Hub is structured around how engineers actually navigate: by connector, by how-to, but API info and more.
Search is fast, and the Getting Started tracks are separated from the reference material. Connector schemas are in one place, and API documentation is organized by endpoint, not by internal product concept.
If you're mid-implementation and need to know what a specific field returns, you can get there in under thirty seconds.
What's Coming: AI-Assisted Documentation
We're building something for the cases where even the best-structured docs leave a gap. You have a specific question about your schema, your configuration, or how two Matia features interact in your particular setup. You don't want to search, you want an answer.
We'll have more to share on this soon. The goal is to make expert-level answers available to every engineer working in Matia, not just the ones who've been using the platform for two years.
Start Using the Documentation Hub
The Matia Documentation Hub is available now at docs.matia.io.
If you're already a Matia customer, the documentation hub reflects the current state of the platform including your available connectors and API version. Bookmark it.
If you're evaluating Matia, the connector schema pages and API reference give you a clear picture of what the platform supports before you start a trial.
And if something's missing, tell us. Reach out at hello@matia.io or if you’re a customer, your individual slack channel. The goal is a documentation hub that earns a permanent tab in your browser, and that only happens if it answers the questions you actually have.
Data teams are being asked to carry more complexity than ever. Analytics is no longer limited to dashboards and monthly reporting cycles, and AI is raising the bar even further. Businesses expect modern data platforms to support more than historical reporting. They need to enable use cases like demand forecasting, real-time operational alerts, personalized customer recommendations, and AI-driven decision support across the business. Those insights also need to show up where work actually happens: in warehouses, BI tools, internal apps, customer-facing products, and automated workflows.
But many organizations are still trying to meet these expectations on top of legacy systems that were never built for this level of speed, scale, or flexibility. As data volumes grow, the cracks start to show. Queries slow down, pipelines miss SLAs, batch windows spill into business hours, and every new request adds more strain to already fragile architecture. Requirements like real-time ingestion, self-service analytics, and AI-ready data pipelines do not just expose technical debt—they make it impossible to ignore.
That is why data warehouse migration is rarely just a lift-and-shift exercise. The moment teams begin moving data, they uncover everything the old environment was hiding: brittle pipelines, inconsistent metric definitions, undocumented dependencies, duplicated logic, and low-confidence data. Migration forces those issues into the open. Done well, that is not a setback—it is the opportunity. It gives organizations a reason to clean up what was tolerated for too long and rebuild on stronger foundations.
More importantly, migration is a catalyst for modernization. It enables organizations to rethink architecture, streamline and consolidate data, and accelerate analytics delivery. For data leaders, the question is no longer just technical feasibility—migration has become a foundational step in digital transformation. By bridging legacy systems with modern, cloud-based environments, it lays the groundwork for advanced analytics, AI-driven use cases, and more efficient, data-informed operations.
What is Data Warehouse Migration?
Data warehouse migration is the process of moving data, workloads, and analytical pipelines from legacy or on-premises systems to modern environments such as cloud, hybrid, or lakehouse architectures. But in practice, it is much more than moving data from one platform to another.
A successful migration reshapes how data is stored, modeled, governed, and delivered to the business. It affects architecture decisions, pipeline design, performance, cost, security, and the overall reliability of analytics. Unlike a simple infrastructure upgrade, migration is an opportunity to modernize the data ecosystem so it can scale with growing demand and support new business and AI use cases.
This guide provides a practical framework for planning and executing a modern data warehouse migration, covering architecture choices, pipeline strategies, tooling considerations, and common pitfalls so teams can migrate with confidence and deliver value from day one.
Why Organizations Migrate Data Warehouses
The business case for data warehouse modernization in 2026 isn't about chasing trends. It's about reclaiming the ability to compete.
1. Technical Limitations of Legacy Systems
Enterprises initiate data warehouse migrations when legacy systems can no longer meet the speed, scale, and flexibility demanded by modern analytics. Many traditional warehouses are approaching end-of-life — without security patches, performance updates, or vendor support — while simultaneously failing to integrate with contemporary cloud ecosystems, streaming platforms, and APIs. Decades of siloed development compound the problem: systems built on incompatible data formats, proprietary structures, and closed communication protocols produce fragmented infrastructure that resists consolidation and makes consistent, governed analytics across the organization structurally difficult to achieve.
The performance consequences are just as significant. Query performance degrades as data volumes outgrow original capacity estimates. Batch-processing architectures built for small analyst teams cannot support the concurrency, speed, or workload intensity that modern BI, real-time analytics, and AI initiatives require. McKinsey research shows organizations spend up to 70% of their IT budgets simply keeping these systems operational — a resource trap that prevents strategic investment while delivering no competitive return. The engineers who should be building data products are maintaining infrastructure instead.
2. Business Imperatives
I. Rising Costs and Unsustainable Legacy Complexity
Legacy systems become increasingly expensive and difficult to maintain as they age. Hardware refresh cycles, licensing, and specialized talent drive up costs while delivering diminishing returns. At the same time, growing data volumes are pushing batch-based architectures beyond their limits, making scaling both inefficient and costly.
Cloud transforms IT spending from large upfront capital investments (CapEx) to usage-based operating expenses (OpEx), aligning costs with actual demand and reducing the risk of underutilized infrastructure.
II. AI and Real-Time Use Cases Expose Data Limitations
AI is rapidly becoming a business requirement rather than an experimental initiative. As organizations move AI and machine learning into production, they need data platforms that support low-latency access, real-time pipelines, scalable compute, and API-driven architectures. In many cases, the bottleneck is not the model, but whether the underlying data foundation can deliver trusted, timely, and accessible data at scale.
Legacy systems built on batch processing, siloed data, and rigid scaling struggle to support modern AI use cases such as vector search, real-time decisioning, and frequent model updates. In contrast, cloud-native platforms provide elastic compute, integrated AI capabilities, and flexible architectures that better align with these demands. AI is also accelerating migration itself, with predictive algorithms improving data mapping accuracy and significantly reducing migration timelines.
III. Competitive Pressure to Modernize and Scale
The gap between organizations that have modernized their data infrastructure and those that have not is widening. MIT CISR research across 1,311 global firms found that only 22% are "future ready," having built the digital capabilities to innovate, engage customers, and reduce costs simultaneously. The remaining 78% are falling behind at an accelerating rate as the organizations ahead of them compound their advantages quarter by quarter.
Microsoft Azure research shows organizations migrating to cloud-native PaaS architectures achieve a 228% ROI over three years, a 50% increase in application development speed, and a 40% reduction in infrastructure costs. Those that delay modernization face compounding disadvantages across industries: from real-time fraud detection in finance to personalization in retail and analytics in healthcare.
IV. Business Continuity, Resilience, and Security
Cloud migration is a critical enabler of business continuity and disaster recovery, allowing organizations to maintain operations even in the face of disruptions such as hardware failures, natural disasters, or cyberattacks. By moving data and applications to the cloud, companies benefit from built-in capabilities like automated backups, real-time data replication, and rapid failover mechanisms, which significantly reduce downtime and prevent data loss. Additionally, leading cloud providers invest heavily in advanced security infrastructure, offering features such as encryption, identity and access management, and continuous monitoring to strengthen protection against cyber threats.
V. Foundation for Enterprise Digital Transformation
Cloud serves as the backbone for integrating data, applications, and advanced technologies, enabling real-time decision-making, new business models, and enhanced customer experiences. By reducing the need for manual infrastructure management, cloud adoption allows teams to focus on higher-value activities such as analytics, innovation, and customer experience improvements.
3. Modern Data Platform Capabilities
Modern cloud-native architectures address the structural limitations of legacy systems across four dimensions:
Cost: Moving from on-premises infrastructure to cloud-based platforms eliminates hardware refresh cycles, reduces licensing overhead, and shifts capital expenditure to a consumption-based model. Organizations typically see 15–40% infrastructure cost savings in the first three years post-migration.
Scalability: Cloud data warehouses decouple storage from compute, allowing organizations to scale each independently as workloads fluctuate. Enterprises can support massive data volumes and high user concurrency without provisioning for peak capacity year-round — delivering consistent performance at a fraction of the fixed cost.
Performance: Legacy systems rely on scheduled, batch-based data processing. Modern warehouses support real-time and near-real-time ingestion, enabling faster insights, shorter reporting cycles, and the ability to respond to changing business conditions as they happen rather than hours later.
Agility: Modern architectures enable self-service BI, faster analytics development cycles, and native support for AI and ML workloads. Teams can move from data to decision without waiting on engineering queues or infrastructure provisioning cycles. AI-powered data migration tooling further accelerates this — predictive algorithms improve data mapping precision by 40%, reducing human error and expediting the migration process itself.
4. When NOT to Migrate
Cloud migration is not always the right move, and poor timing can be as risky as not migrating at all. Before committing, organizations must ensure the foundational conditions for success are in place. Here are some reasons not to migrate:
Poor Data Quality and Lack of Clarity: Migration transfers data—it does not fix it. If your environment contains inconsistent metrics, undocumented logic, or unreliable pipelines, these issues will scale and become more costly in the cloud.
Weak or Undefined Governance: Migration amplifies organizational ambiguity. If ownership, definitions, and lineage are unclear, those gaps will expand at scale in a cloud environment. Governance must be established before migration begins, not treated as a post-migration cleanup task.
Poor Timing with Critical Business Cycles: Migrating during an active product launch, financial close, or regulatory audit compounds operational risk unnecessarily. Migrations should be planned around natural business windows: fiscal quarter-ends, scheduled maintenance periods and aligned with broader strategic initiatives. The disruption is manageable when timed correctly. When timed poorly, it becomes a crisis.
Insufficient Technical Capability: Organizations routinely underestimate the technical capability required, configuring cloud platforms, managing hybrid environments, applying security controls, and maintaining data consistency throughout transition. Migrating without the right internal capability or a qualified external partner significantly increases the probability of data loss, pipeline failure, and cost overrun.
Pre-Migration Assessment & Planning
The first step for an organization before considering moving its data to the cloud, is to understand their current data processes and environment, and its dependencies. They must define their objectives, assess the data complexity and build a structured plan to see what should move and what should be retired.
Data Asset Inventory
The starting point of any migration assessment is a complete, accurate picture of your current data landscape. This involves cataloguing all the disparate data sources in your environment including APIs, flat files, databases and legacy systems into its critical need to prioritize migration sequencing.
Beyond raw source cataloguing, teams should document data volumes, growth patterns, and storage distribution across databases, files, and applications — and map schema complexity including custom data types, stored procedures, and inter-table dependencies that affect migration sequencing.
Dependency Mapping
Data assets do not exist in isolation. Every warehouse has downstream consumers — BI tools, applications, scheduled ETL jobs, API connections, and reporting workflows — that will break if dependencies are not identified and accounted for before migration begins.
Dependency mapping involves identifying which systems rely on others, tracking user access patterns to reveal who uses what data and when, and surfacing legacy constraints. It must trace interdependencies across data pipelines, ETL pipelines, APIs, and downstream reporting to avoid breaking business processes and must evaluate data locked in obsolete platforms or proprietary formats that require special extraction methods.
Thorough mapping documentation is the contract between business stakeholders and the technical implementation team. For example, during an ERP implementation managed by Oracle consulting teams, this document ensures that financial data from a legacy system is correctly transformed to meet the new system’s complex chart of accounts. Similarly, in a healthcare data warehouse migration following HL7 standards, precise mapping guarantees that patient data is consistently and accurately structured for regulatory compliance and clinical analysis. Without this guide, teams are left to make assumptions, which inevitably leads to errors that are costly and time-consuming to fix post-migration.
Performance Baseline Establishment
Before a single table is moved, teams must establish a clear performance baseline against which the migrated environment will be measured. Since the inventory becomes a source of truth, every subsequent decision on what to migrate or retire becomes as reliable as the completeness of the catalog, and a thorough audit can help in identifying hidden quality issues like duplicate, missing or inconsistent formatting, and establishes a clear baseline that defines a precise migration scope.
Performance baseline establishment involves capturing current query performance, concurrent user loads, and SLA metrics providing the reference point against which the new environment will be benchmarked post-migration.
Continuous performance optimization and monitoring throughout the migration lifecycle are essential to prevent system degradation, meet user expectations, and realize the full business value of the new platform.
Cost Analysis and Business Case
Migration investment must be justified with a structured financial model — not a general assertion that cloud is cheaper. To secure funding, the business case must move beyond "IT cost savings" and tie the investment to clear financial outcomes, quantifying impact across cost reduction (TCO), performance improvements, risk reduction, and strategic enablement.
The cost analysis should account for both sides of the ledger. On the cost side: current infrastructure spend, licensing, maintenance contracts, and engineering hours consumed by legacy upkeep. On the return side: projected cloud savings, productivity gains from faster analytics, reduced downtime risk, and the strategic value of capabilities the legacy system cannot support at all — real-time ingestion, self-service BI, AI workloads.
A pre-migration impact assessment should provide an accurate analysis of cost and resource requirements and if there are tight deadlines, complex migration scope, and limited resources, performing this assessment as early as possible is essential. Most projects that fail to do so are based on previous project estimates at best, or optimistic guesswork at worst.
Choosing Your Target Platform
Evaluation Framework
There are several major cloud platforms that you can choose from, and each major cloud platform approaches warehousing differently. Each migration approach: cloud-native, lakehouse, or legacy modernization, comes with trade-offs in scalability, control, and complexity.
The only reliable way to compare platforms is to model your specific workload — define your monthly query volume, total data stored, and query scanning patterns, then use vendor calculators and free trials to test against your actual data before committing.
Evaluation Criteria at a Glance
Criteria
Key Question to Answer
Workload Profile
Are we modernizing legacy EDW, building a lakehouse, or going cloud-native?
Cloud Ecosystem
Are we single-cloud, multi-cloud, or avoiding lock-in?
Cost Model
What does pricing look like against our actual query volume and data size?
AI & ML Readiness
Does the platform support our current and near-term AI workloads natively?
Performance at Scale
Have we benchmarked against production-representative data, not sample sets?
Governance & Security
Does the platform meet our data residency, lineage, and compliance requirements?
Platform Comparison Overview
The market currently divides into three broad categories: the established cloud-native warehouses (Snowflake, BigQuery, Redshift) optimized for managed analytics at scale; the lakehouse platforms (Databricks, Microsoft Fabric) built for unified data engineering, science, and AI; and legacy modernization platforms for organizations that need enterprise-grade performance without a full architectural overhaul. The right choice depends on workload profile, cloud strategy, and team capability — not vendor marketing.
Snowflake
BigQuery
Redshift
Databricks
Microsoft Fabric
Type
Cloud-native DWH
Cloud-native DWH
Cloud-native DWH
Lakehouse
SaaS Lakehouse
Cloud
AWS / Azure / GCP
GCP only
AWS only
AWS / Azure / GCP
Azure only
Pricing Model
Credits per second
Per byte scanned
Per node-hour / RPU
DBUs per second
Capacity units
Scalability
Independent storage + compute
Fully serverless
MPP, manual tuning
Auto-scaling clusters
Autoscale Spark billing
AI / ML
Cortex AI, Snowpark
BigQuery ML, Vertex AI
SageMaker integration
Native MLflow, Spark ML
Copilot, Azure AI integration
Best For
Multi-team, multi-cloud, enterprise governance
Simplicity, variable workloads, fast deployment
AWS-native teams, structured BI
Unified data + ML / AI platform
Microsoft ecosystem consolidation
Consideration
Cost management requires auto-suspend discipline
Expensive under unoptimized query patterns
Requires active performance tuning
More than needed for pure SQL analytics
Still maturing outside Microsoft stack
Migration Strategy & Planning
There is no single “correct” way to migrate a data warehouse. The right approach depends on business priorities, risk tolerance, technical debt, and timelines. In practice, most organizations combine multiple methodologies—but understanding each approach helps define a clear strategy.
Migration Methodologies
1. Lift-and-Shift (Rehosting)
Lift-and-shift moves an existing data warehouse to the cloud with minimal changes to schema, pipelines, or transformation logic. The goal is speed—getting off legacy infrastructure quickly without disrupting existing workloads.
In practice, this often includes small adjustments to make workloads compatible with the target platform. For example, Snowflake promotes a “Lift, Adjust, and Shift” approach, where organizations first migrate historical data as a point-in-time snapshot (a “golden copy”), then transition live ingestion pipelines using ETL or ELT. Deeper redesign is deferred unless the existing system has major architectural issues.
Other platforms follow similar patterns:
AWS Redshift Migration Service (DMS) supports bulk data transfer and replication with minimal transformation.
Google BigQuery Data Transfer Service enables straightforward ingestion from legacy systems.
Best for: organizations that need to exit legacy systems quickly (e.g., costly on-prem Teradata or Oracle warehouses).
Trade-off: fast migration, but existing inefficiencies and technical debt are carried forward.
2. Big Bang Migration
A big bang migration moves all major data, pipelines, and workloads in a single cutover event. Once the new system is live, the legacy environment is decommissioned almost immediately. This approach requires extensive upfront testing, validation, and coordination across teams, because there is little room for error during the cutover window.
Example: A mid-sized SaaS company migrating from an on-prem PostgreSQL warehouse to BigQuery may choose a weekend cutover, migrating all datasets and switching dashboards at once to avoid running dual systems.
Best for: For startups or small-size organizations with a modest amount of data and the possibility of taking a complete break-in operation.
Tradeoff: faster end state, but much higher operational risk.
3. The Trickle Method (Parallel)
In the trickle method or a parallel run, you run both legacy and cloud systems simultaneously during a transition period, and this is advantageous with the lack of downtime. Workloads are gradually migrated and validated in the new environment while the old system remains active as a fallback.
This approach reduces risk significantly because teams can compare outputs between systems and validate business logic before fully switching over. It also allows teams to build expertise in the new platform incrementally.
Example: A fintech company migrating to Snowflake may run both its legacy warehouse and Snowflake in parallel for several months, validating financial reporting outputs before fully cutting over.
Best for: If you are a medium or large enterprise with a 24/7 lifecycle that can’t afford a total shutdown or downtime is not acceptable, the trickle approach would be the best choice.
Tradeoff: higher temporary cost and complexity due to running dual environments, and requires significant synchronization efforts and close supervision of what has already been transferred and what is still waiting for its turn.
4. Phased Migration (Incremental)
A phased migration breaks the migration into smaller units, such as by business domain, dataset, or pipeline layer (raw → staging → marts). Each phase is completed and validated before moving to the next.
This approach reduces risk and makes the migration more manageable, especially for large organizations with many dependencies.
Matia supports phased migration by letting teams move ingestion workflows incrementally while validating reliability and data quality inside the same platform. Its real-time CDC and fast replication keep source and target systems in sync throughout the transition.
Example: A healthcare organization might migrate patient data pipelines first, followed by billing systems, and then analytics dashboards—ensuring each domain is stable before proceeding.
Best for: Works well for moderate-size databases that have close to no interdependencies. Gives users an opportunity to take novelties in their stride by small volumes, which spells less adaptation stress.
Tradeoff: slower migration timeline and requires strong coordination to know the dependencies to prevent shutting down the whole system while migration is underway.
5. Refactoring or Re-architecting
Refactoring involves redesigning the data warehouse to align with modern architecture and business needs. This includes rebuilding schemas, rewriting ETL/ELT pipelines, redefining data models, and improving governance, observability, and performance.
This approach is often paired with modern tools:
dbt for modular, testable transformations
Databricks or Snowflake for scalable compute and storage
Delta Lake / Iceberg for lakehouse architectures
Refactoring is the most resource-intensive approach, but it delivers the greatest long-term value by eliminating legacy inefficiencies and enabling advanced analytics and AI use cases.
Example: A logistics company moving to Databricks may redesign its entire pipeline from batch ETL to streaming ingestion, enabling real-time shipment tracking and predictive optimization.
Best for: organizations using migration as a full modernization initiative.
Tradeoff: highest effort, but strongest scalability, performance, and data reliability.
6. Hybrid Migration
A hybrid approach combines multiple methodologies based on workload criticality and business priorities. This is the most common strategy in real-world migrations.
For example:
Lift and shift historical data for speed
Run parallel systems for critical reporting
Refactor high-value pipelines for performance and scalability
This approach allows teams to balance speed, risk, and modernization.
Best for: complex environments with mixed priorities.
Tradeoff: flexible and practical, but requires strong planning and governance.
Workload Prioritization
Not all data assets are equal, and treating them as such is one of the most common reasons migrations overrun. Prioritization should be based on three criteria:
business criticality
migration complexity
downstream dependencies
Assets that support critical operations or decision-making move first; those with the highest dependency counts — BI reports, transformation workflows — are sequenced to unblock the most downstream consumers as early as possible. Pilot migrations with non-critical workloads should always precede mission-critical ones — they validate the technical approach early and surface dependency gaps when they are cheapest to resolve. Non-critical and static datasets move first, followed by operational databases and workflows, with full legacy parity validation as the final phase before cutover.
Team Structure and Roles
A successful migration is as much an organizational effort as a technical one. Cloud architects, data engineers, DBAs, ETL specialists, QA analysts, security leads, and business stakeholders each own a distinct slice of the program: strong project governance and communication coordinate them and prevent rework. Identifying who needs to be involved and aligning them before migration begins is as important as the technical plan itself.
The first step is building a stakeholder register: a comprehensive list of all stakeholders with their roles, responsibilities, contact details, and communication preferences. This becomes the operational backbone of program governance — clarifying ownership, surfacing gaps in accountability, and ensuring every team member knows who to escalate to when issues arise.
Establishing consistent communication channels across IT, data engineering, business units, and executive decision-makers is non-negotiable. Regular sessions with both data stakeholders and technical teams should be scheduled from the outset — not reactively — to surface concerns early, align on expectations, and keep all parties moving at the same pace.
Timeline and Milestones
The timeline for data migration depends on the type, volume and complexity of the data being migrated, as well as issues you encounter around data cleanliness and compatibility. Because migration timelines directly impact business operations, it's crucial to set realistic expectations among stakeholders before embarking on a migration project.
Phase 1: Pre-Migration (3–6 Months)
Gartner reports 60% of data warehouse migrations exceed planned timelines due to weak data profiling and governance — the pre-migration phase is where that failure either begins or is prevented:
Vendor evaluation, platform selection, and procurement
Team training on the target platform and migration tooling
Security and compliance approvals — GDPR, HIPAA, SOC 2
Pilot project execution and validation on non-critical workloads
Data inventory, dependency mapping, and schema assessment
Phase 2: Migration Execution (2–8 Months)
A phased execution approach moves data gradually by domain — finance first, followed by HR, marketing, and operations — reducing risk and allowing teams to resolve issues before more complex workloads are migrated:
Initial full data loads and schema conversion
ETL/ELT pipeline migration and application integration
Performance optimization and query tuning on the target platform
Parallel validation — comparing source and target outputs before cutover
Migration does not end at cutover. Continuous monitoring and optimization post-migration are essential for long-term success
Performance monitoring against pre-migration baselines:
Issue resolution and pipeline refinement
Cost governance and cloud spend optimization
Documentation updates and knowledge transfer to operational teams
Decommissioning of legacy systems once stability is confirmed
Success Measurement Milestones:
Use pre-migration impact assessment for accurate cost and resource analysis.
Define project phases, from data assessment to testing and validation.
Allocate resources and assign responsibilities for each phase.
Plan for contingencies and potential delays in case of unforeseen issues or complications.
Define precise workflows for reaching milestones.
Address resource gaps and ensure clarity in task sequence.
Performance benchmarks comparing old versus new system response times
Cost reduction targets, including infrastructure and operational savings
User satisfaction scores from business stakeholders and analysts
Data quality metrics demonstrating migration accuracy and completeness
Data warehouse migration is often framed as a technical upgrade, but in practice, it is a strategic reset. Planning determines whether migration becomes a controlled transformation or an expensive disruption. The organizations that succeed are not the ones that move fastest, they are the ones that understand what they are moving, why it matters, and how it connects to the business. Clear objectives, strong governance, and a realistic assessment of technical and organizational readiness are what separate successful migrations from failed ones.
This phase is where trade-offs are defined: speed versus risk, lift-and-shift versus modernization, short-term continuity versus long-term scalability. Getting these decisions right upfront reduces complexity later and prevents costly rework during execution.
Check out Part 2 of this series, where we move from strategy to execution—focusing on how to migrate, validate, and operationalize the new system.
I used to think moving from software engineering to data engineering would feel like switching careers.
It didn’t.
Honestly, it felt more like switching neighborhoods.
I’ve been a software engineer for 20 years, but I never specialized in one area. I’ve worked the full stack - frontend, backend, embedded, platform engineering - with multiple languages and frameworks. That experience also included data projects, such as building an enterprise-scale analytics application for a logistics company that measured global shipping performance and costs. One thing remained the same across all those languages, frameworks, and projects: the mental model. It didn’t matter what the stack was, if the team and I applied best practices, built iteratively, and tested well, then the project was a success.
It’s Not a Different Job, It’s a Different Layer
When I moved to data engineering, sure, the tools changed. The nouns changed. Instead of talking about APIs, frontends, deploys, and app state, I started talking about pipelines, warehouses, orchestration, transformations, and data observability. But under all of that, a lot of the mental model felt weirdly familiar. The same mental model and best practices I used as a software engineer were immediately applicable to data engineering.
That was probably the biggest surprise.
When I first looked at modern data engineering, I expected something a little more... old school. More scripts. More manual work. More “someone runs this SQL and hopes for the best.” When I built out the data pipeline for the logistics company, we used SSIS with manual testing and virtually non-existent source control. It went against that mental model I had developed over the years.
But modern data engineering is actually pretty close to software engineering in all the ways that matter. You’re still building systems. You’re still thinking about reliability, maintainability, testing, environments, deployment, debugging, and how not to ruin production on a Friday afternoon.
And maybe most importantly, you’re still working in source control.
That part really hit me. A lot of the newer data stack is built around workflows software engineers already understand: Git branches, pull requests, CI/CD, code review, testing, promotion across environments, and reproducible deployments. That’s a huge shift from the old stereotype of data work being this mysterious pile of notebooks, one-off queries, and tribal knowledge.
This is where the idea of DataOps starts to make sense. If DevOps brought engineering discipline to software delivery, DataOps is basically that same energy applied to data systems. You want changes to be versioned. You want tests. You want automation. You want a clean path from development to production. You want fewer “who changed this table?” moments and more confidence that your pipelines won’t quietly wreck downstream reporting.
That was one of the biggest “oh, I get it now” moments for me. Data engineering isn’t some side quest away from software. It’s increasingly just software engineering aimed at data problems.
And that’s exactly why companies like Matia make sense. If modern data teams are expected to operate with the same discipline as software teams, versioning changes, managing deployments, monitoring reliability, understanding downstream impact, and keeping governance tight, then they need tooling that supports that reality. Matia brings a lot of those pieces together by helping teams manage data movement, monitor quality, trace lineage, and understand how data is actually used across the stack, without forcing them to stitch together a dozen disconnected tools.
The Modern Data Stack Feels Surprisingly Familiar
The ecosystem feels familiar too. This is a very imperfect analogy, but I find it useful:
In frontend engineering, there are a few big anchors that shape how you think about the stack. React, Angular, Vue, whatever. Once one of those is in place, a whole ecosystem starts to form around it. Then you add the usual supporting cast, stuff like routing, state management, data fetching, component libraries, build tooling. Some tools become almost default choices, even if they’re not technically mandatory.
Data engineering feels a lot like that.
You’ve got big anchors like Snowflake and Databricks. Those aren’t exactly the same kind of thing as React or Vue, but they play a similar role in the sense that they become central platforms around which the rest of your workflow starts to organize itself. Once a team commits to one of those, a whole toolchain tends to follow.
And then you’ve got tools like dbt, which kind of reminds me of the “everyone ends up using this eventually” category in frontend. Not because it’s the only answer, but because it gives structure to a problem space that gets messy fast. It brings order to SQL transformations in the same way a good frontend library brings order to state or data fetching. It gives teams conventions, repeatability, and a shared way to work.
That was another thing I learned pretty quickly: the hard part usually isn’t writing one transformation. The hard part is making hundreds of them understandable, testable, reviewable, and safe to change over time.
Which, again, is a very software engineering problem.
Same Engineering Instincts
There are differences, of course.
Data has a nastier relationship with reality than a lot of application code does. In software, if a function gets the wrong input, maybe a feature breaks. In data, if upstream data is late, malformed, duplicated, missing, or defined differently than you expected, the problem can quietly ripple everywhere. Dashboards drift. Metrics stop matching. Models degrade. People make decisions based on bad information.
So one lesson I learned fast is that data engineering has a lot of “systems programming for ambiguity” energy. You’re not just building logic. You’re constantly negotiating with weird source systems, incomplete assumptions, and business definitions that absolutely sounded settled until five minutes ago.
That part can be chaotic, but it’s also what makes it interesting. You’re not just shipping code. You’re building trust. The end product isn’t always a UI or an API. Sometimes it’s a table, a model, a metric, or a pipeline that other people depend on to understand what’s happening in the business. That’s a different kind of product surface, but it is still a product surface.
And that might be the simplest way I’d explain the shift now:
In software engineering, you’re often building experiences directly for users. In data engineering, you’re often building the systems that make those experiences, decisions, and insights possible.
Different layer, same engineering instincts.
The other thing that stands out to me now is how thin the line has gotten between software engineer and data engineer. It used to feel like these were pretty separate identities. Now, not so much.
Modern data teams use source control, CI/CD, testing, infrastructure automation, code review, reusable components, and platform thinking. Software engineers are increasingly expected to understand analytics, event streams, data models, and AI-adjacent workflows. And with AI showing up everywhere, clean and meaningful data suddenly matters even more. Models are only as useful as the data behind them, and that means the people who can build understandable, reliable data systems are in a very good spot.
So if you’re a software engineer wondering whether data engineering is a huge leap, I don’t think it is. It’s a shift, for sure. You’ll learn new tools, new patterns, and a new set of failure modes. But the core instincts, thinking in systems, designing for change, using source control, automating what should be automated, and making things reliable for other people, transfer over surprisingly well.
The line between software and data engineer has never been thinner.
And with AI raising the stakes on having clean, understandable, meaningful data, this might be one of the best times to make the jump. That shift is exactly what platforms like Matia are built for, bringing structure and trust to modern data workflows.
If you’re a software engineer who’s been thinking, “maybe I should get deeper into data,” I’d say go for it. The gap between the two worlds is smaller than ever, and I’m figuring that out in real time through my work with Matia. If that sounds like your kind of thing, follow along as I keep digging deeper into data engineering, DataOps, and the tools shaping this space. Matia is growing quickly, we’ve got a lot in the works, and I have a feeling the next chapter is going to be a fun one.
We launched out of stealth just over a year ago. Since then, we've appeared in four consecutive G2 report cycles, and each time we've come back with more coverage and higher rankings.
This spring, we earned 34 badges across 27 reports. Four cycles in, the trajectory has been consistent: more categories, higher rankings, and a broader base of customers leaving reviews. The jump from our first cycle to now isn't just a bigger number; it reflects customers in more segments, using more of the platform, and choosing to say something about it.
That last part matters. G2 reviews are voluntary. Nobody's asking customers to do it. When they do, it usually means something actually changed for them.
Matia's Spring 2026 G2 Recognition
Here's where we landed this quarter:
High Performer in the Grid Report for ETL Tools
#1 Usability Index for Reverse ETL
#1 Mid-Market Usability Index for Data Extraction
First-ever recognition in Data Observability, a new category milestone for Matia
Across ETL, Reverse ETL, Data Extraction, Data Replication, and now Data Observability, we're showing up in more of the categories data teams actually evaluate, and scoring higher within them.
Our First G2 Appearance in Data Observability
This is the one we're most excited about. Showing up in Data Observability for the first time reflects something we've been building toward: Matia isn't just a pipeline tool. It's a platform where teams can move data and actually understand what's happening with it.
Ingestion, reverse ETL, catalog, observability — these things work better together. Customers are starting to use them that way, and the G2 recognition in this category is an early sign of that.
Why Usability Keeps Coming Up
Ranking #1 in Usability for Reverse ETL and #1 in Mid-Market Usability for Data Extraction is something we're proud of, partly because usability is genuinely hard to get right in data tooling. It's easy to build something powerful. It's harder to build something powerful that people can actually figure out on day one.
We hear from customers pretty regularly that they migrate their integrations faster than expected or their data syncs faster because of Matia’s parallel syncs. That's what we're going for.
Support That's Actually Fast
A lot of early-stage companies say their support is great. It's almost a given at this point. But there's a difference between saying it and being able to show it.
Our median first response time is under 2 minutes. Across the board. When something breaks or a customer has a question, they hear back fast, from someone who actually knows the product.
That shows up in G2, too. Our support scores rank among the highest in every category we're listed in. Customers notice when help arrives before they've had a chance to get frustrated, and they tend to mention it.
What Customers Are Saying
The numbers are useful, but the reviews tell you more. A few things customers said this quarter:
What we like most about Matia is the visibility it provides into our data processes and pipelines. It gives us a clear understanding of how data is flowing, which helps a lot with troubleshooting and validation.
"Beyond the product itself, one of the things we value the most is the closeness and support from the Matia team. They are very responsive and hands-on when helping us resolve issues, clarify questions, or explore new use cases and projects. That level of partnership makes a big difference.” - Anonymous, Mid Market User
“Matia provides exceptional support. Their team is not only prompt and reliable, but also proactive in making sure our needs are met. This is especially valuable given the critical nature of our data connections with them. Whenever we’ve needed new connectors, they’ve been able to build and deliver solutions quickly, which makes working with them both efficient and stress-free.” - Lindy H, Mid-market Analytics Engineer
What This Quarter Actually Tells Us
Each G2 cycle is a snapshot of where you are with customers. This one shows a wider footprint, higher rankings, and a new category, all within a year of launching. That's the kind of momentum that's hard to fake; it comes from customers who are seeing results and taking the time to say so.
We're moving quickly, but not in a way that leaves customers behind. Our roadmap is shaped by conversations with the people using the product, not by what looks good on a features page.
A Note of Thanks
To our early customers: genuinely, thank you. You gave us feedback when the product was still rough around the edges, and a lot of what's working well now came directly from those conversations.
To everyone who's joined more recently: we're glad you're here, and we're paying attention to what you need.
And to the team: 34 badges is a number that shows up in a blog post. What it actually represents is a lot of quick responses, hard conversations, and problems solved alongside customers. That's what we're proud of.
What's Next
Spring 2026 is a good quarter to look back on. But we're already heads-down on what comes next, and if the last 18 months are any indication, the next G2 cycle will have a few more surprises.
When a dashboard breaks or an AI model starts producing unexpected results, data teams face the same frustrating question: where did this go wrong? Without lineage, you're left playing detective, checking dbt models, querying warehouse logs, asking around to see who changed what. By the time you trace the issue back to its source, stakeholders are already losing trust.
The problem isn't just about fixing things faster. It's about understanding your data infrastructure well enough to make changes confidently. Before you deprecate a table, refactor a dbt model, or modify a schema, you need to know exactly what depends on it. Without that visibility, every change feels risky.
At Matia, we've heard this from data teams consistently: "We need to see how our data actually flows." Not after the fact, not inferred from stale metadata, but captured in real time as data moves through data pipelines, without logging into multiple tools.
So naturally, we did what we do best, and built it.
Today, on the heels of our Series A Announcement, we're launching data lineage in Matia, end-to-end visibility into how data flows from source systems through dbt transformations to every downstream destination. With column-level precision and native dbt integration, you can trace any metric back to its source, understand what breaks when you make changes, and debug production issues in minutes.
Why Most Lineage Tools Fall Short
Most lineage tools work the same way: they reconstruct relationships after the fact by parsing SQL, scraping metadata from your data warehouse, or stitching together information from disconnected systems. The problem with this approach is that it's always playing catch-up. By the time lineage is generated, it's already out of date. And because these tools don't own any part of your data pipeline, they can only infer relationships; they don't actually know how data moved.
Matia is different. Because we own the ingestion layer and integrate natively with dbt, we capture lineage at execution time, as data actually flows through your pipelines. We don't infer lineage, we record it. This gives you column-level accuracy with zero manual configuration.
How Lineage Works in Matia
Matia's lineage shows you exactly how data moves through your stack:
Trace Backward to the Source
Start at any dashboard, metric, or AI model and trace backward through every transformation to the original source table. See which dbt models processed the data, what transformations were applied, and where the data originated.
Understand Forward Dependencies
Before you make a change, see exactly what depends on it. Deprecating a table? Matia shows you every dbt model, dashboard, reverse ETL sync, and ML pipeline that consumes that data. You'll know the blast radius before you ship.
Column-Level Precision
It's not enough to know that "Dashboard X uses Table Y." You need to know which specific columns flow through which transformations. Matia traces individual columns through your entire data pipeline, from customer_id in your Postgres database through dbt aggregations into the revenue metric on your executive dashboard.
Native dbt Integration
Matia automatically captures lineage from your dbt project. No manual tagging, no configuration; just connect your dbt instance and lineage updates in real time as your models change. See transformation logic, execution history, and dependencies directly in the lineage view.
Unified Operational Context
When you're investigating an issue, you don't want to jump between tools. Matia consolidates lineage with observability metadata including execution logs, data quality test results, freshness indicators, and row counts. Click into any node to see the full context without leaving the lineage view.
Real-World Use Cases
Before You Ship: Impact Analysis
You're refactoring 20 dbt models to improve performance. Before you deploy, Matia shows you exactly which dashboards, reverse ETL syncs, and downstream models depend on those tables. You identify two customer-facing dashboards that would break and adjust your plan accordingly. Ship with confidence instead of crossing your fingers.
During Incidents: Root Cause Analysis
A revenue dashboard is showing anomalous numbers. You trace the lineage backward and see that a dbt model failed its data quality checks three hours ago. The model depends on an upstream table that had an unexpected schema change. You identify the root cause in minutes, fix it, and communicate the issue to stakeholders with full context.
For Compliance: Data Provenance
Your compliance team needs to document exactly how customer PII flows through your systems for a SOC 2 audit. Matia's lineage provides an auditable trail showing every transformation, who has access, and where sensitive data ends up. Generate compliance reports with one click instead of weeks of manual documentation.
For AI/ML: Model Debugging
Your ML model's predictions shifted unexpectedly. You trace lineage from the model features back to source tables and discover that an upstream data pipeline changed its logic. The feature engineering is correct, but the input data changed. You pinpoint the issue in minutes instead of days of investigation.
Built Into the Platform
Lineage isn't a separate tool you need to integrate. It's built into Matia's unified data platform. The same system that ingests your data, monitors pipeline health, and tracks data quality also captures lineage automatically. No additional setup.
This integrated approach means lineage works alongside observability. When you're investigating a data quality issue, you see lineage and execution metrics in the same view. When you're assessing the impact of a change, you see dependencies and freshness indicators together. Everything you need is in one place.
What's Next
Data lineage in Matia is available now for all customers. If you're already using Matia for ingestion or observability, lineage is automatically enabled, just navigate to any table or dbt model to see its dependencies.
We're continuing to expand lineage capabilities throughout 2026. Upcoming releases will include:
Enhanced AI-powered lineage queries (ask questions in natural language)
Cross-platform lineage for multi-warehouse architectures
Lineage-based data cataloging and discovery
Advanced impact analysis for breaking changes
If you're not yet a Matia customer and want to see how lineage can help your team move faster with more confidence, book a demo or start a trial.
For existing customers: lineage is live in your account now. Check out our documentation to learn how to make the most of it, or reach out to your customer success manager with questions.
It’s Launch week at Matia. Yesterday, we announced Matia’s Series A funding. Today, we’re releasing role based access control (RBAC).
If you're a data leader, access control is probably one of those things you think you have handled until you don't. Someone requests access to production data. You check the warehouse, the BI tool, maybe dbt. You grant permissions in three places, document it somewhere, and move on. It works, until your team scales to 50 people, you're deploying AI models that touch customer data, and you realize nobody actually knows who has access to what.
The problem compounds as organizations adopt AI. Every new model, every experimentation workflow, every pipeline creates new access requirements. Data teams become bottlenecks, fielding constant requests. Security teams lose visibility into who's accessing sensitive data. And without centralized control, every tool becomes its own access silo, making compliance audits a nightmare.
At Matia, we built our unified data operations platform with a different philosophy: access is foundational infrastructure.
If you're new to RBAC or want a deeper dive into how it works, we've written a comprehensive guide on RBAC for data teams.
RBAC Capabilities in Matia
Matia's RBAC gives you centralized access management across your unified data platform. Define roles once, aligned to how your organization actually operates, not how individual tools happen to work.
Unified User Management
Manage all users in a single interface. Centralized onboarding and deprovisioning means you invite users, assign roles, and revoke access from one place in the Matia UI. No more jumping between tools to grant permissions or wondering if you've fully removed access when someone leaves.
Standard Role Templates
Matia provides predefined roles for each pillar of the platform: Integrations, Observability, and Catalog. Each role is broken down to CRUD permissions (Create, Read, Update, Delete), packaged into standard roles that reflect real job functions.
User and Role Detail Views
See assigned roles and status for any user at a glance. Understand exactly what permissions each team member has, which features they can access, and whether their account is active or pending. No guesswork, no spreadsheets tracking who has access to what.
Streamlined User Invitations
Invite new users and assign roles in a streamlined workflow. Onboarding a new analyst takes seconds: send the invite, select their role, and they're ready to work. No manual configuration across multiple systems.
Audit Logs
Track all user and role modifications with comprehensive audit logs. When your compliance team asks who changed permissions or when access was revoked, you have a complete history. Every change is logged automatically for SOC 2, GDPR, and HIPAA compliance.
Role-Based Feature Access
Users only see and interact with features relevant to their assigned roles. An analyst doesn't see pipeline configuration options. A pipeline engineer doesn't get buried in catalog metadata they don't need. The interface adapts to the user, reducing complexity and preventing accidental modifications.
API Access to RBAC
All RBAC features are available via API. Automate user provisioning, integrate with your existing identity management systems, or build custom workflows. Programmatic access means RBAC can scale with your organization's automation requirements.
Real-World Use Cases
AI Workflow Governance
As AI initiatives expand, more team members need access to the data pipelines, integrations, and metadata that power models. Before RBAC, teams often granted broad platform access just to keep work moving, increasing the risk of accidental changes to production workflows. With Matia RBAC, organizations define clear roles that control who can configure, modify, and operate AI-related data workflows inside the Matia platform. Data scientists can explore lineage, monitor freshness, and understand upstream dependencies, while only designated roles can change integrations, schedules, or production settings. This keeps experimentation fast while protecting production-critical data operations, with every change governed by role and fully logged.
Compliance Audit Preparation
When compliance or security teams need to understand who can modify production data workflows, answers are often fragmented across tools and internal documentation. With Matia RBAC, teams get a centralized view of platform-level access and permissions across integrations, observability, and catalog. Audit logs track user invitations, role assignments, permission changes, and access revocations over time. During SOC 2 or internal audits, teams can quickly demonstrate who had access to sensitive platform capabilities, when that access changed, and who made those changes, without relying on spreadsheets or manual reconstruction.
Rapid Team Scaling
Your data team is growing from 15 to 50 people this quarter. Without RBAC, each new hire means manually configuring permissions in six different tools. With Matia's RBAC, you assign new hires to predefined roles on day one. They get exactly the access they need across the entire platform, nothing more, nothing less. Your data engineers get their time back.
Built Into the Unified Platform
RBAC isn't a separate identity management system you need to integrate. It's built into Matia's unified data operations platform. The same system that ingests your data, captures lineage, monitors pipeline health, and tracks data quality also manages access control natively.
This integrated approach means RBAC works alongside every other capability. When you're viewing lineage, you see access controls in context. When you're investigating a data quality issue, you know exactly who has permission to modify the affected pipelines. When you're assessing the impact of a change, you understand who will be affected. Security and operations aren't separate concerns; they're unified.
For enterprise teams building AI at scale, this integration is critical. AI amplifies both value and risk. Without strong access controls, every model deployment, every data pipeline, every experimentation workflow becomes a potential compliance incident. RBAC gives you the governance foundation to scale AI confidently.
What's Next
RBAC in Matia is available now for all enterprise customers. If you're already using Matia for data operations, RBAC is enabled in your account. Navigate to settings to configure roles and permissions for your team.
We're continuing to expand RBAC capabilities throughout 2026. Upcoming releases will include:
Matia Resource-Based Permissions - Fine-grained permissions on specific resources
Temporary Permissions - Time-limited access that auto-expires
Batch User and Permission Management - Bulk operations for scale
Natural Language Policy Authoring - Conversational permission management
For existing customers: RBAC is live in your account now.
If you're not yet a Matia customer and want to see how RBAC can help your team scale AI without losing control of your data, book a demo. We provide a two week trial so you can test it out.
For existing customers: RBAC is live in your account now.
This round brings our total funding to more than $31 million and marks an important milestone in our mission to build the AI-native data infrastructure that modern data teams need and build towards the vision of creating an AI data engineer.
A lot has happened since we emerged from stealth fifteen months ago. We've grown more than 10x. We've earned the trust of data teams at companies like Ramp, Drata, Gloss Genius, HoneyBook, and Lemonade.
And we've learned something critical: AI isn't just another feature to bolt on. It's a fundamental shift in how data infrastructure needs to be built, and we’re ready to tackle that head on.
The AI paradox: everyone's building for it, few are building for it correctly
Every company is racing to build AI features. But here's the uncomfortable truth: you can't build reliable AI on unreliable data infrastructure.
I see this everywhere. Teams spend months training models, tuning prompts, and optimizing performance, only to realize their biggest bottleneck isn't the AI. It's the data layer underneath it. Quality issues that only surface after the model is in production.
The AI era demands more from data infrastructure, not less. It demands real-time reliability, end-to-end observability, and the kind of unified context that fragmented point solutions simply can't provide.
That's why we built Matia unified from day one.
Unified isn't a marketing term. It's a necessity
When we started building Matia, we made a deliberate choice: bring data ingestion, reverse ETL, observability, and catalog together in a single platform. I had lived the problem as disparate data tools as a Head of Data at Pangaea. My team was spending hours stitching together tools, and still not complete answers.
The market is proving this thesis faster than we expected. Since January 2025 alone, we've watched more than a dozen point solution vendors consolidate through M&A. Companies that built their business on a single pillar are now scrambling to acquire their way into broader platforms and major data ecosystem creators are leaning in. Data warehouses like Snowflake are buying ingestion tools. Catalog companies merging with governance solutions.
Bolting together products built on different architectures, with different data models, and different assumptions doesn't give you a unified platform. It gives you a collection of tools with shared branding.
We built unified from day one, but it wasn’t just about reducing tool sprawl. Though our customers report up to 78% lower total cost of ownership compared to stitching together separate systems.
When your ingestion layer interacts with your observability layer, you can detect anomalies earlier in the data lifecycle. When your catalog understands lineage across the entire pipeline, impact analysis becomes automatic. When everything shares the same foundation, you get the kind of operational clarity that AI systems need to work reliably.
Ofir Ventura, Data & ML Manager at Lemonade, put it well:
"At our scale, data reliability matters as much as application reliability. Matia has helped our teams streamline how we move and operate data by providing a single platform we can run day to day as our data needs continue to grow."
Where data engineering becomes AI-native
Being AI-native isn't about how you wrap AI into your product. It's about whether your system was architected to support AI at all.
With a unified foundation in place, we're now building something that couldn't exist on fragmented infrastructure: an AI data engineer that can autonomously handle pipeline creation, anomaly detection, impact analysis, and remediation.
It's about giving teams of any size organization the ability to operate at the scale and reliability level they need. This way, a five-person startup can have the same data confidence as a five-hundred-person company.
Matia will become the Cursor for data engineering. The same way Cursor helps developers move 10x faster, Matia helps data teams build and operate better infrastructure without losing control. Matia will provide unified architecture, confidence and context to the rest of their data infrastructure.It’s a lofty vision, but I’m confident this team can make it a reality.
What comes next
Broader coverage across the data lifecycle. And continued investment in the people and the unified foundation that makes it all possible.
We're scaling our teams in both North America (GTM) and Israel (R&D). And we're doubling down on the vision that's driven us from the beginning: making world-class data operations accessible to teams of any size.
I also want to take a moment to say thank you to the incredible Matia team, our partners, our customers, and our investors.
Danielle Ardon Baratz, a Partner at Red Dot Capital Partners and someone in the venture community I’ve long admired, led our Series A and has been an exceptional partner from the start, bringing deep conviction, thoughtful advice, and a willingness to open doors through key introductions. We were also fortunate to have Gideon Hayden at Leaders Fund alongside us, the kind of partner every founder hopes for, experienced, deeply engaged, and consistently generous with his time, perspective, and support.
I’m also immensely grateful to all of our investors, including Omri Krigel from Secret Chord Ventures and Haleli Barath from Cerca Partners, who have been incredible partners throughout our growth.
And I’m especially proud that every single one of our seed investors chose to double down. That continued belief and conviction in Matia means more than we can put into words.
I also want to thank my brother and co-founder, Geva Segal. You always hear sibling co-founders say when they were younger, they never could have imagined where they would be. Well, when we were younger, we knew exactly that we would be starting a company together. And it's even better than I could have imagined.
If you're a customer that’s building with Matia, thank you for trusting us with your data infrastructure. If you're considering it, I'd encourage you to reach out and see what unified, AI-native data infrastructure can do for your team.
If you're into the idea of building the future of data infrastructure, we're hiring. We are planning to double the team this year.
This is just the beginning. The AI era demands data infrastructure designed for its requirements from the ground up. That's the foundation we've laid, and that's the future we're building at Matia. With that foundation, the AI data engineer can do its job.
Thanks for being part of our story.
And if you think we’re going to take the rest of the week off, you don’t know Maita. Stay tuned for some more launches this week on Linkedin.
Connectors Used: PostgreSQL, Stripe, Salesforce, Intercom, Google Sheets, Google Analytics, Google Ads, Xero, Google Play, Apple App Store
The Company
Lopay provides comprehensive payment solutions for small businesses across the UK and US., Lopay offers both in-person and remote payment processing through card terminals, tap-on-phone and payment links.
Beyond basic payment processing, Lopay delivers value-added services including instant payouts, cash advances, and loyalty rewards programs—all designed to help small merchants manage their business finances more efficiently.
Steve Callery, Chief Data Officer and part of Lopay's founding team, manages the entire data infrastructure, from data engineering and warehousing to all financial operations. Without a dedicated data team, efficiency and the right tools are critical to Lopay's ability to scale.
"Moving from two tools to one platform wasn't just about cost savings, though 40% is nothing to sneeze at. It was about having a single source of truth for data movement, where everything just works. No more context-switching, just straight results."
The Challenge
For years, Lopay relied on a legacy ETL player for data ingestion and a separate tool for reverse ETL. Cost pressures mounted year after year as the vendor increased pricing with each contract renewal.
As Lopay's data needs grew, so did the complexity:
Rising costs: Annual price increases from their legacy ETL provider made renewal decisions increasingly difficult
Fragmented workflow: Managing data movement across two separate platforms created unnecessary complexity for a one-person team
Limited scalability: As the sole data engineer managing both ETL and reverse ETL, Steve needed a unified solution that could grow with the business without requiring additional headcount
Additionally, they were experiencing inconsistent support with their previous ETL solution. The breaking point came when Lopay's two-year unlimited consumption contract expired, and projected costs for separate ETL and reverse ETL solutions would spike significantly.
Lopay was hesitant to migrate due to the significant volume of connectors on the legacy ETL tool and the assumed complexity and timeline surrounding this.
The Solution
Matia offered a single platform for both ETL and reverse ETL, with key capabilities including:
Unified Data Movement: One platform to handle both ingestion from critical sources (production database, Stripe) and activation to operational tools (Salesforce, Intercom, Google Sheets)
Fast Migrations: Seamless migration support and clean, backward compatible schemas with legacy ETL tools made migrations seamless.
Reliable Stripe Integration: As a payment processing business deeply integrated with Stripe, reliable syncs of Stripe data to Snowflake were mission-critical, Matia delivered flawlessly
Responsive Support: The Matia team provided direct, honest answers without sales "guff" and resolved issues, often user errors, within hours
Future-Ready Capabilities: Built-in data catalog and end-to-end lineage capabilities positioned Lopay for team expansion without additional tooling
"It's a dream to have Matia as a one stop solution now where I can just go in, I can just do all the data movement in one place with no issues." - Steve Callery, Chief Data Officer, Lopay
The Impact
Since consolidating onto Matia, Lopay has achieved measurable improvements:
40% Total Cost Reduction: By replacing two separate tools with Matia's unified platform, Lopay reduced their overall data movement costs by an estimated 40%.
10% Lower Snowflake Costs: Optimized data ingestion resulted in approximately 10% reduction in Snowflake warehouse costs, even as data volumes increased
Efficient GTM Operations: Sales teams now receive up-to-date merchant trading data in Salesforce to support upselling and reactivation efforts; support teams access critical customer context in Intercom. Matia also provided better anomaly alerting, to help things run smoothly, compared to their previous reverse ETL solution
100 integrations Migrated with Zero Downtime: The proof of concept and migration process worked exactly as promised, with no surprises or hidden limitations. Matia migrated 100 + integrations across 15 different connectors in a few days time.
Rapid Development Velocity: When Lopay needed specific features before going live, Matia delivered them in days or weeks, not months
"The speed of development's been very impressive... [features] that I needed before go live, they've just gone away and smashed those out in days or weeks." - Steve Callery, Chief Data Officer, Lopay
Looking Ahead
As Lopay prepares to expand Steve's team in 2026, Matia's data catalog and lineage features will become increasingly valuable. These capabilities will help new team members understand data dependencies and downstream impacts, knowledge that currently dispersed across various documents.
The partnership approach Matia has taken gives Steve confidence that as Lopay's needs evolve, the platform will evolve with them. For a lean fintech team competing against industry giants, that reliability and responsiveness makes all the difference.
In a recent webinar, Mitchell Cooper walked through PayIt's data architecture and the technical decisions behind their hybrid pipeline approach. PayIt is a payment platform that partners with city, municipal, state, and county governments to modernize payment systems, from DMV license renewals to outdoor permits.
Following their acquisition of S3 (now PayIt Outdoors), the team needed to integrate new data sources and modernize their approach. The session offered practical insights into their architecture, implementation details, and the results they've seen.
Here are the key technical takeaways.
The Architecture: A Two-System Approach
Mitchell shared PayIt's deliberately split data pipeline architecture that separates internal platform data from third-party integrations. The architecture diagram from the webinar shows how they've organized data flows:
System 1: Meltano for Internal Platform Data
All internal platform data flows through Meltano, handling complex NoSQL data structures from PayIt's payment processing systems.
System 2: Matia for Third-Party Connectors and Reverse ETL
The second system handles all external integrations (ingestion/ETL) and data activation (reverse ETL):
ETL: Data Sources to Snowflake
The system ingests data from external sources into Snowflake:
Salesforce
Pendo
SQL Server databases from the PayIt Outdoors acquisition
Reverse ETL: Snowflake to Operational Systems
The system activates data from Snowflake back to operational tools:
Reverse ETL from Snowflake back to Salesforce
Enriched customer data flowing to operational systems
The Migration: From Stored Procedures to Managed Pipelines
Before implementing this architecture, PayIt's third-party integrations ran on Fivetran with downstream transformations handled by stored procedures in Snowflake. Mitchell described several challenges with this approach:
Brittleness: Pipelines were hard to maintain and would break frequently
CDC Limitations: After migrating to Snowflake, the team needed better Change Data Capture capabilities.
Salesforce Formula Fields: Fivetran wasn't syncing Salesforce formula fields properly, which meant critical calculated values weren't available in the warehouse.
Technical Implementation: Setting Up Bidirectional Salesforce Sync
During the webinar, Mitchell walked through a live demo of setting up the Salesforce integration, demonstrating the full pipeline pattern: ingest from Salesforce → transform in Snowflake → activate back to Salesforce.
ETL: Salesforce to Snowflake
The setup process highlights several features Mitchell found valuable:
Environment Tagging: The ability to tag connections makes it easy to see which integrations are associated with each environment, like production.
Documentation: The built-in documentation on the right side of the interface was helpful for getting everything set up as a new user.
SQL Script Generation: As Mitchell demonstrated, "You can see as we're walking through here, each one of those creates a SQL statement, so you just have this super handy script that you can drop into Snowflake and run."
Bulk Selection: For databases with many tables, "This is incredibly handy, especially in some of our SQL Server things, where we have literally hundreds of tables."
Reverse ETL: Snowflake to Salesforce
The reverse ETL setup involves:
Data Source: A Snowflake table or view containing enriched customer data.
Mapping Strategy: Field mapping supports both auto-mapping and manual selection. As Mitchell showed, "You could do auto mapping, or you can come in and select any of these fields that you want that would make sense."
Sync Modes: The platform supports different sync modes, though the specific options depend on the destination system.
The One-Record Test Pattern
Mitchell highlighted this as one of the most valuable features:
"You can actually run a test here. And this will sync a single record from Snowflake up to Salesforce. And that, for me, has been really handy. You save it, you do a connection, it connects okay, but you don't know if it's actually working. So being able to do just one test of one single record to get that quick feedback is super helpful. I know in some other tools you have to sync entire data sets and who knows how long that takes. Just having that one single record test is an immense time saver."
Column-Level Lineage
Mitchell also demonstrated the observability features:
"Being able to expand on all these tables, all of the columns, seeing that lineage, really from beginning to end is a pretty awesome feature. You can click on any of those columns that are being moved through each of those steps, and it'll show you that connection there."
Performance and Reliability Improvements
Mitchell shared some early results from the first month of running the new architecture:
After one month: 38% cost reduction, 85% reduction in time spent chasing errors, and sub-5 minute response time from the platform team.
Cost Efficiency
"In addition to being incredibly easy to set up, we've seen some cost savings. So about 38% cost reduction for us. So, you know, while the contract pricing that we paid is the same, we are getting so many more MAR with Matia than with Fivetran. And so that's pretty awesome. I know my boss loves that."
Mitchell also noted the elimination of surprise costs, controlling for extraneious variables.
Operational Overhead
"We've got less errors. I've gotten hardly any notifications that we have had any real issues pop up with Matia as opposed to Fivetran. And if I'm being completely honest, that 85% reduction in time spent chasing errors is indicative of how awesome Matia has been at being proactive with any issues that have arisen."
Mitchell explained the proactive support: "So we've definitely had issues, but by the time I get in and I'm looking at Matia they've already been resolved or I've already got a message telling me what the issue is and that they're already working on it. And so, for me, there's a lot of peace of mind knowing that I don't really have to do a lot of that work, that that's already being done. And I can focus my efforts on setting up or maintaining the other pipelines that we have."
Support Response Time
"I will be honest, I was a little skeptical when Matia told me that it was a sub-5 minute response time, but I can tell you it is accurate, which is truly impressive. And as a client, I really appreciate it."
"Matia has definitely made my life easier as a data engineer having to maintain these pipelines."
The webinar offered a practical look at how data teams can approach hybrid architectures when dealing with diverse data sources and operational requirements. Mitchell's willingness to share both the technical details and the actual results made this a valuable session for anyone managing similar complexity. View the full webinar here or at the top of this post.
We're kicking off 2026 with a strong set of product updates from Matia. These releases focus on giving enterprise data teams the precision controls they need to manage observability at scale while expanding our connector ecosystem to unify even more of your data stack.
Before we dive into the details, if you want to see some of the biggest wins and highlights from 2025, check out our end-of-year recap video. It's a quick look at what we accomplished together last year.
Now, let's get into what shipped in December and January.
Enterprise Notification Upgrades
We shipped two major enterprise notification capabilities designed for teams managing data operations at scale: granular notification filtering and enhanced PagerDuty integration.
Granular Notification Control
Teams can now scope notification rules to specific databases, schemas, or tables instead of applying alerts universally. This means different teams only receive notifications for the assets they own, eliminating noise and ensuring the right people see the right issues.
Enhanced PagerDuty Integration
Data quality issues now flow directly into PagerDuty with full incident context. The integration supports bidirectional sync, automatically updating incident severity, acknowledgment status, and resolution state as issues evolve. This gives on-call engineers real-time visibility into data quality without switching platforms.
Expanded Connector Library
We've significantly expanded our connector ecosystem with nine new integrations spanning feature management, customer success, HR, identity, marketing, mobile analytics, and finance. These additions make it easier to unify data across your entire stack without building custom pipelines.
New Connectors
LaunchDarkly: Feature flag data, rollout metrics, and A/B test results for product teams
Gainsight: Customer success platform with Reverse ETL support for bidirectional data sync
Rippling: HR, payroll, and workforce management data for comprehensive people analytics
Okta: Enterprise identity and access management for security analytics
Mailchimp: Email marketing campaigns, subscriber activity, and engagement metrics
Apple App Store & Google Play: Mobile app analytics, downloads, and performance data
Email Connector: Automated ingestion of emailed reports and attachments
Xero: Accounting and financial data for revenue analytics and financial reporting
Jira Enhancement
We've updated the Jira connector to support flexible permission configurations. Organizations can now choose between automatic webhook registration or manual setup, enabling teams with strict security policies to maintain connectivity while meeting compliance requirements. This update includes non-admin mode support and ensures complete data capture regardless of permission level.
What's Next
All of these updates are live and ready to use today. From enterprise-grade notification controls to expanded integrations across identity, feature management, customer success, HR, marketing, mobile, and finance, we're making it easier for data teams to build reliable, scalable data infrastructure that serves the entire business.
Looking ahead in 2026, expect more enterprise and AI capabilities, deeper integrations, and continued investment in making Matia the unified platform for data ingestion, reverse ETL, observability, and catalog management.
This month, we're launching three new connectors and a major update to our Jira integration that expands Matia's capabilities across feature management, customer success operations, HR systems, and project tracking. These integrations make it easier to monitor feature rollouts, activate customer data across your stack, centralize workforce management, and maintain secure compliance workflows,all from a single platform.
LaunchDarkly: Feature Flag Management & Experimentation
Sync feature flag data, rollout metrics, and experimentation results from LaunchDarkly to track feature adoption, analyze A/B test performance, and correlate feature releases with product metrics.
Who It's For
Engineering teams, product managers, and data analysts who need to combine feature flag data with user behavior, performance metrics, and business outcomes across their data warehouse.
Connect Gainsight with Reverse ETL capabilities to sync customer health scores, engagement data, and success metrics while activating warehouse data back into Gainsight for enriched customer profiles and automated workflows.
Who It's For
Customer success managers, account executives, and operations teams who want to unify customer data from multiple sources and trigger automated playbooks based on product usage, support tickets, and revenue signals.
Rippling: HR, Payroll & Workforce Management
Ingest employee data, payroll information, benefits administration, and time tracking from Rippling to build comprehensive workforce analytics and integrate HR data with operational metrics.
Who It's For
HR operations, finance teams, and business analysts tracking headcount planning, compensation analysis, and workforce productivity alongside departmental budgets and resource allocation.
Jira: Enhanced Connection Options for Security & Compliance
We've updated our Jira connector to support flexible permission configurations. Organizations can now choose between automatic webhook registration (with admin permissions) or manual webhook setup (with standard permissions), enabling teams with strict security policies to maintain Jira connectivity while meeting compliance requirements.
What's New
Non-admin mode: Connect to Jira without granting admin-level permissions
Manual webhook configuration: IT teams can register webhooks directly while Matia handles data synchronization
Complete data capture: Ensures deleted entities and lifecycle events are properly tracked regardless of permission level
Who It's For
Security teams, compliance officers, and IT administrators who need to maintain data completeness while adhering to organizational access policies and audit requirements.
What's Next
All three new connectors and the Jira update are live and ready to use today. From feature flag analytics to customer success activation and workforce management, we're making it easier to centralize the data that drives your business.
Want to see these connectors in action? Book a demo: we'd love to show you around.
As data teams scale, a solid observability strategy is critical for earning stakeholder trust. Proactive monitoring and alerting show that you're on top of data quality issues before they impact critical business decisions and functions. But notifications can backfire quickly. When every alert goes to everyone, the important stuff gets buried. The very system designed to build confidence can end up undermining it.
At Matia, we've heard this feedback consistently from enterprise customers managing hundreds of data assets across multiple teams. They need the visibility that observability provides, but with the precision and control that prevents notification chaos.
So we’re doing something about it.
Today, we’re announcing two powerful notification upgrades designed specifically for enterprise data teams: granular notification filtering and enhanced PagerDuty integration. These new releases give you the precision, control, and incident management capabilities that large-scale data operations demand.
Granular Notification Control
Previously, notification rules in Matia applied universally across all your data assets. If you set up a Slack alert for freshness anomalies, every single freshness issue across your entire data warehouse would trigger that notification. We set it up this way intentionally to make it easier for smaller data teams to set up notifications. However, while this all-or-nothing approach worked for smaller teams, enterprise organizations needed something more scalable.
Now, you can configure notification rules to apply only to specific data assets, databases, schemas, or even individual tables. This means your analytics team can receive notifications only for the customer-facing dashboards they own, while your data engineering team gets alerts exclusively for the pipeline assets they maintain.
How It Works
When creating or editing a notification rule, you'll now see an option to "Filter by data assets or tags." From there, you can:
Select specific assets: Choose individual Snowflake databases, BigQuery datasets, Databricks schemas, or S3 buckets
Target schemas or tables: Drill down to monitor only the data assets that matter to your team
Build custom notification scopes: Create different notification rules for different parts of your data infrastructure
The system intelligently handles coverage logic. For example, if you select a database, any schema changes, connectivity issues, or freshness anomalies within that database will trigger the notification. If you select a specific table for freshness monitoring, only issues with that table will alert your team.
In the video below, we set up a Slack notification to alert us to a specific channel when there are schema changes, connectivity issues or freshness and row count anomalies on our Snowflake dbt analytics table.
For teams already using PagerDuty for incident management, Matia's enhanced integration brings data quality and observability issues directly into your existing on-call workflows.
PagerDuty channels now appear at the top of all notification channel lists in Matia, making them easy to identify and select. More importantly, you can now configure PagerDuty notifications for specific integration events across your data pipeline.
When data quality issues arise (whether from failed integrations, incomplete data loads, schema changes, or freshness anomalies), Matia automatically creates incidents in PagerDuty with rich context about the affected resources, severity levels, and relevant details.
Intelligent Incident Updates Matia’s PagerDuty integration keeps incidents in sync with data quality issues. Here’s how it works:
Severity changes automatically update the PagerDuty incident with the new severity level
Issue acknowledgment in Matia reflects in your PagerDuty incident status
Issue resolution automatically resolves the PagerDuty incident, keeping your incident management system clean and accurate
This bidirectional awareness means your on-call engineers get accurate, real-time information about data quality issues without context switching between platforms, and that can be a life saver for a busy engineer.
Building Your Notification Strategy: Monitors + Alerts
These notification upgrades work seamlessly with Matia's granular monitoring capabilities. You can now enable auto-generated monitors for all tables in specific assets, or pick exactly which schemas should be monitored. This gives you end-to-end control: decide what to monitor, and decide who gets notified when issues arise.
For example, you can enable auto-monitoring for all tables in your Snowflake database but configure notifications so that only freshness issues in customer-facing schemas alert your on-call team through PagerDuty, while schema changes in dbt schemas simply notify your data analysts via Slack.
One thing that our customers told us is that they wanted more than just triggered email notifications. That’s why we built notifications to offer real-time integrations with Slack channels, PagerDuty incidents, and webhooks that can trigger custom workflows in your organization. These notifications are designed to integrate with how modern data teams actually work (whether that's a Slack channel where your team discusses issues, a PagerDuty rotation that ensures 24/7 coverage, or custom automation built on webhooks).
Built for Enterprise Scale
These new launches represent a significant step forward in Matia’s enterprise capabilities. We’re giving data platform teams the controls they need to run data observability at scale across hundreds or thousands of data assets, multiple teams, and complex organizational structures, with notifications that respect ownership and access boundaries through role-based access control.
If you’re managing data infrastructure at an enterprise level, granular notification control and enhanced PagerDuty integration will help you move from reactive firefighting to proactive, organized data quality management.
Stay tuned for more Enterprise capability drops in 2026.
Data teams are drowning in access requests. Every new hire needs permissions configured across Snowflake, dbt, Looker, Airflow, and half a dozen other tools. Every departing employee leaves a trail of orphaned credentials. Every compliance audit becomes an archaeological dig through fragmented permission systems.
The pressure is mounting. Gartner predicts that 80% of data and analytics governance initiatives will fail by 2027, primarily because they take rigid, centralized approaches that slow down business outcomes. Role-Based Access Control offers a different path: structured enough for security and compliance, flexible enough to enable data democratization.
Ask any data engineer about their least favorite part of the job, and "managing access requests" consistently ranks near the top. It's tedious, error-prone, and pulls talented engineers away from work that actually moves the business forward. RBAC transforms data access from an ongoing crisis into a manageable system.
This guide walks through everything data professionals need to know about role-based access control: how RBAC works, why it matters for modern data teams, and how to implement RBAC effectively across your data stack.
What is Role-Based Access Control (RBAC)?
Role-Based Access Control is a method of managing access to resources by assigning permissions to roles rather than individual users. Instead of granting Sarah from Marketing direct access to the customer database, you assign her the "Marketing Analyst" role, which comes with predefined permissions to access specific datasets, dashboards, and tools.
RBAC fundamentally changes how data teams think about access control. Rather than asking "what should Sarah be able to access?" you ask "what should a Marketing Analyst be able to access?" This shift from individual to role-based thinking is what makes RBAC scalable.
The Core Problem RBAC Solves for Data Teams
Modern data teams face an impossible triangle: they need to democratize data access for business users, maintain rigorous security controls, and comply with an expanding web of regulations, all while data volumes and tooling complexity explode exponentially.
Without proper access control through RBAC, data teams encounter:
Permission sprawl across platforms: Your data warehouse has one permission system, your BI tool has another, your data catalog has a third, and your orchestration platform has a fourth. A single analyst might need access configured in six different places. Managing these permissions individually becomes unsustainable as teams grow.
Compliance nightmares: When auditors ask "who has access to customer PII?" you spend days mapping permissions across systems, only to discover ex-employees still have access to production databases. Role-based access control creates the audit trails compliance requires.
Operational bottlenecks: Data engineers spend significant time handling access requests instead of building data products. New hires wait days or weeks to access the tools they need. RBAC implementation reduces these bottlenecks by standardizing the access provisioning process.
Security vulnerabilities: Developers have production access they don't need. Analysts can accidentally DROP TABLE in critical databases. Former contractors retain access months after projects end. RBAC enforces the principle of least privilege systematically.
Role-based access control addresses these challenges by creating a structured, repeatable system for managing data access at scale.
How RBAC Works: The Framework
RBAC operates on a simple four-layer model:
Users are assigned to Roles, which are granted Permissions to access Resources.
Let's break down role-based access control with a practical example. When Jessica joins your company as a Marketing Analyst:
Jessica (the User) is assigned to the "Data Analyst" role
The "Data Analyst" Role has been pre-configured with specific permissions
Those Permissions include read access to marketing schemas, query access to customer analytics tables, and view access to marketing dashboards
These permissions apply to specific Resources: your Snowflake marketing database, your Looker marketing folder, and your Matia connectors for ad platforms
In the diagram above, you can see the RBAC configuration for the Data Analyst Role. Jessica has read & query permissions, execute permissions, and limited write/modify permissions for workspace schemas.
When Jessica logs into your data stack, her user account is automatically recognized as having the Data Analyst Role. This role grants her three types of permissions, each connected to specific resources:
Read & Query Permissions give Jessica access to your Snowflake marketing database where she can SELECT data from customer analytics tables, as well as view and interact with marketing dashboards in Looker. She can also browse your data catalog to discover what marketing datasets are available and understand their definitions.
Execute Permissions allow Jessica to run pre-built dbt models that transform raw marketing data into analysis-ready tables. She can also trigger scheduled reports and refresh dashboards when needed, without having the ability to modify the underlying transformation logic.
Write/Modify Permissions are carefully scoped to only her personal workspace schema. This means Jessica can create temporary tables for her analysis work, save query results, and experiment freely without any risk of accidentally modifying production marketing data or impacting other users.
Notice what Jessica cannot do: she has no access to ETL tools like Matia (she doesn't manage data ingestion), she cannot modify production tables or delete data, and she has no administrative permissions to change configurations or manage other users.
This is the principle of least privilege in action. Jessica has exactly the access she needs to perform her job as a Data Analyst, nothing more, nothing less. . If she transitions to become a Data Scientist, you simply reassign her from the Data Analyst role to the Data Scientist role. Instantly, her access automatically expands to include feature stores for model training, ML platforms and notebooks, and experimentation schemas where she can build and test models, all without manually reconfiguring permissions across multiple systems.
RBAC vs. Other Access Control Models
Role-based access control isn't the only approach to access management. Understanding the alternatives clarifies why RBAC has become the standard for data teams implementing access control.
Access Control Model
How It Works
Best For
Limitations for Data Teams
Discretionary Access Control (DAC)
Resource owners grant access at their discretion
Small teams, simple file systems
Doesn't scale; inconsistent policies; difficult to audit
Mandatory Access Control (MAC)
System enforces fixed security classifications
Government, military applications
Too rigid for dynamic data environments
Attribute-Based Access Control (ABAC)
Access based on user/resource attributes and context
Complex, dynamic scenarios
Higher implementation complexity; harder to audit
Role-Based Access Control (RBAC)
Access based on organizational roles
Most enterprise data teams
Can become complex at scale; less flexible than ABAC
For most data teams, RBAC offers the right balance: more structured than DAC, more flexible than MAC, and more manageable than ABAC. Role-based access control provides the foundation that teams can build on as their access control needs mature.
Key Components of RBAC for Data Teams
Understanding role-based access control requires clarity on its four core components and how they work together in data environments.
Users and Roles in RBAC
In data contexts, RBAC users include data engineers, analytics engineers, data analysts, data scientists, BI developers, business users, data stewards, and executives. Each requires different access levels across your data infrastructure.
Roles are collections of permissions that align with job functions. Well-designed RBAC roles reflect how your organization actually works:
Data Engineer Role - Full access to development environments, read access to production, ability to create and modify pipelines, access to orchestration tools like Airflow
Data Analyst Role - Read access to curated analytics databases, query access to reporting tables, view and edit access to BI tools, no access to raw production data or PII without anonymization
Data Scientist Role - Read access to feature stores and modeling datasets, write access to experimentation schemas, access to ML platforms and notebooks
BI Developer Role - Read access to analytics databases, full access to BI development environments, ability to publish dashboards and reports
Business User/Viewer Role - View-only access to published dashboards, access to self-service BI tools with pre-built templates, no direct database access
The key to effective RBAC implementation is creating roles that are broad enough to avoid role explosion but specific enough to maintain least-privilege principles. Start with 5 to 10 core roles when implementing role-based access control, then expand as needed.
Permissions and Resources in RBAC
Permissions define what actions roles can perform in your RBAC system. In data environments, role-based access control permissions include:
Read/Query Permissions - SELECT statements on tables and views, ability to preview data, access to metadata
Create/Delete Permissions - CREATE TABLE, DROP TABLE, schema modifications
Execute Permissions - Run stored procedures, trigger pipelines and workflows, execute dbt models
Administrative Permissions - Alter system configurations, manage users and roles, access audit logs
The principle of least privilege in RBAC dictates that roles should have only the minimum permissions required to perform their functions.
Resources in data environments that role-based access control must protect include:
Data Warehouse Objects - Databases, schemas, tables, views, stored procedures
BI and Visualization Tools - Dashboards, reports, workbooks, published content
Data Pipelines - ETL Platforms, DAGs and workflows, orchestration schedules
Data Catalogs - Metadata entries, data lineage graphs, data quality rules
Comprehensive RBAC must span all these resource types across your entire data stack.
Why Data Teams Need RBAC
The case for role-based access control extends beyond theoretical security benefits. For data teams, RBAC addresses concrete, costly operational problems.
Security and Compliance Through RBAC
Prevent Unauthorized Access: Role-based access control ensures that users can only access data appropriate for their role. A customer service representative doesn't need access to financial forecasting models. A marketing analyst doesn't need personal health information. RBAC enforces these boundaries systematically.
Audit Trails and Accountability: When every user's permissions are defined through roles in your RBAC system, auditing becomes straightforward. Instead of tracking thousands of individual permission grants, you audit role definitions and role assignments. When something goes wrong, RBAC lets you quickly identify who had access and when.
Regulatory Compliance: Modern data regulations require demonstrable access controls that RBAC provides. GDPR mandates data minimization and documented access to personal data. SOC 2 requires access control policies and regular access reviews. HIPAA demands audit logs and role-based restrictions for protected health information. CCPA requires businesses to track and document data access.
Without role-based access control, proving compliance means manually documenting individual permissions across platforms, a nearly impossible task at scale. With RBAC, your role definitions become your compliance documentation.
Operational Efficiency With RBAC
Reduce Permission Management Overhead: Without role-based access control, onboarding requires configuring access in Snowflake, Databricks, Looker, Tableau, Mode, dbt Cloud, Matia, and potentially a dozen other tools, each with different interfaces. With RBAC implementation, onboarding means assigning a role, and downstream permissions flow automatically.
Faster Onboarding and Offboarding: New hires become productive on day one instead of day five with proper RBAC. When employees leave, one role revocation in your role-based access control system ensures they lose access everywhere instantly, critical for security and compliance.
Self-Service Within Guardrails: Properly implemented RBAC enables data democratization without chaos. Business users can access pre-approved datasets and dashboards without ticket queues. Role-based access control shifts data teams from gatekeepers to enablers.
Reduced Bottlenecks: Without role-based access control, data engineering teams report spending 15 to 25% of their time on access requests. RBAC redirects that effort toward value-creating work.
Governance and Data Quality
Clear Data Ownership: Role-based access control naturally encourages defining data domains and ownership. When creating RBAC roles for the Finance team, you must decide which tables belong to Finance, forcing clarity about data stewardship.
Controlled Modifications: By limiting who can write to production tables through RBAC, you prevent accidental data corruption. Junior analysts can't accidentally DROP TABLE customers. Write permissions in role-based access control become deliberate, documented decisions.
Environment Separation: RBAC makes it possible to enforce proper development, staging, and production separation. Developers have full access to dev environments where they can experiment freely, limited access to staging for testing, and restricted read-only access to production through their assigned roles.
The Cost of Operating Without RBAC
Organizations that defer implementing role-based access control face escalating costs. Each new tool adds new permissions. Each new employee multiplies complexity. Within two years, even small teams lose track of who has access to what without RBAC.
When official data access is too slow without proper RBAC, business users create workarounds: downloading data to Excel, maintaining their own databases, building unauthorized integrations. These shadow data systems are invisible to security teams and governance frameworks.
The gap between your actual access patterns and what you can document to auditors widens without role-based access control. Failed audits lead to remediation costs, delayed certifications, and in severe cases, regulatory fines.
Eventually, the combination of permission sprawl, inadequate auditing, and former employees retaining access leads to a security breach. Role-based access control prevents these scenarios by creating systematic access management from the start.
RBAC in Modern Data Stacks
The modern data stack creates unique challenges for RBAC implementation. Unlike traditional applications where a single database might handle all access control, data teams orchestrate dozens of specialized tools, each with its own permission system.
The Multi-Platform RBAC Challenge
A typical data team operates across multiple platforms where role-based access control must be configured:
Data Platforms like Snowflake, BigQuery, Databricks, each with native RBAC but different implementations
Transformation Layer like dbt with its own project and environment permissions
BI and Analytics like Tableau, Looker, Power BI, each maintaining its own permission model
Orchestration like Airflow, Prefect managing workflow execution with separate user management
Data Observability tools including Matia as well as other non-native data tools configured to help understand quality
Data Catalogs such as Matia with metadata access controls that need RBAC integration
The fundamental problem: granting a marketing analyst access to campaign data requires configuring permissions in at least five different systems. Maintaining consistency across these systems, ensuring that the "Marketing Analyst" role means the same thing everywhere in your role-based access control implementation, becomes a significant operational challenge.
Common RBAC Patterns for Data Teams
Successful data teams typically organize role-based access control along three dimensions:
Environment-Based RBAC: Roles like dev_full_access, staging_read_write, and prod_read_only enforce proper development practices and protect production data through role-based access control.
Domain-Based RBAC: Roles like finance_analyst, marketing_analyst, and product_analyst align with organizational structure and data ownership models.
Function-Based RBAC: Roles like data_engineer, analytics_engineer, and data_analyst align with job functions and career ladders.
Many teams combine these approaches in hybrid RBAC models. For example, marketing_data_analyst_prod gives an analyst production read access specifically to marketing domains. The hybrid approach offers flexibility but requires careful planning to avoid role explosion in your role-based access control system.
Key RBAC Implementation Challenges
Role Explosion: The most common RBAC pitfall is creating too many narrowly-defined roles. Teams start with sensible role-based access control categories but gradually accumulate hundreds of overly specific roles. This defeats the purpose of RBAC.
Cross-Platform Consistency: Maintaining equivalent role definitions across platforms in your RBAC system requires coordination. Each platform has different permission granularity, making perfect RBAC alignment challenging.
Dynamic Access Needs: Real-world data access patterns don't always fit neatly into static role-based access control definitions. A data scientist needs temporary access to customer data for a specific project. Traditional RBAC handles this through temporary role assignments that require manual tracking.
Getting Started with RBAC
Implementing role-based access control is a journey. The key to successful RBAC is starting with a solid foundation and expanding systematically.
Assess Your Current State
Before designing roles for your role-based access control system:
Inventory Your Data Assets: Document every system where data access needs RBAC management. Include your data warehouse, BI tools, orchestration, notebooks, data quality tools, and catalogs that need role-based access control.
Document Existing Access Patterns: Who currently accesses what? Query audit logs to understand how people actually work with data. This informs RBAC role design.
Identify Sensitive Data: Flag datasets that require special handling in your RBAC system: PII, financial data, health information. These need separate role considerations in your role-based access control implementation.
Map Compliance Requirements: List which regulations apply and what access controls they mandate. Your RBAC design must accommodate these requirements from the start.
Define Your RBAC Role Hierarchy
Base RBAC Roles on Organizational Reality: Align your initial roles with how your organization actually works. If you have distinct Data Engineering, Analytics Engineering, and Data Science teams, those translate naturally to RBAC roles.
Start With 5 to 10 Core RBAC Roles: Begin with broad categories when implementing role-based access control:
Viewer (read-only, no direct database access)
Analyst (read access to curated data, BI tool usage)
Data Engineer (pipeline development and management)
Admin (full access for senior team members)
Document Each RBAC Role Clearly: For every role in your role-based access control system, document the purpose, intended users, key permissions, restrictions, and approval process. This becomes your RBAC governance and audit trail.
Establish Core RBAC Principles
Least Privilege: Grant only the minimum permissions required for job functions in your role-based access control system. If analysts only need to SELECT data, they shouldn't have UPDATE or DELETE permissions.
Separation of Duties: No single RBAC role should have end-to-end control of sensitive workflows. This is a fundamental principle of effective role-based access control.
Time-Bound Access: When granting elevated or sensitive permissions, default to temporary access with explicit expiration. Role-based access control should support temporary role assignments for project-based work.
Audit Everything: Log all role assignments, role changes, and permission modifications in your RBAC system. This audit trail is essential for security and compliance.
RBAC Implementation Roadmap
Phase 1: Critical Systems (Weeks 1 to 4) - Start your RBAC implementation with your data warehouse and most sensitive datasets. Implement role-based access control for PII and regulated information. Focus on core infrastructure: SSO integration, role definition process, and audit logging.
Phase 2: Expand RBAC (Weeks 5 to 12) - Extend role-based access control to your BI tools, orchestration platform, and other critical systems. Ensure RBAC role definitions remain consistent across platforms.
Phase 3: Automate (Weeks 13+) - Build automation for onboarding and offboarding in your role-based access control system. Integrate RBAC with HR systems. Establish regular access review cycles and measure success metrics.
Tools for RBAC Implementation
Your role-based access control implementation involves multiple layers:
Identity Provider and SSO: Azure AD, Okta, or OneLogin manage user identities. Most modern data tools support integration with these providers, enabling centralized user management for RBAC.
Native Warehouse RBAC: Snowflake, BigQuery, Databricks include built-in role-based access control capabilities. These are the foundation of your data access control strategy.
BI Tool Permissions: Tableau, Looker, Power BI each have permission models that complement warehouse RBAC and must be configured consistently.
Infrastructure as Code: Manage role definitions as code using Terraform or dbt. This enables version control and automated deployment of role changes in your role-based access control system.
Purpose-Built Data Access Platforms: Solutions like Matia orchestrate RBAC across your entire data stack. Rather than manually configuring equivalent roles in six different tools, you define role-based access control once, which propagates appropriate permissions everywhere.
RBAC Best Practices
Successfully maintaining role-based access control requires ongoing discipline:
Conduct Regular Access Reviews: Schedule quarterly reviews where managers certify their team members' RBAC role assignments. Automate these reviews where possible.
Document Comprehensively: Treat RBAC role documentation as a living system. When roles change in your role-based access control system, update documentation immediately.
Automate Provisioning: Integrate your RBAC system with HR workflows so new hire events trigger role assignments and departure events trigger immediate revocation.
Monitor Usage Patterns: Track how roles are actually used in your role-based access control system. Remove unused permissions to maintain least privilege.
Balance Security with Usability: Overly restrictive RBAC creates user frustration. Find the equilibrium where security is maintained but legitimate work isn't blocked by role-based access control.
Foster Collaboration: Role-based access control isn't just a data team responsibility. Partner with Security, IT, Legal, and business stakeholders for effective RBAC design.
Conclusion
Role-Based Access Control transforms data access from an operational burden into a manageable system. By organizing permissions around roles rather than individuals, RBAC enables data teams to scale securely, meet compliance requirements, and empower data democratization without sacrificing governance.
The journey to effective role-based access control begins with foundational steps: assess your current access patterns, define core RBAC roles aligned with organizational structure, implement role-based access control in critical systems first, and expand systematically. Maintain discipline around role granularity, document everything for audit purposes, and automate wherever possible.
For data teams just beginning, start simple with your role-based access control: implement basic RBAC roles in your data warehouse, extend to your BI tool, and establish processes that support future sophistication. For teams with RBAC in place but facing scale challenges, purpose-built data access platforms can unify fragmented permission systems and add the intelligence layer that traditional role-based access control lacks.
The time your team spends managing access requests can be redirected toward extracting insights and building data products. The compliance gaps keeping you up at night can be solved with the audit trails and documented controls that role-based access control provides.
The path from permission chaos to structured access control through RBAC is clear. The question is whether you'll implement role-based access control proactively or reactively after the next security incident or failed audit.
Ori Zviran has joined Matia as our Vice President of Research & Development (VP of R&D). With a career spanning cybersecurity, automated machine learning, and extensive experience in scaling and governing complex backend systems, Ori brings a unique blend of technical expertise and leadership experience that will be instrumental as we continue building the future of unified data operations.
A Technical Journey Worth Sharing
Ori's path to Matia reflects the kind of diverse technical background that makes for exceptional engineering leadership. Most recently, he served as a Principal Software Engineer at Palo Alto Networks, where he focused on system architecture,technical standards and strategic direction at the group level.
Before that, he was the first employee at Obligo (one of Matia's earliest customers), where he played a key role in designing, implementing, and governing the system’s backend, architecture, and data schemas, and eventually became R&D Team Lead. His time at Obligo gave him firsthand experience with the data challenges that modern companies face; challenges that Matia is uniquely positioned to solve.
His technical journey also includes a stint at Firefly.ai working on automated machine learning, and even a few years in computational biology research. Ori holds a BSc in Computer Science and Computational Biology, and during his research, he focused on building automated big data pipelines for comparative analysis before transitioning fully into software engineering.
When he's not solving complex engineering challenges, Ori is busy at home with his wife, their one-year-old son, and their dog,who, according to Ori, "respects the baby but definitely doesn't love him yet."
Why Matia?
When asked what drew him to Matia, Ori was characteristically straightforward: "The product is incredibly interesting. I love data, the technical challenges are substantial, and the team is exceptional."
He also noted that Ben may have been "persistently persuasive" over the course of two years. We'll take that as a testament to both Ben's conviction and Ori's discernment in choosing the right opportunity.
What's Next
Ori joins us at an exciting time as Matia continues to scale our data platform and expand our engineering capabilities. His experience building backend systems from the ground up, leading technical teams, and navigating complex data infrastructure challenges makes him the perfect fit to help guide our R&D efforts.
We couldn't be more excited to have Ori on board. Welcome to Matia, Ori (or Zviran, as his military buddies and former colleagues still call him)!
I don't usually do year-in-review posts. They can feel a bit self-congratulatory. But since we have a video…sitting here at the end of 2025, I realize I owe it to our team, our customers, and everyone who's been part of this journey to pause and actually reflect on what just happened.
Because what just happened was extraordinary.
We built at a pace I didn't think was possible
When we started Matia, the vision was clear: unify the fragmented DataOps landscape into one platform that actually works. I actually set out hoping to be a customer of “Matia” (before it existed) and realized I would need to build the tool that I wish I had as a data leader. Simple in concept. Yet, no one had done it yet.
This year, we shipped dozens of major features and capabilities. Cost optimization that actually saves money. Data quality rules that prevent deep issues before they start. Lineage that traces problems to their source in seconds. 150+ connectors that aren’t just “light” solutions. AI capabilities that don't just monitor but recommend. Enterprise readiness that means security teams can actually say yes.
The video above captures the velocity, but it doesn't capture the late nights, the hard decisions, or the moments where we had to choose between good and great. We always chose great. Sometimes it took longer. It was always worth it.
Our customers pushed us to be better
I'm going to be honest: some of our best features exist because a customer asked for something seemingly impossible on a Tuesday and we shipped it by Thursday. (you know who you are…)
That's not normal in enterprise software. It should be.
We grew 10x this year. We ran over a million integrations. We earned G2 badges, became available in the AWS Marketplace, and partered with Snowflake. But the number that matters most to me is our support response time: under five minutes, consistently, and under 2 on really good days.
The team tripled, the mission stayed the same
We're three times the size of the team since the start of the year. New faces, new expertise, new perspectives. Every hire this year raised the bar.
But here's what hasn't changed: we're still obsessed with solving the real problems. They’re not always the sexy ones, but they matter to the data teams we work with.
Data at scale is challenging…period. Companies like Ramp, Drata, Honeybook, Lemonade, Dialpad, Phreesia, Recharge, and dozens of others have trusted us with their most critical infrastructure, and we don’t take that lightly.
We're just getting started
The video ends with that line, and I mean it. Everything we built this year is foundation. The real work is ahead.
We're going after the hardest problems in data operations. The ones everyone says are "too complex" or "too ambitious." Those are exactly the ones worth solving. We’ve seen a lot of consolidation in the data space this past year, and that just further proves that the problem we set out to solve has validity.
2026 is going to be even more intense. We're expanding our AI capabilities in ways that'll make this year look like a bleep on the radar. We're going deeper on observability. We're making enterprise features that don't compromise on speed. And we're going to keep shipping at velocity because that's what our customers need.
Thank you
To our team: you're the reason any of this is possible. Your talent, your grit, your refusal to ship and create anything less than excellent, that's what built this year.
To our customers: thank you for trusting us with your data infrastructure. Thank you for the feedback that made us better. Thank you for believing in what we're building.
To our partners, investors, and supporters: your faith in this mission keeps us going on the hard days.
And to anyone reading this who's drowning in data entropy or wasting time on tools that don't talk to each other: we see you. We're building for you. And we'd love to show you what's possible.
Here's to 2026. Let's build something remarkable. Stay tuned.
This month, we're launching six new connectors that expand Matia's capabilities across identity management, marketing automation, mobile analytics, and financial data. These integrations make it easier to centralize authentication data, sync marketing campaigns, track mobile app performance, and unify financial reporting, all from a single platform.
Okta: Enterprise Identity & Access Management
Sync identity and access data from your Okta account to centralize authentication insights, monitor user access patterns, and build comprehensive security analytics. Matia’s integration enables authentication and provisioning capabilities.
Who It's For
Security teams, IT operations, and compliance officers who need unified visibility into authentication events, access policies, and user provisioning.
How to Set Up the Okta Integration
Step 1: Locate your Okta domain (e.g., your-company.okta.com) Step 2: Sign in to Okta Admin Console with administrator privileges Step 3: Navigate to Security > API > Tokens Step 4: Click Create Token, name it, and save the token securely Step 5: In Matia, enter your Okta domain and API token
Step 6: Configure connector name, description, and owner Step 7: Test connection and click Connect
The connector syncs core identity objects including users, groups, roles, devices, and system logs.
Mailchimp: Marketing Automation & Campaign Data
Email marketing often holds some of the most valuable engagement signals in a business, yet those insights usually stay siloed inside campaign tools. The Mailchimp Connector updates brings that data directly into your warehouse so teams can analyze audience behavior, campaign performance, and lifecycle engagement without relying on manual exports.
Matia integrates with Mailchimp’s API to pull core marketing objects including campaigns, sends, opens, clicks, subscriber activity, and list attributes. This creates a consistent, analytics-ready view of your email programs and how they influence downstream metrics like revenue, retention, and product usage.
The connector syncs campaigns, subscriber activity, automations, segments, tags, and reporting data.
Who It's For
Marketing teams, product managers, growth analysts, and customer success teams combining email engagement with product usage, revenue, and lifecycle metrics.
Apple App Store: iOS App Analytics & Performance
The Apple App Store Connector leverages App store connected API and brings your iOS app data directly into Matia so teams can analyze downloads, performance trends, user acquisition, and release outcomes without relying on manual exports or scattered dashboards. This unified feed lets you compare platform performance, track trends over time, and connect iOS engagement to product and revenue outcomes.
The connector syncs iOS app analytics, downloads, retention indicators, ratings, and release data.
Who It's For
Product managers, mobile app teams, and growth analysts tracking iOS performance alongside Android data, in-app behavior, and revenue trends.
Google Play: Android App Analytics & Performance
The Google Play Connector centralizes your Android app metrics in Matia, giving teams a complete view of downloads, ratings, performance trends, and release outcomes. Instead of relying on fragmented reports or ad hoc exports, you get a unified, analytics-ready data stream that helps you compare platform performance and understand how Android user behavior influences product and revenue outcomes.
The connector syncs Android downloads, ratings, performance data, and release trends.
Who It’s For
Mobile product teams and growth analysts evaluating Android performance across downloads, ratings, and release performance, and comparing metrics to iOS.
Email Connector: Direct Email Data Integration
Some data sources still rely on email to deliver reports or exports. The Email Attachment Connector gives teams a simple way to turn those incoming files into structured, warehouse-ready data without manual steps or custom scripts.
Each integration receives a dedicated Matia-managed email address. When a message arrives with an attachment, Matia automatically extracts the file, interprets its structure, and loads the processed data into your chosen table. Metadata like file name and timestamp is added for tracking and lineage.
The result is a lightweight, reliable path for any workflow that still depends on emailed files. It eliminates recurring file-handling tasks, keeps data current, and provides a consistent ingestion experience across partner reports, legacy systems, and internal exports.
Security is built in. Each address operates in isolation, all data is encrypted, and every action is logged for auditability. The connector feeds directly into your warehouse so your existing governance policies stay intact.
Who It's For
Sales teams, customer support operations, and data analysts who need to unify email activity with CRM data, support tickets, and customer journey analytics.
Xero: Accounting & Financial Data Streams
Financial data is at the center of critical business decisions, yet it’s often one of the hardest datasets to maintain cleanly and consistently. The Xero Connector gives teams a direct, reliable pipeline from Xero into their data warehouse, removing the friction of exports, custom scripts, or manually stitched-together reports.
Matia connects to Xero’s API and continuously syncs your accounting data into structured warehouse tables. This includes core financial objects like invoices, payments, bank transactions, contacts, and chart-of-accounts details. Instead of dealing with multiple endpoints or inconsistent CSV formats, teams get a unified, analytics-ready representation of their Xero environment.
Who It's For
Finance teams, CFOs, and business analysts consolidating accounting data with revenue metrics, customer lifetime value calculations, and operational dashboards.
The connector syncs accounting data like invoices, payments, bank transactions, journals, and contacts.
What's Next
Each connector uses Matia’s ingestion engine to automatically normalize schemas, track changes, and maintain sync integrity with built in observability so teams get data in their warehouse when they need it.
All six connectors are live and ready to use today. Additional streams will be added as needs arise. From enterprise identity management to mobile app analytics and financial reporting, we're making it easier to centralize the data that drives your business.
No matter how advanced our data stacks get, one truth remains: a surprising amount of business data still arrives via email.
Financial reports, campaign exports, partner files. Critical data continues to flow through inboxes as attachments. For many teams, this means manual downloads, inconsistent file formats, and delayed data availability.
These email-based workflows create blind spots. Data engineers spend hours manually uploading CSVs into warehouses, analysts work with outdated numbers, and business users wait for insights that could have been automated.
That’s why we built the Matia Email Connector, a powerful new connector any inbox into a live data pipeline. It automatically extracts email attachments, parses them intelligently, and syncs the data directly into your data warehouse.
What is the email attachment connector?
The Email Attachment Connector turns everyday emails into structured data. Each integration gets a unique Matia-managed email address, simply send (or forward) your data files there, and Matia takes care of the rest.
Here’s how it works:
Automatic attachment detection – CSV, JSON, JSONL, or NDJSON files are recognized and processed instantly.
Smart parsing and schema inference – Column types and structures are detected automatically.
Direct warehouse loading – Data lands in your selected schema and table, ready for queries, just like any other Matia connector
Metadata enrichment – Each row includes a timestamp and file name for full traceability.
No manual uploads. No scripts. No pipelines to maintain. Just email → warehouse — all managed through Matia’s scalable infrastructure.
Key benefits include:
Zero manual effort or file handling
Scheduled and automated syncsBuilt-in, enterprise grade security and data isolation
Enterprise grade security
Enterprise-grade security for email data automation
Email-based data workflows need robust security. Each Matia email integration operates with complete data isolation and enterprise-level protection.
Built in security means:
Unique, isolated email addresses - Every integration gets a dedicated Matia-managed email address, ensuring complete separation between data sources
Encrypted data processing - All attachments are encrypted in transit and at rest using industry-standard protocols
Access controls- Role-based permissions determine who can create integrations and view incoming data
Audit logs - Complete traceability of every file received, processed, and synced to your warehouse
Matia's Email Connector is built to meet enterprise compliance requirements. Our infrastructure supports SOC 2 Type II and HIPAA-compliant workflows, with data residency options available.
Your email data never touches third-party storage. Files are immediately synced to your designated data warehouse, where your existing security policies and access controls apply.
Real-world use cases
The Email Attachment Connector is designed for data teams who deal with email-based workflows across multiple domains. Here are four common use cases we’ve already seen in action:
1. Marketing campaign data
Scenario: Ad platforms and email tools send weekly CSV performance summaries. Example: Facebook Ads, Google Ads, or Mailchimp exports. Benefit: Combine these reports with API data to create a 360° marketing view. No more waiting on spreadsheets.
2. Client & partner data exchange
Scenario: B2B partners send periodic data updates (inventory, sales). Example: Retailers or distributors sending weekly CSVs. Benefit: End manual uploads. Every partner email lands directly in your warehouse, securely isolated per integration.
3. Legacy system integration
Scenario: Older systems that can only export reports via email. Example: ERP or HR systems with no modern API. Benefit: Bridge old and new systems without expensive migrations. Start with email, move to API-based connectors later.
4. Survey & form data collection
Scenario: Tools like Typeform or Google Forms send response data via email. Benefit: Automatically centralize responses for analysis, segmentation, or reporting in your data warehouse.
How It Works
1. Create a new email integration Set up a new Email Connector in your Matia workspace. It only takes a few clicks.
2. Copy your unique email address Each integration gets its own secure, auto-generated Matia email address.
3. Send your data as email attachments Simply forward or schedule emails with CSV, JSON, or JSONL attachments to that address.
4. Sync and see your data instantly Click Sync, and Matia automatically processes, parses, and loads your files into your data warehouse. Clean, structured, and ready for analysis.
In September, the PostgreSQL Global Development Group announced the release of Postgres 18, marking another milestone in the evolution of the world's most advanced open-source database. We’re big fans of Postgres at Matia, and this release helped drive that home. The new and improved Postgres brings performance improvements, developer-friendly features, and enhanced operational capabilities that address both modern cloud workloads and traditional database challenges.
Read on to learn what’s new with the latest Postgres release, and how data engineers are leveraging it.
The Game-Changer: Asynchronous I/O
The most significant advancement in Postgres 18 is the new asynchronous I/O subsystem, which has demonstrated up to 3x performance improvements when reading from storage. Previously, Postgres’ synchronous I/O forced backends to wait for each operation to complete before requesting the next one, creating a bottleneck for data-intensive workloads.
The new AIO subsystem lets Postgres issue multiple I/O requests concurrently instead of waiting for each to finish in sequence, dramatically improving throughput for sequential scans, bitmap heap scans, and vacuum operations.
You can configure this feature using the new io_method setting:
-- Enable asynchronous I/O with io_uring (Linux)ALTERSYSTEMSET io_method ='io_uring';
-- Or use worker-based approachALTERSYSTEMSET io_method ='worker';
-- Revert to traditional synchronous behavior if neededALTERSYSTEMSET io_method ='sync';
-- Fine-tune I/O combining behaviorALTERSYSTEMSET io_combine_limit =128;
This foundational improvement means your database can handle more parallel work while I/O operations complete, freeing CPU cycles for other tasks and making the entire system more responsive.
UUIDv7: The Primary Key Debate Gets a New Champion
Postgres 18 introduces the database-friendly uuidv7() function that provides better indexing and read performance for UUIDs. This native support nearly settles the long-standing debate about whether to use SERIAL/IDENTITY types or UUIDs as primary keys.
Unlike traditional UUIDv4 values that are completely random and cause poor B-tree locality, UUIDv7 combines global uniqueness with timestamp ordering, delivering the best of both worlds:
-- Create a table using UUIDv7 as primary keyCREATETABLE orders (
id UUID PRIMARY KEY DEFAULT uuidv7(),
customer_id INT,
total DECIMAL(10,2),
created_at TIMESTAMPDEFAULT NOW()
);
-- Generate a UUIDv7SELECT uuidv7();
-- Output: 018c7f4e-3b2a-7000-8000-000000000001
The timestamp-ordered nature means sequential inserts result in better data locality, reduced page splits, and improved caching behavior compared to random UUIDs.
Virtual Generated Columns: Compute on Demand
Developers benefit from virtual generated columns that compute values at query time, providing flexibility without the storage overhead of stored generated columns. This is now the default behavior for generated columns in Postgres 18.
Query Optimizer Enhancements
Postgres 18 introduces "skip scan" lookups on multicolumn B-tree indexes that improve execution time for queries that omit an equality condition on one or more prefix index columns.
For data engineers, this solves a long-standing indexing issue. Previously, if you created a composite index on country, city and then queried only by city, Postgres would completely ignore the index and perform a full table scan, potentially scanning millions of rows. This forced the creation of redundant single-column indexes, increasing storage costs, slowing down queries, and complicating indexes.
With skip scan, Postgres 18 can now efficiently use composite indexes even when you skip the leading columns. The optimizer scans through the distinct values of the leading column and performs index lookups for each combo. This is particularly effective when the leading column has relatively few distinct values. For example, querying cities across 10 countries is better than the entire database.
This optimization automatically makes queries faster without requiring schema changes:
-- Create a multicolumn indexCREATE INDEX idx_users_country_city
ON users(country, city);
-- Previously inefficient, now optimized with skip scanSELECT*FROM users WHERE city ='San Francisco';
-- Postgres 18 can now use the index efficiently-- even though 'country' prefix is missing
The performance impact is most dramatic in multi-tenant applications and time-series data where you frequently query by secondary dimensions. Instead of maintaining duplicate indexes for every query pattern, you can now rely on well-designed composite indexes to serve multiple use cases efficiently.
Additionally, queries using OR conditions can now leverage indexes more effectively, leading to significantly faster execution times.
Enhanced OLD and NEW References
Postgres 18 supports OLD and NEW references in RETURNING clauses for INSERT, UPDATE, DELETE, and MERGE commands, making change tracking and audit trails simpler:
-- Track changes during upsert operationsINSERTINTO products (name, price)
VALUES ('Widget', 25.00)
ON CONFLICT (name) DO UPDATE
SET price = EXCLUDED.price
RETURNING
name,
old.price AS previous_price,
new.price AS current_price,
(old.price ISNULL) AS is_new_record;
-- Track deleted recordsDELETEFROM products WHERE price <10.00RETURNING
old.name AS deleted_product,
old.price AS deleted_price;
Temporal Constraints Without Overlaps
Postgres 18 introduces temporal constraints for PRIMARY KEY, UNIQUE, and FOREIGN KEY constraints, enabling better support for time-series and temporal data:
-- Prevent double-booking scenariosCREATETABLE room_bookings (
room_id INT,
booking_period TSRANGE,
PRIMARY KEY (room_id, booking_period WITHOUTOVERLAPS)
);
-- This ensures the same room cannot be booked-- for overlapping time periods
OAuth 2.0 Authentication
Postgres 18 makes it easier to integrate with single-sign-on systems(SSO) like Okta with support for OAuth 2.0 authentication, enabling modern identity provider integration and reducing reliance on shared passwords for better security posture.
Improved Upgrade Experience
This release makes major-version upgrades less disruptive, accelerating upgrade times and reducing the time required to reach expected performance after an upgrade completes. The pg_upgrade tool now preserves planner statistics, meaning your newly upgraded cluster reaches optimal performance immediately rather than waiting for ANALYZE to complete.
Impact on Data Warehousing and ETL Pipelines
For organizations running data warehouse syncs to platforms like Snowflake, Redshift, or BigQuery, Postgres 18's performance improvements translate directly to faster and more efficient data movement. The asynchronous I/O enhancements significantly accelerate bulk reads during extraction phases, reducing the time required to pull large datasets from your operational database.
The improved query optimizer with skip scan capabilities means your ETL queries can retrieve data more efficiently, even when dealing with complex filtering conditions. This is particularly valuable for incremental sync patterns where you're querying on timestamp ranges or change data capture (CDC) scenarios:
-- Incremental sync query that benefits from skip scanCREATE INDEX idx_events_tenant_timestamp
ON events(tenant_id, created_at);
-- Query omits tenant_id but still uses index efficientlySELECT*FROM events
WHERE created_at >'2025-11-01'AND event_type ='purchase';
Virtual generated columns also streamline data preparation before syncing to analytical platforms, allowing you to materialize transformations at query time rather than storing pre-computed values:
-- Compute analytics-friendly fields on-the-flyCREATETABLE transactions (
id UUID PRIMARY KEY DEFAULT uuidv7(),
amount DECIMAL(10,2),
created_at TIMESTAMP,
yearINT GENERATED ALWAYS AS (EXTRACT(YEARFROM created_at)) VIRTUAL,
quarter INT GENERATED ALWAYS AS (EXTRACT(QUARTER FROM created_at)) VIRTUAL
);
-- ETL extracts computed dimensions without storage overheadSELECT id, amount, year, quarter
FROM transactions
WHERE created_at > (NOW() -INTERVAL'1 day');
The faster vacuum operations enabled by AIO also reduce maintenance windows, ensuring your source database stays healthy and responsive even under heavy replication and sync workloads.
Replicate Postgres Faster with Matia
While Postgres 18 brings tremendous improvements, replicating a Postgres instance still requires significant expertise and time. That's where Matia comes in.
Matia provides a fully managed unified dataops experience that lets you leverage the latest Postgres capabilities immediately, without the operational overhead.
With Matia, you get the following benefits:
Up to 10x refresh speed with parallel sync drastically reduce sync times compared to Fivetran and other tools. For example, customers have reduced syncs from 3 days to 24 hours for over 8TB Postgres databases. Think of it as opening a multilane highway vs a single lane road.
Automated backups and point-in-time recovery so you can focus on building, not babysitting infrastructure
Seamless scaling as your data and query load grows
Built in connectors for fast, reliable syncs to Snowflake and other warehouses and datalakes. Postgres can also be a destination. You can also send data to Snowflake or another warehouse to your Postgres instance.
Whether you're migrating from an older Postgres version or starting fresh, Matia accelerates your time-to-value by handling the complexity of database operations while you focus on leveraging Postgres 18's powerful new capabilities for your applications and analytics workflows.
Postgres 18 represents a significant leap forward with architectural improvements like asynchronous I/O, practical developer features like UUIDv7 and virtual generated columns, and enhanced operational capabilities. Whether you're running transactional workloads, analytical queries, or hybrid systems, Postgres 18 delivers measurable performance gains and quality-of-life improvements that make it a compelling upgrade target.
For data teams managing warehouse syncs and ETL pipelines, the performance improvements translate to faster data movement, reduced extraction times, and more efficient ingestion workflows. Combined with a managed platform like Matia, you can harness these benefits immediately without the operational complexity.
If you've ever watched your data pipelines struggle to keep up with production databases, you know the frustration. Your application is humming along, processing thousands of transactions per second, but your data warehouse is stuck playing catch-up, sometimes hours behind. This replication lag isn't just an inconvenience; it's a business risk that makes real-time analytics impossible and decisions based on stale data inevitable.
Enter Matia's parallel syncs, a game-changing approach to database replication that's helping data teams eliminate replication lag and sync data up to 8x faster than traditional methods.
The single-threaded bottleneck
Traditional database replication has long suffered from a fundamental constraint: single-threaded processing. Even with modern hardware and lightning-fast networks, replication systems have historically applied changes sequentially, one transaction after another, in the exact order they occurred on the source database. While this approach guarantees consistency, it creates a massive performance bottleneck.
Think of it like trying to funnel rush hour traffic through a single-lane road. No matter how fast individual cars move, there's only so much throughput you can achieve. Meanwhile, vehicles (or in our case, transactions) pile up in an ever-growing queue, backed up for miles.
As a result, replication lags. Your source database moves ahead while your replica struggles to keep pace, creating an ever-widening gap between production and your analytics environments.
Parallel syncs: opening multiple lanes
Matia's parallel syncs fundamentally reimagine how database replication works by introducing multi-threaded processing. Instead of a single worker applying changes sequentially, Matia opens up multiple parallel streams to apply non-conflicting transactions simultaneously.
This is like instead of going through a single-lane road, you are funneling traffic through a 6-lane highway. Suddenly, your throughput multiplies because multiple operations can happen at once, as long as they don't interfere with each other.
Here's what makes Matia unique: It's one of the only platforms that allows you to open up parallel syncs, giving you control over how many concurrent workers process your data. This architectural advantage translates into real-world performance gains that data teams can actually measure.
The hidden cost benefit: lower warehouse compute spend
Here's something most platforms won't tell you: faster syncs don't just save time, they save money on your data warehouse compute costs.
When data syncs take hours instead of minutes, your warehouse is running longer to process incoming data. Traditional single-threaded replication means your warehouse compute resources are engaged for extended periods, continuously processing the stream of incoming changes. The longer the sync, the more credits you burn.
Matia's parallel syncs flip this equation. By completing replication up to 8x faster, your warehouse spends dramatically less time in active compute mode. Real customer examples prove this out:
Solvento reduced their warehousing costs by 20% after switching to Matia, thanks to optimized data ingestion that reduced the compute time needed in Redshift
Faster sync times mean fewer warehouse credits consumed during the ingestion window
More efficient data loading reduces the overhead on downstream transformation jobs
The compute savings compound when you consider that many teams run syncs multiple times per day. If you're syncing every hour with traditional tools, your warehouse is constantly active. With Matia's parallel syncs, each sync completes faster, meaning your warehouse can suspend sooner, your auto-suspend settings become more effective, and you're not paying for idle compute time between sync batches.
This is warehouse cost optimization that happens automatically, simply as a byproduct of faster replication architecture. You don't need to tune cluster sizes, adjust materialization strategies, or optimize query patterns, the speed of data ingestion itself drives the savings.
Real-World impact: The numbers don't lie
The performance improvements aren't theoretical. Companies using Matia are seeing dramatic reductions in sync times:
Teams across industries are reporting sync time reductions of up to 8x compared to traditional single-threaded approaches
When your data pipelines can keep up with production, you unlock:
Near real-time analytics and dashboards that reflect current business state
Faster decision-making based on fresh data, not yesterday's snapshot
Reduced infrastructure costs from more efficient data movement
Improved team productivity as engineers spend less time troubleshooting replication lag
How It works: change data capture meets parallel processing
Matia combines parallel syncs with Change Data Capture (CDC) technology to create a powerful replication engine. CDC monitors changes at the database level—capturing inserts, updates, and deletes as they happen, and feeds them into Matia's parallel processing pipeline.
The system intelligently determines which operations can safely run in parallel (like updates to different rows or tables) and which must be serialized (like dependent transactions on the same record). This ensures you get maximum parallelism without sacrificing data integrity or consistency.
The architecture supports a wide range of database sources, including:
PostgreSQL
MongoDB
MySQL
And over 100 other connectors
Regardless of your source, Matia's parallel syncs work to dramatically accelerate data movement to your warehouse, whether that's Snowflake, Databricks, or another destination.
Beyond speed: the complete dataops platform
While parallel syncs are a marquee feature, they're part of Matia's broader vision as a unified DataOps platform. The same system that's speeding up your database replication also provides:
Built-in observability: Detect anomalies and data quality issues at ingestion time, before bad data reaches your warehouse
Reverse ETL: Push data back to SaaS tools with the same speed and reliability
Real-time monitoring: Surface integration failures and schema changes with smart Slack alerts
Catalog functionality: Understand your data lineage and metadata from a single pane of glass
This unified approach means fewer tools to manage, better integration between components, and cost savings from consolidation. Teams report reducing their overall data stack costs by up to 78% when moving to Matia.
Why parallel syncs matter now more than ever
As businesses generate more data and demand faster insights, the gap between traditional replication speeds and modern requirements continues to widen. Machine learning models need fresh training data. Customer-facing dashboards must reflect real-time inventory. Financial reporting can't wait hours for yesterday's transactions to sync.
Parallel syncs aren't just a performance optimization, they're an architectural necessity for modern data infrastructure. By eliminating the single-threaded bottleneck, Matia enables data teams to build systems that can actually keep pace with their businesses as well as significantly reduce warehousing and compute costs.
Getting started
Matia's parallel syncs work out of the box with database replication, requiring minimal configuration. The platform is designed to be fully backward compatible with existing ETL tools like Fivetran, making migration straightforward, sometimes in as little as five minutes.
For teams struggling with replication lag or looking to accelerate their data pipelines, parallel syncs represent a practical solution to a persistent problem. The combination of CDC technology, intelligent parallel processing, and enterprise-grade reliability creates a replication engine that finally matches the speed of modern business.
Everyone’s posting their G2 badges this week, and honestly? I love it. Recognition from customers matters. So let’s join in, but with a little more context.
We’re coming up on one year since Matia launched out of stealth. What started as a vision to simplify and unify how data teams work has quickly become a reality for customers across industries. Their feedback and belief in our platform are what made this milestone possible.
This Fall 2025 marks our second consecutive quarter in G2’s reports, and the results are incredible: Matia earned 21 total badges. For a company not yet a year old, that’s no small achievement. But more important than the badges themselves is what they represent: real customer trust.
Matia’s G2 Recognition
In the Fall 2025 G2 Grid Reports, Matia was recognized as a High Performer across several critical categories:
ETL Tools – High Performer
Data Extraction – High Performer
Data Replication – High Performer
We also scored high on multiple indexes that matter to buyers:
Implementation Index for ETL Tools – showing how easy Matia is to deploy
Results Index – reflecting customer outcomes and ROI Additional high scores across usability, support, and relationship metrics
These aren’t just labels. They’re a direct reflection of the experiences our customers are having with Matia every day.
What Customers Are Saying
G2 reviews provide more than numbers; they capture the voice of the customer. Here’s what a few had to say about their Matia experience:
“Matia's UI is much easier to use than pretty much every competitor that we've considered. Implementation was a breeze thanks to the incredible support from Or and his team. We transitioned many of our connectors over in just a few weeks, and our users are able to set up new integrations without any specialized training. Matia is a great refinement on existing ETL/RETL tools, and absolutely worth considering, especially with how easy it is to switch and the tangible and intangible benefits of consolidating tooling.”
And another review that highlights both our platform and our team:
“The team is incredible and always going above and beyond, it almost makes me worried that I'm taking up too much of their time. They're eager to dive deep into any issues alongside you and come up with next steps and solutions together. If you want a vendor that will truly feel like they're on your team, choose Matia.
Badges may get attention, but it’s stories like these that tell the real story of what we’re building.
Why Fall 2025 Recognition Matters
At Matia, our mission has always been clear: help data teams move faster without compromising trust. That means building a platform that unifies ingestion, reverse ETL, catalog, and observability, while keeping the experience simple, intuitive, and powerful.
The Fall 2025 G2 reports validate that our customers see us delivering on that promise. They show that our efforts to be responsive, collaborative, and relentlessly focused on solving real problems are resonating.
A Thank You to Our Community
To our early adopters: thank you for believing in us before anyone else. You shaped the product in its earliest days and helped us prove that a unified approach is not only possible, but better.
To our growing customer base: we’re just getting started. Your feedback continues to guide our roadmap and fuel the innovation we’re known for.
To our team: this is your win. You’ve built something that customers not only use, but love enough to recommend publicly. That’s the highest compliment we could ask for.
Looking Ahead
Badges are nice. They’re a milestone. But belief—the trust our customers place in us to power their data workflows—is what really drives us forward.
As we enter our second year, we’ll continue to focus on what matters most: solving real problems, building trust one conversation at a time, and pushing the boundaries of what a data platform can do.
We’re proud of the 21 Fall 2025 G2 badges. But we’re even more proud of the belief behind them.
We’re back with another round of product wins. In September, we focused on helping teams tighten governance, gain observability, and understand how data is actually used across the business. With new Snowflake warehouse controls, flexible debugging options, richer catalog insights, and new connectors, you now have more ways to optimize costs, improve collaboration, and accelerate adoption.
Managing compute costs in Snowflake just got easier. With the new Snowflake Warehouse Selector, each integration can be routed to its own warehouse for precise cost control and performance isolation, and FinOps precision. Users can configure the target warehouse at the Integration level to align compute with data volume, priority, and schedule.
The result: optimized spend without sacrificing speed.
Configurable Reverse ETL Debugger Retention
For teams under strict compliance requirements, we introduced configurable retention for debugging data in Reverse ETL. Now you can decide exactly how long debugging data is stored, from fully disabled to as little as 7 days. This helps reduce risk, control storage costs, and ensure you only keep what’s necessary.
Reverse ETL Sync Context Variables in Mapping
Troubleshooting and lineage tracing are faster than ever. With Sync Context Variables, metadata such as sync ID, run ID, model name, and timestamps are automatically injected into destination fields. Each record carries its own context without requiring extra pipelines or manual enrichment. This is a big step forward for governance and observability in Reverse ETL.
Stronger Observability & Catalog Workflows
Catalog-to-Action Navigation
Data observability and data catalog are now fully connected. With Catalog-to-Action Navigation, you can instantly view a table’s lineage along with every integration and monitor tied to it. From there, jump directly into the details to resolve issues quickly. This reduces the time spent on root-cause analysis and makes change management safer.
In-Catalog Announcements
Keep everyone aligned with in-catalog announcements. Add context to an asset with author, timestamp, and severity (Information, Issue, or Warning). Optional Slack notifications extend visibility, ensuring stakeholders know exactly what changed and why.
Popularity Scores
Not all tables are created equal. Popularity scores surface the assets that matter most, ranking them by distinct users and query volume over the last 30 days. With visual indicators and trends, your team can prioritize confidently, focusing on data that actually drives decisions.
Query Usage Visibility
Transparency extends to the query level. You can now explore Snowflake queries grouped by SQL text or by user, track average run times, and map queries to the exact tables and owners involved. This helps teams tune performance, establish accountability, and optimize workloads.
New & Enhanced Connectors
We’ve also expanded Matia’s connector library to cover more analytics, customer engagement, and operational tools. These additions make it even easier to unify data across your stack and put it to work across teams
Webhook – Expanded functionality with unique Incident.io authentication and verification, giving more secure data delivery.
Greenhouse – Enhanced recruiting and hiring data sync for deeper HR and people analytics.
Google Cloud Storage – Ingest and export files seamlessly between your warehouse and GCS buckets.
Kato – Connect data from Kato to enrich analytics and operational workflows.
TikTok Shop – Capture ecommerce and sales performance data directly from TikTok Shop.
Notion – Now supports ingestion of Notion table content for more structured workflows.
Slack – Added support for CSV object syncing, enabling more flexible collaboration.
Wrapping Up
All of these updates are live today. From smarter Snowflake governance to richer catalog insights, we’re making it easier for data teams to trust, understand, and operationalize their data.
Next up: Matia will be hitting the road and heading to HayaData (TLV), Big Data LDN (London) and Coalesce (Las Vegas) in the coming weeks. Make sure to find us and say hello.
If you’d like to see these updates in action, book a demo, we’d love to show you around.
The ETL market looks different than it did a year ago. Fivetran merged with dbt Labs, Salesforce now owns Informatica, and Snowflake and Databricks both ship their own ingestion tools. If you last compared ETL tools in 2025, some of your shortlist has changed owners.
This guide compares 15 ETL tools for data and engineering teams in 2026. It covers what each tool does well, where it falls short, and who it fits. The comparison table comes first. Details on each tool follow.
Full disclosure: Matia makes an ETL platform, and we included ourselves. We’ve tried to be straight about every tool on the list, including ours.
ETL Tools Compared at a Glance
Tool
Best for
Deployment
Reverse ETL
Matia
Engineering teams on Snowflake unifying ETL, reverse ETL, observability, and catalog, especially for Postgres replication
Cloud
Yes
Fivetran
SaaS-heavy stacks that want managed connectors
Cloud, hybrid
Yes, via Census
Airbyte
Teams that want open source and will run it themselves
Open source, cloud
Not core
Informatica
Large enterprises with heavy governance needs
Cloud, on-prem, hybrid
Not core
Snowflake Openflow
Snowflake teams that need lightweight connectors with minimal data volume
Your AWS VPC or Snowflake-managed
Not core
Databricks Lakeflow Connect
Teams standardized on Databricks
Databricks-managed
Not core
Matillion
Teams most focused on visual transformation
Cloud
Not core
Qlik Talend / Stitch
Mid-market teams with mixed integration needs
Cloud, on-prem
Not core
Rivery
Mid-market teams already using Boomi
Cloud
Yes
Hevo Data
Smaller teams that want no-code setup
Cloud
Not core
Estuary
Teams that need real-time streaming without deep configuration options
Cloud, BYOC
Not core
AWS Glue
Teams running mostly on AWS
AWS
No
Azure Data Factory
Teams running mostly on Azure
Azure
No
IBM DataStage
Large on-prem and hybrid workloads
Cloud, on-prem, hybrid
No
Striim
Low-latency streaming and replication
Cloud, on-prem
No
An ETL tool moves data out of the systems where it’s created and into a warehouse or lake where it can be analyzed. ETL stands for extract, transform, load. Most modern tools actually run ELT: they load raw data first and transform it inside the warehouse, usually with dbt.
A typical pipeline pulls from three kinds of sources:
SaaS tools like Salesforce, HubSpot, Stripe, and Zendesk, through their APIs
Files and event streams from S3, Kafka, and similar systems
It then loads that data into Snowflake, BigQuery, Databricks, Redshift, or a data lake on a schedule or continuously.
The hard part is keeping those pipelines running. APIs change, schemas drift, and large databases take hours to sync. Most teams run separate tools for ETL, data quality, and cataloging, so when something breaks there’s no single place to look. Gartner predicts that by 2028, data management markets will converge into a single market to reduce technology complexity (Gartner, June 2025).
Types of ETL Platforms
Manage cloudETL
The tradeoff is control. You depend on the vendor’s connector quality, logging, and support when something breaks.
Warehouse-native ETL
Snowflake and Databricks now offer their own ETL tools: Snowflake Openflow and Databricks Lakeflow Connect. They’re billed through your existing warehouse contract and keep data inside that platform’s governance.
Connector coverage is still narrower than dedicated ETL vendors, and they tie your pipelines to one warehouse. They make the most sense if you’re fully committed to that platform.
Open source ETL tools
Open source tools like Airbyte have no license fee for the self-hosted version. You get full access to the code and can build custom connectors.
You also take on hosting, upgrades, and on-call when a connector fails. Teams often start here and move to a managed tool once pipelines become business-critical.
Enterprise and On-prem platforms and ETL tools
Informatica, IBM DataStage, and Qlik Talend run on-prem, in the cloud, or both. They’re built for regulated industries, legacy systems, and complex governance requirements.
Expect longer implementations, specialized skills, and higher costs than cloud-first tools.
Real-time streaming
Streaming tools like Striim deliver changes in seconds instead of minutes or hours. They’re the right fit for fraud detection, operational dashboards, and apps that react to data as it changes. Most analytics workloads don’t need sub-second latency, and streaming costs more to run.
How to choose an ETL tool
Check connector depth
A vendor claiming 500 connectors doesn't tell you a lot. You need to check whether the connectors you need cover the tables and fields you use. Many vendors offer “lite” connectors that sync only a subset of an API.
Before you sign, list your top 10 sources and check each one: which tables are supported, whether CDC is available for your databases, and how schema changes are handled.
Sync speed on your largest database
Small SaaS sources rarely cause problems. Your largest production database usually does. Ask how the tool handles the initial load of a multi-terabyte Postgres or MySQL database, and whether it can sync tables in parallel.
Run a proof of concept on your real data. Benchmarks on sample datasets won’t show you where your pipeline breaks.
What happens when something breaks
Pipelines fail. The question is how fast you find out and how fast you fix it. Check for:
Table-level logs you can read without opening a support ticket
Whether a bad sync can be stopped before it reaches downstream tables and tools
Support response times, in writing
Security and compliance
Confirm SOC 2 Type II at minimum, plus GDPR or HIPAA if they apply to you. Check for VPC or private network connections, role-based access, and audit logs. For regulated data, ask where data is processed and whether it’s stored in transit.
Calculate total cost
License fees are one line in the budget. Add the engineering hours to maintain pipelines, the cost of the other tools you’ll need alongside it (reverse ETL, observability, catalog), and what it would cost to migrate off later.
Model your costs on your real data volumes, including growth. Usage-based pricing that looks affordable at 10 million rows can look very different at 500 million. For a deeper look at pricing models, see our ETL pricing guide.
Full disclosure: this is our list, so we put ourselves first. Matia is unified data infrastructure for data and engineering teams. ETL, reverse ETL, catalog, and observability run in one platform, so data moves, gets monitored, and gets sent back to business tools without stitching four vendors together.
Matia is built for engineers. It isn’t a low-code tool, and it doesn’t replace dbt for transformation. It works alongside dbt and monitors your dbt runs.
Key Features:
ETL with 150+ connectors, including CDC for Postgres and MongoDB
Reverse ETL that can stop a sync when an anomaly is detected, so bad data doesn’t reach Salesforce or HubSpot
Observability at the point of ingestion, including schema change and data quality detection
Catalog with table-level and column-level lineage, from source to warehouse and back out to your tools
Monitors on dbt runs, connected to the syncs that feed them
Strengths:
Postgres replication speed. Parallel syncs cut one customer’s 8TB Postgres sync from 5 days to 20 hours
Table-level logs and WAL monitors, so debugging doesn’t start with a support ticket
Backward compatible with Fivetran, so teams can migrate without rebuilding downstream models
Support response times under 5 minutes One vendor for ETL, reverse ETL, observability, and catalog. Ramp reduced costs by 40% after consolidating onto Matia
Ideal Use Cases:
Teams replicating large Postgres or MongoDB databases where sync time matters
Teams paying for separate ETL, reverse ETL, and observability tools and looking to consolidate
Teams migrating off Fivetran who want to keep their existing dbt models
Data teams preparing data for AI who need lineage and quality checks before data reaches models
Pricing: Custom pricing based on data volume and feature requirements. Contact us for detailed pricing information.
2. Fivetran
Fivetran is the best-known managed ETL tool, with a large SaaS connector library and little setup. It has also grown well beyond ETL. It bought Census for reverse ETL and Tobiko Data (the team behind SQLMesh) in 2025, then completed its merger with dbt Labs in June 2026. The combined company operates as Fivetran + dbt Labs.
Key features:
Managed connectors that need little configuration
Broad SaaS coverage across major business applications
Change data capture for databases
Transformation through dbt and reverse ETL through Census, now under the same company
Strengths:
Low maintenance for standard SaaS sources
One of the largest connector libraries on the market
Mature documentation and a large user community
dbt is widely used for transformation, and it now comes from the same vendor
Limitations:
Pricing changed in 2025. Model your costs on current pricing before renewing
Putting ETL, transformation, and reverse ETL with one vendor increases switching costs later
Batch-based, so not built for sub-second streaming
Debugging visibility is limited compared to tools with table-level logs
Many connectors are Lite connectors, built for specific use cases with fewer endpoints. Check that the tables you need are supported before committing
ETL, dbt, and Census started as separate products. The merger closed in June 2026, so check how they’re packaged and priced together today
Best for: SaaS-heavy stacks that need standard connectors with little setup, and teams already standardized on dbt who want one vendor for ETL and transformation.
Teams that move from Fivetran to Matia see about 30% better cost efficiency. PayIt cut costs 38% in its first month off Fivetran. See Matia vs Fivetran or estimate your savings with the Fivetran savings calculator.
3. Airbyte
Airbyte is the most widely used open source ETL tool. You can self-host it for free or use Airbyte Cloud. Its connector catalog includes official connectors plus a large set built by the community, and its connector builder lets teams create custom connectors without starting from scratch.
Strengths:
No license fee for the self-hosted version
Full access to the code, so you can fix or extend connectors yourself
Connector builder for long-tail and internal APIs
Active community
Limitations:
Community connectors vary in quality and maintenance
Self-hosting means your team owns upgrades, scaling, and on-call
Large database syncs and CDC often need tuning to run reliably
Observability and alerting are basic compared to dedicated tools
Best for: teams with strong engineering capacity who want control over their connectors, or need sources no managed vendor supports.
Pricing: free self-hosted. Airbyte Cloud and enterprise editions are paid. Check current plans on Airbyte’s site.
4. Informatica
Informatica is the long-standing enterprise standard for data integration, data quality, and master data management. Salesforce completed its acquisition of Informatica in November 2025, and Informatica now operates as a Salesforce subsidiary.
Strengths:
Broad platform covering integration, data quality, MDM, and governance
Runs in the cloud, on-prem, or hybrid
Large partner and systems integrator network
Proven at very large scale
Limitations:
High cost and long implementations that often need specialized consultants
More platform than most cloud-first teams need
Teams outside the Salesforce ecosystem should ask how the roadmap will change under Salesforce ownership
Best for: large enterprises with complex governance requirements, legacy systems, or existing Informatica investments.
Pricing: consumption-based. Contact Informatica.
5. Snowflake Openflow
Openflow is Snowflake’s own data loading service, launched in June 2025 and built on Apache NiFi. It handles batch and streaming data, including unstructured files from sources like SharePoint and Google Drive for AI use cases. You can run it in your own AWS VPC or let Snowflake manage it.
Strengths:
Billed and governed inside your Snowflake account
Handles unstructured data for Snowflake Cortex AI use cases
Batch and streaming in one service
Limitations:
Built for Snowflake. It’s not the right fit if you use more than one warehouse or plan to switch
Connector coverage is narrower than dedicated ETL vendors, and some connectors are still in preview
NiFi-based flows take time to learn
No reverse ETL or cross-stack observability
Best for: Snowflake teams that need lightweight connectors with minimal data volume.
Pricing: Snowflake charges for data loading, and in the bring-your-own-cloud model you also pay your cloud provider for compute.
6. Databricks Lakeflow Connect
Lakeflow Connect is Databricks’ managed data loading service. It lands data in Delta tables governed by Unity Catalog and runs on Databricks Workflows. Generally available connectors include Salesforce, Workday, ServiceNow, Google Analytics, SQL Server, and PostgreSQL, with more in preview.
Strengths:
Data lands directly under Unity Catalog governance
CDC for SQL Server, PostgreSQL, and MySQL
No separate vendor contract if you already run on Databricks
Limitations:
Only loads into Databricks
Connector list is short compared to dedicated ETL vendors, and several are still in preview or beta
No reverse ETL or observability outside Databricks
Best for: teams fully committed to Databricks with mostly mainstream sources.
Pricing: billed as Databricks usage.
7. Matillion
Matillion is best known for visual, drag-and-drop transformation that runs inside your warehouse. Matillion pushes the work down to Snowflake, Databricks, BigQuery, or Redshift.
Strengths:
Visual transformation builder for teams that prefer it to SQL
Pushes compute down to the warehouse
Good fit for analysts and mixed-skill teams
Limitations:
Data loading is lighter than transformation. Many teams pair it with a separate ETL tool
Visual pipelines can be harder to version, review, and test than dbt code
Credit-based pricing takes work to forecast
Best for: teams most focused on visual transformation.
Pricing: credit-based.
8. Qlik Talend and Stitch
Qlik acquired Talend in 2023, and with it Stitch. Talend is a broad integration and data quality suite. Stitch is a simpler ELT service for moving SaaS and database data into a warehouse.
Strengths:
Talend covers integration, data quality, and governance in one suite
Stitch is quick to set up for basic ELT
Fits teams already using Qlik for analytics
Limitations:
Talend has a steep learning curve and longer implementations
Stitch has limited transformation and monitoring
Check each product’s roadmap, since both now sit inside Qlik’s broader portfolio
Best for: mid-market and enterprise teams already invested in Qlik.
Pricing: subscription.
9. Rivery
Boomi acquired Rivery in December 2024. Rivery offers CDC, ELT, orchestration, and reverse ETL in one SaaS product, and it’s now part of Boomi’s integration platform.
Strengths:
CDC, ETL, and reverse ETL in one tool
Visual setup
Fits teams already using Boomi for application integration
Limitations:
Roadmap now tied to Boomi’s iPaaS priorities. Ask how it’s packaged and sold today
Less depth for very large databases
Observability is basic
Best for: mid-market teams already using Boomi.
Pricing: usage-based. Contact Boomi.
10. Hevo Data
Hevo is an ELT tool you can set up without writing code. It targets smaller teams that need data in a warehouse without dedicated data engineers.
Strengths:
Fast setup without writing code
Predictable tiered pricing
Good fit for standard SaaS sources
Limitations:
Less control for complex or custom pipelines
Not built for very large database replication
Limited observability and lineage
Best for: small and mid-size teams with standard sources and limited engineering time.
Pricing: tiered by event volume.
11. Estuary
Estuary is built for real-time CDC and streaming. It captures changes from databases and SaaS sources and delivers them to warehouses, lakes, and other systems with low latency, while also supporting batch.
Strengths:
Low-latency CDC from production databases
Streaming and batch in one tool
Can deliver the same data to several destinations
Limitations:
Smaller connector catalog than the largest vendors
Fewer configuration options for teams with complex pipeline requirements
No reverse ETL or catalog
Best for: teams that need real-time streaming without deep configuration options.
Pricing: usage-based.
12. AWS Glue
AWS Glue is Amazon’s serverless data integration service. It runs Spark-based ETL jobs and includes the Glue Data Catalog, which many AWS teams use as their metadata store.
Strengths:
Serverless, with no infrastructure to manage
Works with S3, Redshift, Athena, and other AWS services
Pay only for the compute you use
Limitations:
Few pre-built connectors for SaaS sources outside AWS
Spark jobs need engineering skill to build and tune
Debugging and cost tracking can be slow
Best for: engineering teams running mostly on AWS.
Pricing: pay per compute hour.
13. Azure Data Factory
Azure Data Factory is Microsoft’s cloud data integration service, with a visual pipeline designer and connectors across Azure and many outside sources. Microsoft also offers Data Factory inside Microsoft Fabric, so check which one fits your roadmap.
Strengths:
Close integration with Azure Synapse, Fabric, and other Azure services
Visual pipeline designer
Hybrid connectivity to on-prem sources
Limitations:
Pricing has many components and is hard to forecast
Complex transformations often need extra services
Best value is inside the Azure ecosystem
Best for: teams running mostly on Azure.
Pricing: pay per activity and pipeline run.
14. IBM DataStage
IBM DataStage is an enterprise ETL platform built for high-volume, parallel processing. It runs on-prem, in the cloud, or hybrid, and is part of IBM’s Cloud Pak for Data.
Strengths:
Proven at high volumes and complex transformations
Parallel processing engine
Strong enterprise support
Limitations:
High licensing and infrastructure cost
Steep learning curve and long implementations
Fewer modern SaaS connectors than cloud-first tools
Best for: large enterprises with existing IBM investments and heavy on-prem workloads.
Pricing: license or subscription. Contact IBM.
15. Striim
Striim focuses on real-time streaming and database replication. It’s used where data has to move continuously, such as from Oracle or SQL Server into a cloud warehouse with minimal lag.
Strengths:
Low-latency CDC, including from Oracle and SQL Server
In-flight processing on streaming data
Runs in the cloud or on-prem
Limitations:
Costs more than batch tools
Less suited to SaaS sources and batch analytics
Smaller ecosystem than the largest vendors
Best for: enterprises that need continuous replication from operational databases.
Pricing: subscription. Contact Striim.
FAQ
What is the best ETL tool in 2026?
It depends on your sources and your team. For SaaS-heavy stacks with little engineering time, managed tools like Fivetran or Hevo are the simplest. For large Postgres or MongoDB databases, or teams that want ETL, reverse ETL, observability, and catalog in one platform, Matia is built for that. Teams fully committed to Snowflake or Databricks should also look at Openflow or Lakeflow Connect.
What’s the difference between ETL and ELT?
ETL transforms data before loading it into the warehouse. ELT loads raw data first and transforms it inside the warehouse, usually with dbt. Most modern cloud tools run ELT, though the industry still calls the category ETL.
What’s the best ETL tool for Postgres?
Look for CDC support, parallel syncs for large tables, and table-level logs. Initial loads on large databases are where most tools struggle. Matia’s parallel syncs cut Ramp’s business-critical resyncs from 3.5 days to 4 hours.
Is there a free or open source ETL tool?
Yes. Airbyte’s self-hosted version is free and open source. You pay instead in engineering time to host, upgrade, and support it.
The shift from traditional ETL (Extract, Transform, Load) pipelines to ELT (Extract, Load, Transform) has been driven by the growing need for real-time data processing and analytics. Traditional batch-based ETL pipelines struggle to handle large volumes of continuously streaming data, which are increasingly non-negotiable for modern analytics use cases. Modern cloud data warehouses have made it feasible to load both structured and unstructured data at scale before transforming it, enabling faster, more flexible, and cost-efficient pipelines. ELT allows transformations to occur on-demand, without being constrained by data volume during extraction or loading. This paradigm not only accelerates insights but also aligns better with the scalability and elasticity of modern data infrastructure.
Modern data stacks increasingly favor the ELT (Extract, Load, Transform) approach, with dbt (data build tool) emerging as the de facto standard for the transformation layer. Widely adopted by analysts and data engineers, dbt is a framework to transform, clean, and aggregate data within your data warehouse. Its unified platform approach streamlines the entire transformation lifecycle by providing a consistent framework for writing, testing, documenting, and deploying SQL transformation logic and integrating version control and CI/CD practices throughout. This eliminates the need to stitch together separate tools for development, testing, and deployment, making it easier for teams to build, manage, and scale reliable data workflows entirely within their cloud based data warehouses.
In this tutorial, we will explore how to build ELT pipelines using dbt by integrating e-commerce data—such as orders, products, and customers—from a PostgreSQL database into Snowflake. We’ll perform data transformations with dbt to create clean, structured datasets suitable for OLAP analytics, such as customer lifetime value, and product performance metrics. Additionally, we’ll demonstrate how to use Matia to generate dbt models automatically after the integration run.
The role of dbt in modern ETL
In the modern data stack, dbt plays a crucial role as the “T” in ELT (Extract, Load, Transform). It simplifies data transformation by replacing complex ETL pipelines with modular, SQL-based workflows that run directly in cloud data warehouses like Snowflake, BigQuery, and Redshift. By leveraging the power of the warehouse’s native compute, dbt delivers scalable, efficient transformations. It enables you to model data, run quality tests, and generate documentation using familiar tools like SQL and Jinja (a lightweight templating language).
Instead of relying on monolithic ETL scripts, dbt encourages a modular approach in which transformations are broken down into reusable SQL models. These models can be created as views, materialized views, or tables without needing to define their structure using DDL upfront. Instead, models are defined, configured, and documented through simple YAML files.
dbt is also a powerful tool for data quality testing and documentation as it integrates built-in data testing as a core part of the transformation workflow. You can define tests directly within your models — such as ensuring uniqueness, non-null constraints, or referential integrity — to validate data integrity at every step of the pipeline. Once transformations are complete, dbt can automatically generate comprehensive documentation for your data models. This includes detailed descriptions of models, columns, and their relationships. Additionally, dbt provides visual lineage graphs that clearly display model dependencies, allowing stakeholders to understand how data flows through the pipeline and assess the impact of any changes.
Matia was built with dbt in mind. When integrated with Matia, dbt’s transformation process is further enhanced. Matia works seamlessly with dbt to enhance your pipeline with rich metadata management, real-time visibility into data tests, schema management and lightweight orchestration capabilities. This integration ensures tight alignment across the entire data lifecycle, from ingestion (ETL) to transformation and reverse ETL. With features like complete visibility into dbt models and their metadata, bi-directional orchestration, and end-to-end data lineage tracking, Matia and dbt together create a robust, scalable, and fully observable transformation workflow that supports reliable analytics and operational efficiency.
Architecture overview: dbt + Matia integration
In this section, we’ll walk through how to integrate your existing dbt project into Matia’s Data Operations framework. This includes connecting your data warehouse, defining configurations, and running dbt models as part of your automated workflows.
For our purposes, we’ll assume dbt is already set up independently. You can find the instructions here.
The modern ELT architecture using Matia and dbt follows this flow:
Configure Postgres as a Source Connector: Set up Postgres in Matia as the source system to begin ingesting raw data.
Configure Snowflake as your Destination: Instructions in the app will walk you through setting up Snowflake as a destination, whether through the unified setup wizard or leveraging key-pair.
Run the Integration into Snowflake: Matia loads the ingested data into Snowflake, where it becomes available for transformation.
Connect dbt to Snowflake: Use dbt Cloud (via Partner Connect or manual setup) to establish a connection to your Snowflake environment and link your Git repository.
Create dbt Models: Develop modular SQL models in dbt to transform raw data directly within Snowflake. Use ref() to define model dependencies and organize logic.
Trigger dbt Jobs Automatically via Matia: After each ingestion sync is completed, users can configure Matia to automatically trigger the corresponding dbt jobs—ensuring data is transformed, tested, and documented before it's consumed by BI tools or downstream systems.
Setting up your dbt project
Setting up your dbt project is the first step towards building data models using dbt. Here is a step-by-step guide on how to install dbt and configure your project using dbt Core:
Step 1. Install dbt: You can install dbt using the package manager of your choice, such as pip (for Python users) or Homebrew (for Mac users). Detailed installation instructions can be found on the dbt documentation website.
Step 2. Create a dbt project: Once dbt is installed, you can create a new dbt project by running the dbt init command in your terminal.
dbt init dbt_snowflake_project
This will create a new directory structure for your project, including configuration files and sample models.
Step 3. Configure your project: Next, configure your dbt project to connect to your database. This involves specifying the connection details in the profiles.yml file. You can find examples and detailed instructions on how to configure your project in the dbt documentation.
When you invoke dbt from the command line, dbt parses your dbt_project.yml and obtains the profile name, which dbt needs to connect to your data warehouse.
Step 4. Setting up dbt models: dbt recommends a specific directory structure for organizing your data model files and folders. This typically includes a models directory where you can store your data models, a schema directory to define your schema files and a seeds directory to store data seed files.
Here’s what the dbt models might look like:
#models/stg_orders.sql
SELECT
  id AS order_id,
  customer_id,
  order_date
FROM {{ source('raw', 'orders') }}
Step 5. Build your dbt project: Before deploying, make sure to build your dbt project to ensure that your data models are up-to-date and error-free. To build your project, run the command dbt build in your terminal.
Step 6. Deploy your data models by running the dbt run command in your terminal, which will execute all the SQL statements in your data models (.sql file) and create/update tables in your target database.
Step 7: Monitor performance and usage: After deploying your data models, it is important to monitor their performance and usage to ensure that they are running smoothly and efficiently. dbt provides various features and metrics for monitoring, such as:
dbt docs - which generates documentation for your data models,
dbt test - which runs your tests and checks for any issues.
Here is an example of deploying a dbt data model to production:
# Build your dbt projectdbtbuild# Deploy your data modelsdbtrun--targetprod# Monitor performance and usagedbtdocsgeneratedbttest--targetprod# Maintenance and updatesgitcommit-m"Updated data model"dbtpushdbtrun--targetprod
Building your ETL pipelines with Matia & dbt: a hands-on tutorial
Pre-requisites for starting this project
Postgres Aurora Account - Enable logical settings to connect to Matia
Imagine you're building a data pipeline to report on an e-commerce company’s sales performance. The raw data is available in the following format:
Customers table
Orders table
Products table
Our goal is to use dbt to transform this raw data into a Sales Report table that aggregates revenue per product and customer, with historical accuracy and data quality tests.
Once your Postgres Server is set up, we will simulate the ecommerce orders data using the following python script:
import psycopg2
from faker import Faker
import random
from datetime import datetime, timedelta
# --- CONFIGURATION ---DB_CONFIG = {
'dbname': <DB_NAME>,
'user': <USERNAME>,
'password': <PASSWORD>,
'Host':<host-address>,
'port': '5432'}
NUM_CUSTOMERS = 50NUM_PRODUCTS = 10NUM_ORDERS = 200# --- SETUP ---fake = Faker()
conn = psycopg2.connect(**DB_CONFIG)
cur = conn.cursor()
# --- TABLE CREATION ---cur.execute("""
DROP TABLE IF EXISTS orders, products, customers CASCADE;
CREATE TABLE customers (
customer_id SERIAL PRIMARY KEY,
full_name TEXT NOT NULL,
email TEXT UNIQUE NOT NULL,
created_at TIMESTAMP DEFAULT NOW()
);
CREATE TABLE products (
product_id SERIAL PRIMARY KEY,
name TEXT NOT NULL,
category TEXT,
price NUMERIC(10,2) NOT NULL
);
CREATE TABLE orders (
order_id SERIAL PRIMARY KEY,
customer_id INT REFERENCES customers(customer_id),
product_id INT REFERENCES products(product_id),
status TEXT CHECK (status IN ('pending', 'shipped', 'cancelled')),
order_date TIMESTAMP DEFAULT NOW()
);
""")
conn.commit()
# --- INSERT CUSTOMERS ---customers = []
for _ inrange(NUM_CUSTOMERS):
name = fake.name()
email = fake.unique.email()
customers.append((name, email))
cur.executemany("INSERT INTO customers (full_name, email) VALUES (%s, %s)", customers)
conn.commit()
# --- INSERT PRODUCTS ---categories = ['Electronics', 'Fitness', 'Home', 'Books', 'Toys']
products = []
for _ inrange(NUM_PRODUCTS):
name = fake.word().capitalize() + ' ' + fake.word().capitalize()
category = random.choice(categories)
price = round(random.uniform(5.0, 100.0), 2)
products.append((name, category, price))
cur.executemany("INSERT INTO products (name, category, price) VALUES (%s, %s, %s)", products)
conn.commit()
# --- INSERT ORDERS ---cur.execute("SELECT customer_id FROM customers")
customer_ids = [row[0] for row in cur.fetchall()]
cur.execute("SELECT product_id FROM products")
product_ids = [row[0] for row in cur.fetchall()]
statuses = ['pending', 'shipped', 'cancelled']
orders = []
for _ inrange(NUM_ORDERS):
customer_id = random.choice(customer_ids)
product_id = random.choice(product_ids)
status = random.choices(statuses, weights=[0.2, 0.7, 0.1])[0]
order_date = fake.date_time_between(start_date="-90d", end_date="now")
orders.append((customer_id, product_id, status, order_date))
cur.executemany("""
INSERT INTO orders (customer_id, product_id, status, order_date)
VALUES (%s, %s, %s, %s)
""", orders)
conn.commit()
print(f" Loaded {NUM_CUSTOMERS} customers, {NUM_PRODUCTS} products, {NUM_ORDERS} orders.")
cur.close()
conn.close()
Check your Postgres server to see if the data has loaded into your postgres database orders, customers and products table.
Step 2: Integrate Postgres to Snowflake using Matia
Login to your Matia account and go to Integration and search for Postgres in Sources.
Add the credentials for Postgres (username, password, hostname, port, database, replication slot, publication)
Click on Next, and Add Snowflake as the destination and add the credentials as well and enable integration and run the sync.
After the sync, The following tables will be available in your Snowflake environment:
Here is the MATIA_DB.POSTGRES_PUBLIC.ORDERS table:
Step 3: Write dbt models
Once you have initialized your dbt project (dbt init) and successfully connected dbt to Snowflake we can start writing data quality tests in the /models/ folder in the dbt project module installed from your local IDE or in your dbt cloud’s IDE:
Data Quality Tests - Staging
For the three tables: orders, customers and products we will be creating staging models and performing data quality tests such as checking for nulls, casting them to correct data types, and defining constraints such as primary, unique and foreign keys, and specifying relationships between tables using the ref() function to join tables together and create derived datasets on snowflake.
Below is the staging model for customers, where we cast fields to the correct data types and clean up inputs before running data quality tests.
stg_customers.sql:
with raw_customers as (
    select *
    from {{ source('postgres_public', 'customers') }}
)

select
    cast(customer_id as integer) as customer_id,
    initcap(trim(full_name)) as full_name,
    lower(trim(email)) as email,
    cast(created_at as timestamp) as created_at

from raw_customers
Next, here’s the staging model for products, which prepares product data for downstream testing by casting and cleaning key fields.
stg_products.sql:
with raw_products as (
select*from {{ source('postgres_public', 'products') }}
)
selectcast(product_id asinteger) as product_id,
initcap(trim(name)) as product_name,
initcap(trim(category)) as category,
cast(price asnumeric(10,2)) as price
from raw_products
Finally, we stage the orders table by joining it with products, casting fields, and standardizing values. This prepares the dataset for relationship testing and further analysis.
stg_orders.sql:
with raw_orders as (
select*from {{ source('postgres_public', 'orders') }}
),
products as (
select*from {{ source('postgres_public', 'products') }}
)
selectcast(o.order_id asinteger) as order_id,
cast(o.customer_id asinteger) as customer_id,
cast(o.product_id asinteger) as product_id,
lower(trim(o.status)) as status,
cast(o.order_date astimestamp) as order_date,
p.price as order_amount
from raw_orders o
leftjoin products p
on o.product_id = p.product_id
Once staging models are ready, we define tests in schema.yml to ensure data quality. These tests validate uniqueness, nullability, and relationships across tables like orders, customers, and products.
schema.yml file:
In your schema.yml file in the models folder, you can create tests to ensure that order_id, customer_id, product_id is unique and not null, and define the relationship between orders and products to perform joins, and retrieve the order amount from the product price.
version:2sources:-name:postgres_publicschema:postgres_publicdatabase:matia_dbtables:-name:orders-name:customers-name:productsmodels:-name:stg_orderscolumns:-name:order_iddescription:"Primary key for orders"tests: [unique, not_null]
-name:customer_idtests: [not_null]
-name:product_idtests:-not_null-relationships:field:product_idto:ref('stg_products')-name:statusdescription:"Status of the order"tests:-accepted_values:values: ['shipped', 'cancelled', 'pending']
-name:order_amountdescription:"Price from product table"tests:-not_null-name:stg_customerscolumns:-name:customer_idtests: [unique, not_null]
-name:emailtests: [not_null]
-name:stg_productscolumns:-name:product_idtests: [unique, not_null]
-name:pricetests:-not_null
Once the staging models are built, use dbt run to compile and execute them. You should see confirmation messages showing that all three views were created successfully.
Run dbt command:
If all the models run successfully, congratulations! You’re ready to move on to the next step.
After running the models, use dbt test to validate your data. These tests check for nulls, enforce uniqueness, and confirm relationships between tables.
Run dbt tests:
Results will be available in Snowflake
Data Marts - Advanced Metrics
Now, we’ll create a marts directory, and do advanced queries to observe metrics such as product performance, daily revenue, and customer lifetime value.
In the marts directory, you can create the following transformations.
First, we create a model to analyze product performance by joining order and product data. This helps us track total orders, revenue, and average order value per product.
dim_products_performance.sql
with orders as (
select *
from {{ ref('stg_orders') }}
where status != 'cancelled'),
products as (
select *
from {{ ref('stg_products') }}
)
select
p.product_id,
p.product_name,
p.category,
count(o.order_id) as total_orders,
sum(o.order_amount) as total_revenue,
round(avg(o.order_amount), 2) as avg_order_value
from products p
left join orders o
on p.product_id = o.product_id
group by 1, 2, 3
Next, we calculate daily revenue metrics by aggregating orders by date. This gives us visibility into order volume and average value over time.
mart_daily_revenue.sql
with orders as (
select *
from {{ ref('stg_orders') }}
where status != 'cancelled')
select
date_trunc('day', order_date) as order_day,
count(order_id) as order_count,
sum(order_amount) as total_revenue,
round(avg(order_amount), 2) as avg_order_value
from orders
group by 1order by 1
Finally, we build a model to calculate customer lifetime value by aggregating order data for each customer, showing total spend, order frequency, and purchase history.
customers_lifetime_value.sql
with orders as (
select*from {{ ref('stg_orders') }}
where status !='cancelled'),
customers as (
select*from {{ ref('stg_customers') }}
)
select c.customer_id,
c.full_name,
c.email,
count(o.order_id) as total_orders,
sum(o.order_amount) as lifetime_value,
min(o.order_date) as first_order_date,
max(o.order_date) as most_recent_order_date
from customers c
leftjoin orders o
on c.customer_id = o.customer_id
groupby1, 2, 3
With our data marts in place, we can now update the schema.yml file to define tests for these models—ensuring our metrics are accurate, complete, and trustworthy.
To run the tests, use the command: dbt test If any tests fail, dbt will notify you and provide details.
Snapshot for Slowly Changing Dimension (SCD)
To implement a snapshot to track changes in the customer information over time (Slowly Changing Dimension Type 2), inside the snapshots folder, create customers_snapshot.sql:
This snapshot will track changes to the first_name, last_name, and email columns for each customer.
To capture the current state, use the command: dbt snapshot
Over time, this snapshot will record changes, allowing you to maintain a historical view of customer data.
Documentation & Lineage
Once your models and tests are in place, dbt makes it easy to generate documentation and visualize data lineage. This helps your team understand how data flows through the pipeline and where each model fits in the bigger picture.
Documentation - Run dbt docs generate to generate the documentation for your project. dbt introspects your project and your warehouse to generate a JSON file with rich documentation about your project.
Lineage Graph - Run dbt docs serve andclick View Lineage Graph on the bottom right. You are also able to view column-level lineage directly within Matia’s catalog as well, which will provide deeper pipeline information and show your dbt transformations.
Here is the lineage graph in dbt:
And here’s what lineage looks like in Matia. You can specifically see where dbt transformations take place.
Orchestration & triggering jobs
You can trigger jobs in dbt Cloud:
Using GitHub: You canstage and commit your changes after running dbt run and dbt rest locally to validate. Dbt cloud will automatically detect the pull request and run a job if you’ve configured a PR job in the dbt cloud interface.
Using dbt Cloud IDE - If you’re using the dbt cloud IDE instead of working locally: make changes directly into the Cloud IDE, and commit using the built in Git UI
Trigger dbt jobs with Matia: After upstream events, such as data ingestion (e.g., Matia triggering dbt once data lands in the warehouse)
dbt pipeline best practices and troubleshooting
A well-structured dbt project not only ensures scalability and collaboration but also improves performance and cost-efficiency. Below are key best practices and common troubleshooting strategies for building and managing robust dbt pipelines in modern data platforms.
Naming conventions and project organization
Clear naming and modular structure help ensure consistency across models and ease of navigation.
Model Naming: Use prefixes like stg_, int_, fct_, dim_ to indicate the model’s role:
Efficient dbt projects reduce warehouse computation and improve model runtime.
Use incremental models for large tables to avoid full refreshes:
{{ config(materialized='incremental') }}
Leverage {{ ref() }} and {{ source() }} to track dependencies and optimize DAG execution.
Resource management & cost optimization
Running transformations in cloud warehouses like Snowflake or BigQuery incurs compute costs. Optimizing usage is key.
Use ephemeral models for intermediate steps when you don’t need to materialize them.
{{ config(materialized='ephemeral') }}
Use --select and --exclude flags to avoid running unnecessary models:
Common real-world scenarios and solutions from dbt implementation
Real World Scenario #1: Siloed Data and Workflow Bottlenecks
In many organizations, business logic is scattered across teams and tools, leading to data silos and operational friction. Analysts often struggle to access data owned by other departments, relying on data engineers to build custom models or pipelines. This creates bottlenecks, delays reporting, and increases the risk of duplicated efforts—especially when similar models already exist elsewhere. As a result, insights become outdated by the time they're delivered, and trust in the data diminishes.
Solution: dbt Centralizes Logic and Empowers Analysts
dbt solves this by acting as a centralized repository for all data transformation logic. Instead of siloed scripts or undocumented processes, all logic lives in modular, version-controlled SQL models that can be easily accessed, reused, and extended across teams. Analysts with basic SQL skills can independently create and test models in their own development environments, without waiting on engineering. This streamlined workflow eliminates duplication, reduces delays, and enables true cross-functional collaboration—ensuring teams always work from a consistent, trusted layer of data.
Real World Scenario #2: Lack of Trust and Understanding in Dashboard Data
In many organizations, business users and analysts struggle to understand where the data in dashboards originates or how to interpret key metrics. This disconnect often stems from poor or fragmented documentation—scattered across Excel files or embedded in legacy ETL tools. Analysts waste time tracing data logic and can’t confidently explain discrepancies, leading to confusion and lost trust.
Solution: Centralized Documentation and Lineage with dbt
dbt embeds documentation directly into your transformation pipelines, ensuring all users understand where data comes from and how it's transformed. With dbt Docs, you can:
Document sources, models, and business logic at each step.
Visualize data lineage from raw sources to dashboards.
Host documentation for self-service access (via dbt Cloud or internally).
Align data teams and business users with a shared understanding.
This reduces confusion, builds trust, and accelerates insight delivery.
Real World Scenario #3: Data Pipeline Issues Are Discovered Too Late
A common and costly issue for many organizations is realizing too late that something has gone wrong in their data pipeline. Without automated testing and observability, problems like missing data, broken transformations, or source replication failures often go undetected until after reports are delivered or decisions are made. Setting up proactive monitoring and testing is essential—but building this from scratch can be time-consuming and complex.
Solution: dbt Testing and Native Observability Help Catch Issues Early
dbt makes proactive data quality testing simple and effective with built-in support for common tests like not null, unique, accepted values, and referential integrity. These tests are defined directly in YAML alongside your model documentation, making it easy to integrate quality checks into your workflow. For more complex needs, custom tests can be written using SQL and Jinja. dbt Cloud enhances this by providing automated notifications, alerting your team the moment something goes wrong.
For deeper monitoring, tools like Matia offer dbt-native observability. Without the need for additional platforms, Matia integrates directly with your dbt project to ingest test results, detect anomalies in freshness, volume, or schema, and provide guided setup for custom monitors. This extends dbt’s capabilities, allowing your team to quickly detect and resolve issues—before they impact downstream users.
Together, dbt and observability tools shift your team from reactive troubleshooting to proactive data reliability, improving trust and saving valuable time and resources.
How Matia’s dbt integration adds value
The Matia dbt integration provides complete visibility into your dbt models and jobs and their metadata.
Here are some of the capabilities we’ve outlined above
Bi-directional orchestration between Matia and dbt workflows
Ingestion (ETL) to dbt: Trigger dbt jobs after Matia ingestion sync is completed
dbt to Reverse ETL: Initiate Matia RETL jobs once dbt jobs finish running
The Model Discovery featureoffers a comprehensive catalog of all dbt models and jobs, enabling users to easily navigate and explore their data assets. Additionally, it supports automated documentation synchronization, ensuring that any changes made to models are consistently reflected in the documentation, promoting transparency and efficient collaboration across teams.
Deep data liineage provides a visual representation of model dependencies within your dbt project, making it easy to understand how data flows through your pipeline. It is valuable for performing impact analysis, helping users assess the effect of upstream or downstream changes before they are implemented, ensuring smoother deployments and reducing the risk of breaking dependencies.
In the video above, you can also see that Matia includes a testing and validation capability thatensures the ongoing health of your dbt environment by providing real-time visibility into test execution and historical tracking of data test results. It offers detailed failure analysis to quickly pinpoint and resolve issues.
Conclusion
In this guide, we walked through how to build and orchestrate a modern ELT pipeline using dbt, integrated with tools like Matia and Snowflake. Starting from raw data ingestion (e.g., Postgres), through transformation in dbt, and ending with analytics-ready models, we demonstrated how dbt enables scalable, modular, and testable workflows using familiar SQL.
What we covered
Setting up Postgres to Snowflake integration with Matia
Connecting dbt to Snowflake
Writing and organizing modular SQL models to stage tables, perform data quality checks, and build data marts that serve as curated layers that simplify complex raw data for downstream analytics and reporting.
Orchestrating dbt jobs after ingestion to transform raw data into analytics-ready models—supporting both reporting and Reverse ETL workflows.
Best practices for naming, performance, and cost management
Advanced dbt features to explore
dbt Packages for reusable macros and models
Snapshots for slowly changing dimensions (SCDs)
dbt Semantic Layer (beta) for centralized metric definitions
dbt Mesh for cross-team collaboration and model ownership
Exposure tracking to link models to BI dashboards
dbt artifacts, which drive the Discovery API and dbt Explorer, offer invaluable observability across all dbt projects, allowing teams to monitor performance, spot patterns, and detect problems across the organization.
Every company wants to be more data-driven, but turning insights into action remains a challenge. Reverse ETL may be the missing link between your data warehouse and the business tools teams use daily.
With the widespread adoption of modern cloud data warehouses like Snowflake, organizations now have access to more data than ever before. Historically, these systems have been the domain of technical data professionals, but business teams increasingly require direct access to this information. This growing demand for operational data has fueled the rise of Reverse ETL, enabling non-technical teams to leverage data more effectively in their daily workflows.
What is reverse ETL?
Reverse ETL is a modern data integration process that moves data from a central data warehouse, like Snowflake or Databricks, back to operational business tools, like CRMs (HubSpot, Salesforce), Communication tools (Slack), and/or finance tools. This process emerged as a critical component of the modern data stack, addressing the need to close the analytics-to-operations loop and enable operational analytics and even database replication. By facilitating the flow of enriched data from centralized repositories to everyday business tools, Reverse ETL empowers teams across an organization to make data-driven decisions and take action based on the latest insights
Reverse ETL vs ETL
Extract, Transform, Load (ETL) and Reverse ETL are two distinct data integration processes that serve different purposes within an organization's data strategy.
ETL (Extract, Transform, Load): ETL is a traditional process that extracts data from various source systems, transforms it, and loads it into a centralized data warehouse. This approach enables organizations to consolidate data from multiple sources for comprehensive analysis and reporting. By centralizing data, ETL facilitates business intelligence efforts, allowing data teams to derive insights that inform strategic decision-making.
Reverse ETL: In contrast, Reverse ETL takes the transformed data residing in the data warehouse and syncs it back to operational tools such as Customer Relationship Management (CRM) systems, marketing platforms and other business applications. This process ensures that enriched data is accessible across various applications, enabling broader use within the organization.
By doing so, reverse ETL empowers business teams to leverage up-to-date insights directly within their daily workflows, facilitating real-time, data-driven actions.
The chart below summaries key differences between reverse ETL and ETL.
ETL
Reverse ETL
Data Flow Direction
Moves data into the warehouse
Moves data from warehouse to SaaS tools
Primary Users
Used by data engineers
Used by business and ops teams (with assistance from Data engineers)
Purpose
Centralize data for comprehensive analysis and reporting
Operationalize & activate data by making it readily available in the tools used by various business units,
Understanding these differences is crucial for organizations aiming to implement a modern data stack that not only analyzes data but also seamlessly integrates insights into everyday business processes.
Technical architecture and components of reverse ETL
The technical architecture of Reverse ETL systems comprises several key components:
Connectors
Connectors are integral to reverse ETL platforms, enabling seamless data transfer between the data warehouse and various operational tools. They facilitate the extraction of data from the warehouse and its subsequent loading into target applications. Common destinations supported by Reverse ETL connectors include many of the following systems
SQL models in reverse ETL: structuring data for operational use
In Reverse ETL processes, SQL models play a pivotal role in preparing and structuring data for seamless integration into operational systems. These models are essentially SQL queries or scripts that define the specific data sets that will be extracted from the data warehouse, transformed as necessary, and then synced to target applications.
Below is a view of the SQL model configuration in Matia Reverse ETL
Role of SQL models in reverse ETL
Data Selection: SQL models allow data teams to precisely define which data to extract from the warehouse, ensuring that only relevant and necessary information is prepared for syncing.
Data Transformation: Through SQL queries, data can be transformed to match the schema and requirements of the destination systems, facilitating smooth integration.
Data Filtering and Aggregation: SQL models enable filtering and aggregation of data to create tailored datasets that meet the specific needs of business teams.
The result of the SQL query above is shown below:
Complex SQL models often go beyond simple filtering and involve joining multiple tables, applying window functions, or performing aggregations to create actionable datasets for business tools. For instance, instead of just pulling recent contacts, you might calculate customer lifetime value, rank leads based on engagement scores, or enrich contact records with data from product usage tables. These more advanced queries ensure that the data synced to operational tools is not only current but also context-rich, enabling sales, marketing, or support teams to make smarter, data-driven decisions.
Data field mapping in reverse ETL
Before syncing data to operational tools, it's necessary to map the fields it to align with the specific schema and requirements of the target system. To do this, you must map the warehouse to the corresponding fields in the destination application, ensuring compatibility and consistency. For instance, customer segmentation data in the warehouse might be reformatted to match the structure expected by a CRM system.
Sync mechanisms in reverse ETL: mirror syncs and insert-only syncs
Sync mechanisms determine how data is transferred from the data warehouse to operational tools. Two common approaches are Mirror Sync and Upsert Sync, each catering to different data synchronization needs.
Mirror Syncs
Mirror Syncs aim to replicate the data in the operational tool to match exactly what's in the data warehouse. This method involves inserting new records, updating existing ones, and deleting records in the destination to reflect the current state of the source data.
Mirror syncs are ideal for scenarios where the destination system requires an exact replica of the source data, ensuring consistency across platforms. For example, let’s say your customer success team needed real-time data about NPS scores in Salesforce in order to activate campaigns based on certain scores. If a score is low, you may want the customer success team to reach out ASAP to better understand issues and if a high score, you may want to ask for a review on a third party site, or put your customer in a promoter campaign. That may be collected in the product (or another third party app), and sent to Snowflake, but Snowflake isn’t easily accessible by most business users. With an RETL platform, you can configure scores to automatically update salesforce (and even trigger a slack notification) once done.
While having this data in end tools can be helpful to business users, mirror syncs can be resource-intensive and costly. This is because they require frequent updates, including inserting, modifying, and deleting records, to keep the destination system fully synchronized with the data warehouse.
Upserts
Upsert, a combination of "update" and "insert," focuses on adding new records and updating existing ones in the destination system without deleting any data. This approach ensures that the destination contains the most recent information without removing any records.
Use Case: Suitable for situations where it's crucial to keep data updated and add new entries, such as maintaining up-to-date customer information in a CRM system.
Considerations: Since Upsert doesn't delete records, discrepancies between the source and destination data can occur over time. It's crucial to implement data validation mechanisms to monitor and address any inconsistencies.
Mirror Sync vs. upserts: a comparison
Feature
Mirror Sync
Upsert
Core Action
Replicates source data exactly in the destination
Updates existing data and inserts new data
Data Handling
Inserts, updates, and deletes records to match the source
Inserts new records and updates existing records; does not delete
Destination Data
Exact replica of source data
Contains the most recent information, with older records preserved
Use Case
Maintaining identical data across systems; real-time data replication
Keeping data updated and adding new entries, such as customer information in a CRM
Resource Intensity
Can be resource-intensive due to frequent updates and deletions
Generally less resource-intensive than mirror sync
Potential Issues
Higher cost, requires careful management of updates and deletions
Potential for data discrepancies over time if not managed properly
Analogy
Like a mirror reflecting an image
Like adding and editing entries in a document
Monitoring quality, observability and handling errors
Your data is only useful if it’s accurate. To maintain the reliability of data flows, some Reverse ETL systems incorporate monitoring and error handling components
Monitoring tools track the status of data sync processes, providing visibility into successful records transfers, rejected records from the 3rd party applications, and Invalid records in the warehouse such as duplications or invalid nulls. They help ensure data quality. The Matia platform allows for observability to be built into every step of its data pipelines, including reverse ETL.
Error handling processes involve error handling and debugging mechanisms that detect issues such as data mismatches or transfer failures. They may include automated retries, logging of errors for further investigation, and notifications to data engineers for prompt resolution.
Implementing comprehensive monitoring and error handling ensures data integrity and minimizes disruptions in business operations. Many tools, such as Matia, include built-in observability capabilities that can remedy errors.
In the Matia Platform, we’ve built a robust debugging mechanism for handling “rejected records.” The platform exposes both the API request and response payloads, giving customers full visibility into exactly why a record was rejected. This transparency makes it easy for users to identify mismatches in their data and resolve issues on their own, quickly and efficiently.
By integrating these components, connectors, data transformation layers, sync mechanisms, and monitoring tools, Reverse ETL systems effectively bridge the gap between data warehouses and operational applications, empowering organizations to act on insights with confidence.
Real-world use cases and impact of reverse ETL
Reverse ETL enables organizations to operationalize their data by syncing information from data warehouses to various business tools, enhancing functions such as personalized marketing, sales prioritization, and customer service optimization. Below are specific applications illustrating how data flows from warehouses to operational tools.
Personalized marketing
By leveraging Reverse ETL, marketing teams can deliver tailored content and campaigns to individual customers:
Data flow: Customer behavior and interaction data are stored in the data warehouse. Reverse ETL processes extract this data and sync it to marketing platforms like Marketo or Mailchimp.
Application: Marketers use this enriched data to create personalized email campaigns, product recommendations, and targeted promotions, enhancing customer engagement and conversion rates.
Sales prioritization
Sales teams can focus their efforts more effectively by utilizing Reverse ETL to access valuable customer insights:
Data flow: Product usage statistics and customer engagement metrics are consolidated in the data warehouse. Reverse ETL syncs this data to CRM systems such as Salesforce.
Application: Sales representatives receive real-time alerts about high-potential leads or customers showing signs of churn, enabling timely and prioritized outreach.
Customer service optimization
Enhancing customer support is achievable through Reverse ETL by providing service teams with comprehensive customer data:
Data flow: Customer purchase histories and support ticket information are aggregated in the data warehouse. Reverse ETL syncs this data to customer service platforms like Zendesk.
Application: Support agents access a unified view of customer interactions, allowing for personalized and efficient responses to inquiries and issues.
Unlocking the full potential of reverse ETL
Reverse ETL has emerged as a crucial component of the modern data stack, bridging the gap between analytical insights and real-world operational execution. By enabling businesses to move data from centralized warehouses into frontline applications, Reverse ETL empowers teams to act on the latest data without requiring technical expertise.
From personalized marketing and sales prioritization to enhanced customer support, Reverse ETL ensures that data is not just stored and analyzed but actively leveraged to drive business outcomes. Its flexible architecture, encompassing key components like connectors, SQL models, sync mechanisms, and monitoring tools, provides a scalable and reliable foundation for real-time data activation.
Reverse ETL can be time consuming to execute manually (see the guide here if you want to try), which is why solutions such as Matia exist.
We’re back with another round of product wins. In May and June, we focused on giving you more control over your integrations, some new integrations, tighter observability, and more secure connection flows. You’ll find new tools to automate setup, monitor smarter, and integrate more deeply with your internal systems.
Control your integrations & new connectors
New API endpoints for integrations
This is especially useful for platform teams looking to standardize deployments across multiple environments or save time when onboarding new sources.
You can now manage nearly every part of your integration setup through API. Create assets, assign tags, and spin up new integrations programmatically. For teams managing large or frequently changing environments, this makes automation easier and reduces the need to hop into the UI.
Set rate limits per integration
You can now define custom rate limits on a per-integration basis. This helps you manage throughput across platforms like Stripe, Salesforce, or HubSpot, and prevents throttling or rejected requests.
New connectors
Matia has allowed for bi-directional syncs from the start, meaning you can do both ETL and reverse ETL in one platform. We added four new connectors to help teams unify their data across analytics, customer success, logistics, and outbound messaging.
You can now integrate:
STAT Search Analytics – bring in keyword tracking and search visibility insights into your warehouse
Vitally – sync customer health and engagement metrics from your CS platform
Shipbob – A highly-requested connector from many of our logistics customers, Shipbob allows you to pull order, fulfillment, and logistics data from your 3PL
Attentive – Matia’s newest destination connector, enabling you to push enriched customer data directly into your SMS campaigns via reverse ETL These additions make it even easier to operationalize data across your go-to-market stack and serve cross-functional teams.
A better observability experience
Machine learning (ML) that adapts to your pipelines
Anomaly detection is all about striking the right balance. If your alerts are too sensitive, your team will eventually start ignoring them; however, if the appropriate thresholds are not in place, it can wreak havoc on your data pipelines.
Our ML detection engine is here to find that balance. Unlike static thresholds or rule-based alerts, Matia’s ML-powered approach adapts to your historical patterns and flags only the deviations that matter. Whether it's a drop in sync volume or a spike in run failures, you’ll catch it before your stakeholders do.
That means fewer false positives, fewer noisy alerts, and more focus on meaningful incidents.
Redesigned monitor page
We redesigned the monitor page to give you faster access to the insights that matter most. Key upgrades include:
Faster load times across the board
Easier filtering by monitor type, asset, or tag
A new global search bar to quickly find the monitors you need
If you’re managing a complex data environment, this redesign makes your daily workflows smoother and more efficient.
Webhooks for all
Incident notifications are never fun, but they're a necessary part of any maturing data management program. That's why Matia now support real-time notifications via webhooks, allowing for ultimate flexibility and integration into your existing systems and workflows. When an incident occurs, Matia can send a notification to platforms, ticketing systems, or automation tools you already use.
While no one wants additional Jira tickets, being able to have Matia automate the process can relieve some of the burden so your team can focus on resolving the issue at hand.
Easier Snowflake setup: Unified flow and key-pair
On the heels of Snowflake Summit and our partnership announcement, we’ve been deepening our capabilities with Snowflake, and making it easier than ever to establish a connection with security top of mind. This enables both Matia’s enterprise customers to continue to deepen their use of the platform, and enables our startup customers to move even faster when onboarding to Matia.
First, we created a step-by-step unified setup wizard. Users can connect ETL, Reverse ETL, Catalog and Observability in one spot. The setup is customized for each user role, which provides increased visibility into cost and maintenance. Users simply choose the Matia platform products they need, add the account information and the platform walks you through the process of setting everything up, from whitelisting Matia’s IPs to generating the Snowflake SQL commands in your console to set up the required permissions. It’s pretty seamless.
Next, users can also now connect their Snowflake environment to Matia using a secure key-pair authentication method - whether encrypted or unencrypted.
This eliminates the need to manage static credentials and aligns with best practices for enterprise security. Whether you’re setting up Snowflake for the first time or migrating to key-based auth, the process is now faster and more secure.
That’s a wrap
Everything here is now live. Up next: new BI integrations, granular roles and permissions, and more.
If there’s something you want to see next, reach out to us.
We’re thrilled to announce that Matia is now a Select Partner in the Snowflake Partner Network (SPN). Hooray!
This milestone is a big one for us and a natural fit. Our mission has always been to simplify the modern data stack with a single platform for data ingestion/ETL, reverse ETL, catalog, and observability.
A significant portion of our customers already use Snowflake as their warehouse of choice, and we’ve built Matia with that in mind.
We also had the chance to attend Snowflake Summit this June—our first official U.S. trade show. It was a great opportunity to connect with data leaders, learn from the ecosystem, and share how Matia is helping teams unify their data stack.
With Snowflake’s Data Cloud and Matia’s all-in-one platform, data teams can now go from raw to reliable, without juggling half a dozen point solutions. Matia users on Snowflake get real benefits from the moment they use it.
On the ETL front, Matia allows users to open parallel streams, meaning your data gets to Snowflake faster. Ramp reduced sync times by 80% with Matia + Snowflake, and there are countless examples of other customers that have followed suit. At Snowflake Summit, we also announced Matia’s enhanced data catalog, allowing users to pull Snowflake tags into the Matia platform, allowing for faster data discovery and enhanced metadata context.
In Part 1 of this series, we focused on listening, auditing, and laying the groundwork for trust. By now, you’ve built relationships, mapped your stack, and surfaced key themes. You’ve likely delivered a few small wins. Now it’s time to transition from observation to orchestration.
Days 31-60 are all about designing and aligning. It’s your job to make sense of what you've learned, define the role of your team, and chart a path forward that aligns with business goals. This is where you go from student to strategist and executor. You are now out the walk phase, but not quite ready to run.
30-60 Day Plan for Data Leaders: From Discovery to Direction
Objectives for Days 31–60
Define your data team’s mission and scope
Align your roadmap with company priorities
Propose a structure that enables execution
Launch your first priority project
Key Actions for Data Leaders in Their Second Month
Draft Your Data Team Charter
If your team’s mission isn’t clear, others will define it for you. A strong charter gives your team focus and shields it from randomization. It's meant to be high level.
Include:
A clear mission (e.g., “Empower the company to make smarter, faster decisions with trustworthy data.”)
Scope of responsibilities & roles (e.g., analytics, engineering, enablement, governance)
Team roles: This is where I dive into what roles are on the team. I leave the 'who' for a separate document
Responsibilities: Overall team responsibilities at a high level. Leave individual responsibilites per role for a seperate document
Rules and norms: how do we behave and operate - I love including this because it’s indicative of the culture you create within your teams
Communication Guidelines: I used to put this in rules and norms, but found value in pulling it out. I love creating a slack channel for data questions as well as doing company wide demos on Fridays(drop in if you can) to showcase the team’s work and create strong mechanisms for cross functional communication
I included an example of what Matia’s data team’s charter may look like as we scale. Data by nature is cross functional, but I always run this by key cross functional stakeholders and ask for feedback.
Pro tip: Add a “What We Don’t Do” section to clarify scope and set expectations with stakeholders.
Make sure to make a note to revisit this every 6 months at least, and more frequently if you are in hypergrowth mode.
Prioritize High-Impact Data Use Cases
Revisit your stakeholder interviews and team feedback. Create a list of up to 10 projects or initiatives as possible candidates for consideration. Make sure you also identify the stakeholder or department requesting this, as it’s important to not look like you’re spending all of your time in one department’s projects.
From here, we’re going to create a prioritization matrix for the best use cases to tackle early. Plot your candidate projects on a 2x2 grid based on impact and effort. For high impact, low effort projects (my favorite),I label them as quick wins. High impact, high effort are strategic bets; low impact, low efforts are classified as Nice-to-haves, and low-impact, high-effort we refer to as time sinks.
Here’s what it might look like:
Example Quick Win: Consistent funnel metrics and Launch self-reporting MVP
Example to Avoid for Now: historical revenue dashboard
Use this matrix in team discussions to align on what “good” looks like and avoid overcommitting.
Prioritization criteria:
Unblocks key business decisions
Supports top-line growth or efficiency
Has visible pain and measurable outcomes
Can be completed (or piloted) in ~4 weeks, with quick wins in under two
In the example above, we choose to move forward with three key projects: Consistent funnel metrics, launch self-serve reporting, and rollout unified PLG dashboard. We chose one quick win projects, and one. We tried to balance everything so every department felt represented in the work we were tackling first
When it came to the strategic bets, although every stakeholder may want their project prioritized, we chose to understand the WHY behind everything and see if there was anything we could deliver quickly. For example, the marketing team requested rebuilding marketing attribution. I rarely have hard and fast rules in a data team, but this is always a project I would heavily caution data leaders from taking on first (if you know, you know). However, when we chatted with the marketing team and more specifically the demand generation and growth lead, we realized that if we helped define more consistent funnel metrics with them, which was the root of the pain they were feeling, we could deliver that quicker, help their alignment with sales, and focus on higher priority items.
Understanding the why can also turn the time sinks into quick wins. Take the Historical Revenue Dashboard, for example — a project that may initially feel heavy, complex, and destined for the backlog. This exact scenario happened to me before. When I asked finance why they needed it, we uncovered a more urgent, solvable need: reliable month-over-month growth numbers for board reporting. Instead of rebuilding historical revenue from scratch, we quickly shipped a clean, automated extract of MRR by month from the current CRM. It solved 80% of their problem in a fraction of the time. By clarifying the pain point behind the ask, we created trust and freed up the team for more strategic work and were able to deepen our relationship with that team.
Propose Your Ideal Data Org Structure
Even without a formal reorg, sketch the ideal structure for delivery and scale.
Questions to consider:
Is the team centralized or embedded?
Where are the skill gaps?
Who owns the data lifecycle management , from ETL/ingestion to insight and dashboard?
Deliverable idea: Create a RACI chart to clarify who owns modeling, dashboards, governance, and requests.
If hiring is needed, draft job descriptions that tie technical skills to business outcomes.
RACI chart can be simple, but here’s how it typically looks at data organization i’ve been a part of. Ever org is different and structures things differently. A slack channel is a great way to keep people informed
Task
Responsible
Accountable
Consulted
Informed
Data Modeling
Data Eng
Head of Data
Analytics
All
Dashboard Creation
Analytics
Head of Data
Data Eng
All
Data Governance
Head of Data
Data Eng
Analytics
ALL
Data Ingestion
Data Eng
Head of Data
Analytics
ALL
Establish a Clear Operating Cadence
Strong teams have structure. Now’s the time to introduce light but effective rhythms that support delivery.
Suggestions:
Weekly team standups (15 mins max)
Biweekly stakeholder check-ins
Monthly reviews of KPIs and roadmap
Sprint planning or project kickoff sessions
Keep the overhead low. The goal is clarity, not calendar bloat.
Bonus: Add a rotating “Data Demo” segment to team meetings to showcase recent work.
Launch and Communicate Your First Initiative
Pick one use case and commit. Your first project should demonstrate the team’s ability to drive business value.
Checklist for kickoff:
Problem statement and success metrics
Key stakeholders and timeline
Data sources, blockers, and assumptions
Communication plan and ownership
Good pilot project examples:
Building an MVP of a large project (make sure you’re aligned on what MVP means) - i always love a self-service mechanism
One large scale unified project (see rebuilding unified PLG dashboard above)
Try to solve what you can with the tools and stack you currently have in place. Is your data not moving to the warehouse efficiently and you may need to look at your ETL solution? Are you seeing a lot of anomalies and stakeholder mistrust of data with existing dashboards? Maybe you need to look at an observability strategy. Resist the temptation to buy anything.
Take note of the pains and inefficiencies as you’re doing it. You’ll want to revisit this shortly.
How to Communicate Early Wins as a Data Leader
Execution is only valuable if others know about it. Communicate clearly and consistently.
Ideas for sharing wins
Before/after screenshots in team Slack
#data-questions slack channel for async Q&A
90-second Loom videos walking through new dashboards
Monthly “Data Wins” roundup email
Share roadmap and results at all-hands or ops syncs
Bi-weekly live data demos - bonus if you let your team really present and just be the one to set it up
Avoid these missteps that can slow down your progress:
Trying to fix everything: prioritize for impact, not coverage
Introducing tools without understanding the root problem
Becoming a bottleneck for every decision. If you have a team, be clear about where you want input and where you just want visibility. That clarity prevents bottlenecks.
This will also help your relationships
Skipping documentation: your future team will thank you
Working in isolation: build with, not just for, stakeholders
Deliverables to Complete by Day 60
Here’s what great looks like by the end of this phase:
A well-socialized data team charter
A prioritized roadmap of use cases
A proposed org structure with roles and ownership
One visible, high-value project in motion
A defined team operating cadence
A simple feedback intake mechanism (e.g., a form or shared doc) - it can be a simple google form that creates a jira ticket
Final Thought: Build with Intention
The next 30 days are your bridge from learning to leading. A clear strategy, a confident plan, and a well-structured team set the tone for everything that comes next.
Coming up: Part 3 – Days 61–90: Execute and Empower. Make sure to review Part 1 as well.
As businesses scale, their data systems must evolve, often introducing new fields to support product features or enhanced reporting. Simultaneously, upstream vendors or data providers may modify schemas independently, without coordinating with internal development teams. Without clear communication or version control, environments fall out of sync.
Consider a retail company that tracks sales performance using dashboards powered by an automated data pipeline. One day, an engineer removes the promo_code column from a source table, assuming it’s obsolete.
The result? Pipelines continue to run without raising errors, but the data they produce becomes unreliable. Dashboards break silently, metrics appear incorrect, and teams waste time chasing false alerts or debugging misaligned reports.
This is schema drift in action: structural changes that silently break downstream processes and erode trust in data without leaving an obvious trace.
Understanding Schema Drift in Practice
Schema drift occurs when the live schema (actual structure) diverges from the expected schema (defined or baseline structure). These changes may include:
Here are common types of schema drift:
Added Columns: A new column, like session_duration, is introduced to a table without informing downstream users, causing joins or transformations to fail unexpectedly.
Dropped Columns: Fields such as phone_number are removed, but are still expected by pipelines, leading to null values or failed validations.
Renamed Columns: Changing user_id to customer_id breaks queries and dashboards that depend on the original column name.
Data Type Changes: Modifying signup_date from DATE to STRING can disrupt filters, aggregations, and time-based logic in reports.
Changes can happen unexpectedly, whether from human error or software bugs, or misconfigured deployment scripts. Without a reliable source of truth to compare against, these changes often go unnoticed until something breaks. If schema drift is not detected and handled, data pipelines become vulnerable to upstream changes, leading to data quality issues, broken transformations, and unreliable analytics.
This lag is why schema validation needs to shift left, meaning it should happen earlier in the data lifecycle, not after pipelines are already in production. Catching schema changes at the point of ingestion or during development helps prevent silent failures and ensures data quality before it affects downstream users. By maintaining a baseline schema, defined and version-controlled, you can catch deviations early, ensure consistency across environments, and reduce the risk of downstream data issues.
Schema Drift vs. Change Data Capture (CDC)
Change Data Capture (CDC) is a powerful method for tracking row-level changes such as inserts, updates, and deletes. It works by reading from a database’s transaction logs, allowing for near real-time replication with minimal overhead. CDC is crucial for keeping systems in sync without needing to scan entire tables.
However, CDC does not monitor structural changes to tables. It won’t detect if a column is added, renamed, or dropped. CDC pipelines may silently skip new or removed fields, leading to incomplete replication or downstream errors. This is why schema drift detection must be paired with CDC: while CDC captures what changed at the data level, schema drift tracking captures how the table structure itself is evolving.
Pairing the two is essential for a reliable data platform. Schema drift detection provides validation checkpoints to ensure that structural changes don’t go unnoticed. It also helps prevent CDC jobs from silently failing or propagating incomplete data. Additionally, integrating schema drift detection with metadata management or data governance platforms ensures schema consistency across the stack.
Components of a Schema Drift Alert System
There are several key components required to build a robust schema drift alert system:
Schema Snapshot Capture
Schema Snapshot Capture is the process of recording the exact structure of a database table, including its column names, data types, and optionally, metadata such as nullability, defaults, or comments, at a specific time.
This snapshot acts as a baseline or “source of truth” for detecting schema drift, which refers to unintended or untracked changes in data structure over time.
Most modern data platforms offer built-in ways to retrieve schema metadata. For example, Snowflake exposes this information through INFORMATION_SCHEMA views, while dbt allows developers to version and test schema expectations through schema.yml files and data tests.
Change Categorization (Breaking vs Non-Breaking)
It is important to categorize the changes in the schema, so the alert system can inform the end users or data consumers that some changes directly impact them.
In an append schema drift, a new schema and/or attribute is added to the table, which generally occurs when a client upgrades a data product to a newer version, and this generally does not cause disruptions to the end users. Appends to the schema are non-breaking for consumers, but it is also advisable to pre-release such changes to avoid any changes in production without the consumer’s prior knowledge.
On the other hand, if there is a downstream schema change where a vendor alters, renames or deletes an existing field from the table, such as renaming the customer_id column to user_id in a central table without communicating to the analytics team, the BI reports, ML methods, and ETL jobs are simultaneously affected leading to outages for shared consumers.
Alerting Mechanism
To handle these scenarios effectively, schema drift alert systems should automatically tag schema changes detected via snapshots with a change_impact field (e.g., breaking or non-breaking). Alerts can then be routed using real-time Slack notifications (e.g., webhooks) or simple email notifications to Snowflake when schema drift is detected.
Alert Lifecycle Management (Open/Closed)
It's also important to track ownership, identifying whether affected columns are used by upstream systems or downstream consumers. Once an alert is triggered, it should enter a lifecycle that helps your team track its status—whether it’s being investigated, has been resolved, or should no longer generate repeat notifications.
Alerts should follow a lifecycle:
OPEN: New drift detected
CLOSED: Drift resolved (e.g., column added back)
Use SQL logic to auto-close alerts when a column is re-added or schema is restored.
Understand Downstream Impact
To effectively detect schema changes, teams must actively track data lineage to understand how data flows and transforms across systems. In addition, performing regular data profiling helps ensure data quality and highlights unexpected structural changes. Integrating data lineage tools like dbt andand now Matia's Catalog allow for automated impact scanning and metadata tagging, helping teams understand the full ripple effect of schema changes before they cause downstream failures. For example, if a column like customer_id is renamed or removed, a lineage graph can show you all the dashboards, models, or joins that depend on it. This allows teams to proactively update or validate those downstream assets before errors occur.
Matia's Catalog allows for tagging, certifying assets, and drills down into column-level lineage tounderstand the downstream (and upstream) impacts.
Handling Schema Drift
When schema drift is detected, it’s essential to take immediate action to maintain data quality and pipeline stability. Start by adjusting your ETL processes to accommodate newly added, removed, or modified columns, this may involve updating transformation logic, data mappings, or validation rules. If the schema change was unintended or caused errors, consider restoring from a recent backup to revert to a stable state. Additionally, ensure that your analytics tools, BI dashboards, and downstream queries are updated to reflect the new schema, preventing broken reports or misleading insights. It's also important to document schema changes and communicate them with relevant stakeholders to maintain transparency and coordination across teams. Finally, consider implementing stricter version control or data contracts to proactively manage schema evolution and reduce the risk of future disruptions.
Implementing a Schema Drift Alert System in Snowflake
In this step-by-step tutorial, we will build a schema drift alert system using Snowflake by leveraging components we have previously defined, including schema snapshot capture, categorizing schema changes, distinguishing between breaking and non-breaking changes, and implementing automated notifications to keep end users informed of these changes via email and Slack integrations.
Overview: Schema Drift Detection and Alerting Workflow
The flowchart below outlines the end-to-end process, starting from capturing schema snapshots to issuing alerts and resolving changes. This system not only detects and logs schema drift but also automates alerting, enabling teams to respond proactively, maintain data reliability, and adjust ETL processes by updating transformation logic to handle newly detected columns or structural changes.
We will be loading the following transactions dataset into Snowflake:
Step 1: Create a schema snapshot table: audit_schema_snapshots
This step creates the audit_schema_snapshots table in Snowflake. The table is designed to store schema snapshots—detailed records capturing the exact structure of your tables at specific points in time. Each snapshot includes:
snapshot_time: Automatically records when the snapshot was taken
table_catalog: The database name of the captured table
table_schema: The schema name within the database
table_name: The name of the table being captured
column_name: The names of the columns within the table.
data_type: Data types associated with each column.
This snapshot table serves as the baseline against which future schema changes (schema drift) can be detected and analyzed.
Step 2: Create a stored procedure that reads INFORMATION_SCHEMA.COLUMNS
The procedure reads the current schema structure from Snowflake's built-in metadata view INFORMATION_SCHEMA.COLUMNS for a given table, and then inserts this schema snapshot into the audit_schema_snapshots table created earlier.
CREATEOR REPLACE PROCEDURE take_schema_snapshot(schema_name STRING, table_name STRING)
RETURNS STRING
LANGUAGE JAVASCRIPT
EXECUTEAS CALLER
AS$$
var schemaName = arguments[0];
var tableName = arguments[1];
var insert_sql = `
INSERTINTO audit_schema_snapshots (
table_catalog, table_schema, table_name, column_name, data_type
)
SELECTUPPER(table_catalog),
UPPER(table_schema),
UPPER(table_name),
UPPER(column_name),
data_type
FROM INFORMATION_SCHEMA.COLUMNS
WHEREUPPER(table_schema) =UPPER('` + schemaName + `')
ANDUPPER(table_name) =UPPER('` + tableName + `')
`;
var stmt = snowflake.createStatement({ sqlText: insert_sql });
stmt.execute();
return'Snapshot taken for '+ tableName +' in schema '+ schemaName;
$$;
Output of current AUDIT_SCHEMA_SNAPSHOT:
This captures and saves the current schema structure of the table "TRANSACTIONS_DB"."PUBLIC"."TRANSACTIONS" into the audit_schema_snapshots table, creating a reliable baseline for future drift detection.
We can automate this as a task to run at your preferred frequency from every 30 minutes, hour, day, etc.
CREATEOR REPLACE TASK schema_snapshot_task
WAREHOUSE = COMPUTE_WH
SCHEDULE ='30 MINUTE'ASCALL take_schema_snapshot('your_schema_name', 'your_table_name');
#Start the Task
ALTER TASK schema_snapshot_task RESUME;
Step 3: Create a Schema Drift Alerts Table
Next, we created a table named schema_drift_alerts that will be used to log and manage any detected schema changes (also known as schema drift) in your Snowflake database. This table acts as the central alerting mechanism of your schema drift detection system.
CREATEOR REPLACE TABLE schema_drift_alerts (
alert_id STRING DEFAULT UUID_STRING(),
table_name STRING,
column_name STRING,
change_type STRING,
impact_category STRING,
status STRING DEFAULT'OPEN', -- OPEN or CLOSED first_detected_at TIMESTAMPDEFAULTCURRENT_TIMESTAMP,
last_detected_at TIMESTAMPDEFAULTCURRENT_TIMESTAMP,
alert_sent BOOLEANDEFAULTFALSE);
This table will allow you to:
Track and log all schema changes over time
Avoid sending duplicate alerts by checking the status and alert_sent flags
Monitor recurring issues with the last_detected_at timestamp
Integrate with notification systems (like email or Slack) to send alerts only when needed
Step 4: Create the Schema Drift Detection Procedure
This stored procedure, log_schema_drift, compares the current schema of a table with its most recent snapshot (stored in audit_schema_snapshots) to detect any schema drift, changes in column structure that have occurred since the last snapshot. It logs the results into the schema_drift_alerts table.
CREATEOR REPLACE PROCEDURE log_schema_drift(table_name_input STRING)
RETURNS STRING
LANGUAGE JAVASCRIPT
EXECUTEAS CALLER
AS$$
var tableName = arguments[0].toUpperCase();
var drift_count =0;
//Get latest snapshot timevar snapshot_stmt = snowflake.createStatement({
sqlText: `SELECTMAX(snapshot_time) FROM audit_schema_snapshots WHEREUPPER(table_name) = ?`,
binds: [tableName]
});
var snapshot_rs = snapshot_stmt.execute();
if (!snapshot_rs.next()) return "No snapshot found for " + tableName;
var snapshot_time = snapshot_rs.getColumnValue(1);
// Compare snapshot to live schema (REMOVED columns)
var removed_stmt = snowflake.createStatement({
sqlText: `
SELECT column_name
FROM audit_schema_snapshots
WHERE snapshot_time = ? ANDUPPER(table_name) = ?
MINUS
SELECT column_name
FROM INFORMATION_SCHEMA.COLUMNS
WHEREUPPER(table_name) = ?
`,
binds: [snapshot_time, tableName, tableName]
});
var removed_rs = removed_stmt.execute();
while (removed_rs.next()) {
var col = removed_rs.getColumnValue(1);
snowflake.createStatement({
sqlText: `
INSERTINTO schema_drift_alerts (table_name, column_name, change_type, impact_category, status)
VALUES (?, ?, 'REMOVED', 'Breaking', 'OPEN')
`,
binds: [tableName, col]
}).execute();
drift_count++;
}
// Compare live schema to snapshot (ADDED columns)
var added_stmt = snowflake.createStatement({
sqlText: `
SELECT column_name
FROM INFORMATION_SCHEMA.COLUMNS
WHEREUPPER(table_name) = ?
MINUS
SELECT column_name
FROM audit_schema_snapshots
WHERE snapshot_time = ? ANDUPPER(table_name) = ?
`,
binds: [tableName, snapshot_time, tableName]
});
var added_rs = added_stmt.execute();
while (added_rs.next()) {
var col = added_rs.getColumnValue(1);
snowflake.createStatement({
sqlText: `
INSERTINTO schema_drift_alerts (table_name, column_name, change_type, impact_category, status)
VALUES (?, ?, 'ADDED', 'Non-breaking', 'OPEN')
`,
binds: [tableName, col]
}).execute();
drift_count++;
}
return (drift_count ===0)
? "No schema drift detected for " + tableName
: `${drift_count} changes detected for ${tableName}`;
$$;
CALL log_schema_drift('TRANSACTIONS');
Here’s what the output looks like
log_schema_drift:
Here's the schema drift alert table:
This would log any added or removed columns in the TRANSACTIONS table and store the results in schema_drift_alerts.
In summary, this procedure:
Compares the live schema to the most recent snapshot
Logs added and removed columns
Labels changes as Breaking (Removing Columns) or Non-breaking (Adding Columns)
Marks all new issues with status = 'OPEN'
Step 5: Add or Remove Columns for Schema Drift Alerts
A PROMO_CODE column is dropped from the TRANSACTIONS table.
The next schema check logs it as a breaking change. A Slack alert is sent and the alert is marked as OPEN. Once the column is re-added, the alert status is automatically CLOSED.
Step 6: Create the Email Notification Procedure
Next, we defined another stored procedure, send_drift_alert_email, which sends out email alerts for new, unresolved schema drifts detected in the system. It uses Snowflake’s native SYSTEM$SEND_EMAIL function and works alongside the schema_drift_alerts table.
CREATEOR REPLACE PROCEDURE send_drift_alert_email()
RETURNS STRING
LANGUAGE JAVASCRIPT
EXECUTEAS CALLER
AS$$
var summary = "";
var rs = snowflake.createStatement({
sqlText: `
SELECT table_name, column_name, change_type, impact_category
FROM schema_drift_alerts
WHERE status ='OPEN'AND alert_sent =FALSE `
}).execute();
var rows= [];
while (rs.next()) {
var table= rs.getColumnValue(1);
var column= rs.getColumnValue(2);
var type = rs.getColumnValue(3);
var impact = rs.getColumnValue(4);
summary += `• ${impact} ${type} -- Column '${column}' in table '${table}'\n`; rows.push([table, column, type]);
}
if (rows.length ===0) {
return "No new alerts to send.";
}
// SAFELY use bind parameterfor email body
var email_stmt = snowflake.createStatement({
sqlText: `
CALLSYSTEM$SEND_EMAIL(
'drift_email_integration',
'your_email@gmail.com',
'Schema Drift Alert',
?
)
`,
binds: [summary]
});
email_stmt.execute();
// Update alerts to mark them as sent
for (let i =0; i < rows.length; i++) {
snowflake.createStatement({
sqlText: `
UPDATE schema_drift_alerts
SET alert_sent =TRUEWHERE table_name = ? AND column_name = ? AND change_type = ? AND status ='OPEN' `,
binds: [rows[i][0], rows[i][1], rows[i][2]]
}).execute();
}
return "Email sent for " + rows.length + " new schema drift alerts.";
$$;
Here’s the output:
Email Notifications:
An email is sent for every new schema drift upon calling the store procedure.
STEP 7: Send Schema Drift Alerts via Slack
This step expands your alerting capabilities by sending real-time schema drift notifications directly to Slack, using Snowflake’s webhook-based notification system.
#Stores your Slack Incoming Webhook URL securely in Snowflake as a secret.
CREATEOR REPLACE SECRET my_slack_webhook_secret
TYPE = GENERIC_STRING
SECRET_STRING ='https://hooks.slack.com/services/...';
CREATEOR REPLACE NOTIFICATION INTEGRATION my_slack_webhook_integration
TYPE=WEBHOOK
ENABLED=TRUE WEBHOOK_URL='https://hooks.slack.com/services/XXXXXXX/XXXXXXX/XXXXX' WEBHOOK_SECRET=my_slack_webhook_secret
WEBHOOK_BODY_TEMPLATE='{"text": "SNOWFLAKE_WEBHOOK_MESSAGE"}' WEBHOOK_HEADERS=('Content-Type'='application/json');
This sets up a Webhook integration that tells Snowflake how to send messages to Slack.
WEBHOOK_URL: Points to your Slack Incoming Webhook endpoint.
WEBHOOK_SECRET: References the secure token you created earlier.
WEBHOOK_BODY_TEMPLATE: Defines the format Slack expects. The placeholder SNOWFLAKE_WEBHOOK_MESSAGE will be replaced with your actual message.
Send a Message via Stored Procedure
You should place this block inside your send_drift_alert_email() procedure, right after inserting or detecting schema changes. This ensures Slack gets notified only once per alert, in sync with your email system.
Upon detecting schema drift, and calling the store procedure, an alert is sent to your Slack account.
Step 8: Automate Drift Checks (Task)
Instead of calling the store procedures for snapshot and detection manually, we can set up a Snowflake task named drift_monitoring_task that automatically runs your schema drift detection and email alerting logic on a recurring schedule, every 30 minutes in this case.
Run log_schema_drift() — calls the log_schema_drift procedure, which compares the current schema of the TRANSACTIONS table to the latest snapshot and logs any added or removed columns into the schema_drift_alerts table.
Run send_drift_alert_email() — After detecting and logging any changes, this line sends email notifications for any new, unresolved schema drifts using SYSTEM$SEND_EMAIL.
This task ensures that schema drift detection and alerting are automated, runs every 30 minutes, and is in real-time. Alerts are sent immediately after drift is detected, which reliably compares against the latest available snapshot
Step 9: Manage Alert Status (Open/Closed)
This step ensures that once a drift issue is resolved (e.g., a column is added back), you can mark that alert as CLOSED so it doesn’t trigger notifications again.
UPDATE schema_drift_alerts
SET status ='CLOSED'WHERE status ='OPEN'AND change_type IN ('ADDED', 'REMOVED')
AND table_name ='TRANSACTIONS'AND column_name IN (
SELECT column_name
FROM INFORMATION_SCHEMA.COLUMNS
WHEREUPPER(table_name) ='TRANSACTIONS' );
We can update the status of schema drift alerts for the TRANSACTIONS table — specifically closing alerts for columns that now exist in the table (i.e., the column was previously flagged as ADDED or REMOVED, but now is present in the actual schema).
To automate closing schema drift alerts, you can implement a recurring validation workflow that:
Checks the actual schema vs. recorded drift alerts
Automatically closes resolved alerts
Logs or notifications on changes
In conclusion, we built an automated system to detect and alert on schema drift in Snowflake. The system captured snapshots of table structures at regular intervals and compared them over time to identify changes such as added or removed columns. Detected changes were logged in a dedicated alert table, where each alert was categorized by impact (e.g., breaking or non-breaking) and tracked by status (open or closed). We implemented automated email and Slack notifications to inform stakeholders of new schema changes in real time. The entire workflow was scheduled to run automatically using Snowflake Tasks, eliminating the need for manual monitoring. Additionally, we built logic to automatically close alerts when previously flagged changes were resolved, such as when a removed column was re-added, ensuring the alert system remained current and accurate. This system helped improve visibility, maintain pipeline stability, and reduce the risks associated with untracked schema changes.
Shifting Left: Preventing Breakage Before it Happens
Observability plays a critical role as a proactive mechanism, enabling teams to monitor schema integrity precisely at the point of data ingestion. Matia’s unified DataOps platform empowers teams to detect and swiftly resolve data anomalies early within the pipeline. With built-in observability, Matia allows data teams to maintain a robust data ecosystem without relying on external tools. In essence, data teams can spend time actually managing data instead of vendors. This ensures high confidence in both data integrity and the performance of downstream AI models.
Matia distinguishes itself through an innovative observability approach, providing continuous visibility into data flows and proactively catching and correcting anomalies as they emerge. Unlike traditional methods, which often address data issues reactively, Matia's proactive "shift-left" strategy identifies and mitigates problems before they can affect end-users. Where other platforms might surface that an integration didn’t run or a schema shifted, Matia will tell you actually what happened, and how to fix it.This ensures data remains consistently reliable, trustworthy, and actionable throughout the entire pipeline.
Matia handles schema drift automatically as part of shift-left observability
As data flows into Matia’s ingestion layer, it is continuously monitored for consistency, freshness, and other quality metrics. Embedding observability directly within the ETL process provides an additional layer of assurance, helping teams proactively address ingestion issues before data reaches the transformation stage. Monitoring data quality during ingestion also reduces reliance on downstream data warehouse queries, ultimately saving infrastructure costs.
Matia’s observability scrutinizes every transformation output, ensuring data is accurately transformed and maintains the necessary quality standards for downstream use. If an error is found, Matia can prevent reverse ETL and other post warehouse actions from triggering as well.
With deep integrations with dbt, Matia users also get detailed metadata on model run results, comprehensive lineage ERDs, and a historical view of past dbt test results. This integration enables users to closely monitor dbt runs and access detailed error reports directly within the platform, eliminating the need for separate monitoring tools.
Alert Fatigue can be a problem, so you need a Strategy: Surfacing Real-Time Alerts Matters
Effective alerting for data teams means integrating notifications directly into the tools they already use, such as Slack. Matia’s Slack integration alerts enables users to update issue statuses directly from Slack without logging into the platform. Users receive instant notifications about schema changes, integration failures, and observability anomalies, reducing unnecessary noise with context-aware alerts. Unlike other observability solutions, Matia’s detailed Slack notifications explicitly identify issues and provide actionable suggestions for quick remediation, significantly enhancing responsiveness and operational effectiveness.
Visualizing schema changes with lineage
Because Matia is a unified platform, users can also see lineage, and be alerted to schema changes, natively in the product, and understand column level lineage. The capabilities will help companies with thousands of models look at their downstream impacts when it comes to schema drift.
Data Contracts: Making Expectations Explicit
There is a need for data contracts among data producers and consumers to shift data quality into being a shared responsibility. Making data expectations explicit in these contracts, such as specifying schema clearly and adding quality guarantees, it brings structure and accountability to data ecosystems by requiring that changes be negotiated and documented. When paired with observability, they become even more powerful: data contracts define what should happen, and observability verifies that it is happening. This combination ensures that expectations are not only agreed upon but also continuously enforced.
Tools like dbt contracts, Monte Carlo, and Matia make it easier to operationalize data contracts. Dbt contracts allow teams to define expected schemas directly within their transformation code, ensuring that changes to upstream models are validated against defined rules before deployment. Matia makes it easier to operationalize data contracts by acting as the observability layer that monitors schema integrity in real time. When a contract is breached, Matia can trigger contextual alerts via Slack or email and integrate it with dbt to surface test results and lineage, helping teams respond quickly and effectively to data quality issues.
Conclusion
The schema drift alert system tutorial demonstrates how organizations can shift left by proactively detecting changes in data structures and enforcing expectations through automation. By combining schema snapshots, drift detection procedures, and alerting mechanisms via Slack and email, teams can maintain visibility and control over evolving datasets.
Matia enhances this workflow by embedding observability directly at both the ingestion and transformation stages, offering real-time visibility into schema changes, data flow disruptions, and quality anomalies. This proactive monitoring reduces reliance on standalone observability platforms by providing built-in context around where issues originate, how they propagate, and which downstream assets are affected. Its integration with tools like Slack and dbt allows teams to respond in real time, surface model dependencies and test outcomes, and consolidate lineage, quality, and contract enforcement into a single observability layer—enabling resilient and trustworthy data operations from source to insight.
We built something new-ish. Something data teams have been asking for. And it lives right inside Matia.
Today, we’re launching the enhanced Matia Data Catalog, a fully integrated, metadata-rich experience that brings data discovery, governance, and observability into one unified platform.
No extra logins. No duct tape integrations. No more switching between five tools to understand where your data came from.
Just your data. Clear, connected, and certified.
The catalog, reimagined for modern data teams
Most data catalogs offer a fragmented view of your assets. You click around a lineage diagram, maybe find a stale column description, and then hop into another tool to dive deeper, fix your pipelines.
Not here.
Because the Data Catalog is built into the same unified data operations platform you use for ingestion, transformations with dbt, reverse ETL, and data observability, lineage is not just a picture. Dynamic lineage graphs are a source of truth. You can click into any asset in your pipeline and see:
Table- and column-level lineage
dbt models, sources, and tests
Snowflake and dbt tags, pulled in automatically
Operational metadata like run history, error logs, and freshness
Ownership and certification so you know who to ask and what to trust
With this launch, we’re introducing Matia Tags, a way to organize, filter, and group data assets that actually makes sense for your team. Tag by project, domain, owner, business unit, or anything else.
Tags, trust, and team visibility
With this launch, we’re introducing Matia Tags, a way to organize, filter, and group data assets that actually makes sense for your team. Tag by project, domain, owner, business unit, or anything else.
Looking for something in particular? Pairing tags with the revamped universal search allows you to parse and locate relevant assets faster
And when a dataset is ready for prime time? Certify it. Our new Data Certification feature helps your team know what is vetted and trustworthy. This reduces decision risk and increases stakeholder confidence.
Ramp’s data team is already seeing the difference.
“Most data catalog tools show you a diagram, but what we needed was context. What ran, what failed, what changed,. Matia is unified, so lineage is not just visual. It is actionable.”
- Akshay Ajbani, Senior Analytics Engineer, Ramp
Top Use Cases: More Than Just Metadata
We’re already seeing our customers and design partners leverage catalog for various use cases.
AI Enablement AI needs context. The Matia Catalog gives your models access to complete, trusted, and documented metadata across your stack. Whether you’re training LLMs, surfacing recommendations, or building AI-powered apps, the catalog provides the data clarity AI systems require. With operational lineage, freshness tracking, and ownership metadata all in one place, your AI tools can reason with confidence and stay grounded in reality.
Scalable Data Governance
Matia brings governance into the flow of work. Our users are setting ownership, tracking certifications, and applying Matia Tags across your entire data estate. Compliance teams get the audit trail they need. Analysts get clarity on what’s certified and who’s responsible. Business users can check data definitions. And best of all, it happens right in the platform, no separate tool (can you tell by now we really don’t like that?)... just practical control and accountability at scale.
Unlocking Productivity
With a unified catalog that connects ingestion, reverse ETL, and observability, your team no longer wastes time context-switching. Analysts can self-serve metadata, engineers can debug with full visibility, and data owners can assign and track responsibility, all from one place. The result: faster answers, fewer blockers, and a more productive data team.
Improving Data Quality
Matia's catalog doesn’t just show what data is where. Combined with the power of Matia Observability, it reveals how it’s behaving. Freshness indicators, error logs, and run history are all embedded into lineage views, making it easy to catch and fix quality issues before stakeholders notice. And because it’s tied to observability, you can continuously monitor and improve the reliability of every dataset.
A Major Milestone for Matia’s Unified DataOps Vision
Just seven months since launching, Matia has been named to the 2025 edition of the GigaOm Radar for Data Pipelines. GigaOm’s annual report is a trusted guide for technology leaders, offering an independent evaluation of top data pipeline platforms across technical and business criteria.
Matia’s inclusion signals strong early momentum. Our Unified DataOps Platform has quickly earned praise for addressing real-world challenges in data engineering by streamlinging ETL, reverse ETL, data observability, and data catalog in a single, cohesive platform.
What Sets Matia Apart
In this year’s report, Matia is positioned as a Challenger and Fast Mover in the Innovation/Platform Play quadrant. GigaOm called out several standout capabilities.
Unified Platform with Practical Benefits
Matia integrates core data functions into a shared infrastructure—eliminating the need for multiple point solutions and enabling seamless workflows with visibility at every stage.
Built-In Observability and Metadata Management
Our platform includes native support for data observability and quality monitoring, schema change alerts, and lineage tracking. These features are not bolted on; they’re part of the core platform experience.
Designed for Efficiency
Matia is a fully managed SaaS offering that minimizes operational overhead. GigaOm highlighted our usability as a key strength, giving data teams more time to focus on high-impact work. Matia ETL also offers parallel syncs, which increases replication speed and can decrease warehousing costs (a win-win for efficiency)
Why It Matters
Being included in GigaOm’s Radar report so early in our journey validates the problems we set out to solve: fragmented stacks, high maintenance overhead, and limited transparency across data workflows.
We built Matia to address these issues head-on, with a platform that prioritizes usability, observability, and speed. This recognition shows we’re on the right path.
Looking Ahead
To our customers and partners believers: thank you. Your feedback, support, and partnership have shaped the platform and fueled our progress. We’re just getting started.
The data leader's ramp-up guide (Part 1): your first 30 days
You just got hired as a data leader at a new company. Congrats.
Now the real fun begins. You’re charged with driving insights, unifying data architecture, influencing cross-functional strategy, and delivering measurable business value. Whether your title is Head of Data, Director of Analytics, VP of Data Science, Chief Data Officer, or something else, the early days set the tone. This post is Part 1 of a three-part guide to help you effectivelyonboard and transition into data leadership at your new organization in your first 90 days.
We’re starting with the first 30 days: focused on listening, learning, and building trust.
First 30 Days: Observe, Listen, Learn
Objectives & Key Driving Questions
What’s your organization's business model and what are the team dynamics? Understanding the business context and revenue drivers should be known before you start, but you will be able to dive in once you start
What’s in your current data stack, architecture, and what are your team’s pain points
How can you build trust quickly with your team and peers
Can you Identify early opportunities to add value without disrupting what's already working
Keep in mind how you tackle your first 30 days will depend a lot on what you inherit and how the team is setup. Was there an established data function before? Are you coming in to help level up and grow an existing team? Is this a new data organization? Were they reporting into Ops before or an office of CTO/Engineering? The transition plan for a mature data team will differ from building a data function from scratch.
Key actions for new data leaders
You're crawling now. The following are essential data leadership strategies to tackle in your first 30 days.
Learn the business
Your success as a data leader depends on your understanding of the business context. Spend time with stakeholders across functions:
Schedule 1:1s with product, marketing, sales, customer success, finance, engineering, and operations. Depending on the size of your business, target leaders in the department, and ask them for one to two other recommendations of who to speak with.
Ask insightful questions: What decisions are you trying to make today? What data sources and metrics do you trust or ignore? What reports do you rely on? How do you measure the success of your function?
Review existing company materials, investor decks, quarterly OKRs, customer personas, and user flows.
Map out the customer journey. Identify where data enables decision-making or blocks key moments.
Your goal is to become fluent in how the company makes money, what its strategic priorities are, and where it feels the most friction. Try to trace how data flows through the organization and where it breaks down, both technically and culturally.
Meet your team
Get to know your direct reports and their work, if applicable. Some things to potentially ask in your data team 1:1s:
What are you proud of?
What’s one thing you wish was different?
What tools or workflows feel painful?
If you were me and coming into this org, what would you focus on in the first 30 days?
What barriers prevent you from delivering your best work?
Shadow team members if you can. Sit in on stakeholder meetings. Review dashboards and pipelines with them. Seek to understand the why at first, instead of criticize unless they invite you in. Ask them to walk you through a recent request from intake to delivery, what worked and what didn’t?
Pay attention to morale and workload. Is the team burned out? Do they feel empowered to say no? Are they firefighting or focused on scalable systems? Remember that every direct report will be different, and management is about meeting people where they are.
If there are performance or morale issues, avoid making judgments too quickly. Focus on listening. People often respond well when they feel heard early.
Lastly, I would not make any org chart changes in the first 30 days, though it might be awkward. Learn what’s working and what’s not with the structure, and get feedback from all angles, but especially the most senior level people on the team. Effective data team management requires understanding before action.
Understand and map the stack
You need a clear picture of what you’re working with in your data infrastructure assessment.Start documenting:
Data sources and ingestion/ETL processes (batch vs streaming, tool ownership, observability)
Data warehouse architecture (schemas, usage patterns, permissions)
Transformation and modeling tools (dbt? custom SQL scripts? notebooks?)
AI usage and workflows (Custom LLMs, Iceberg, Enterprise AI tools)
BI and analytics tools (Looker, Mode, Tableau, Metabase, plus internal tools) - there probably are a lot of ad hoc BI processes that you’ll need to uncover.
Governance setup (who owns what, how clean is the data, how are metrics defined)
Also: what's missing? What’s too slow? Where does trust break down? Do not make any changes. I repeat, DO NOT MAKE ANY CHANGES. Just observe.
Make sure you walk through a few recent data and analytics tickets or data requests from start to finish, understand how long it takes, what breaks, and who gets frustrated, both on your team and from the broader business. Document your findings as part of your data leadership transition plan.
Build relationships
Early wins don’t just come from shipping data work. They come from building alignment. Make sure to:
Meet with your manager weekly or more, if possible; if you’re reporting to a CTO of a larger organization, this might be challenging. Learn how they work and respond and send async updates to get their feedback and thoughts
Ask how success will be measured for you and your data organization
Share your listening tour notes with stakeholders and ask for feedback. It shows you’re synthesizing.
Establish a working agreement with engineering and product counterparts
Invest time in your peer relationships. If you’re in product-led growth, sync with the growth team. If you’re in an enterprise-focused org, get to know your sales and customer success leaders. Learn what keeps them up at night. Understanding stakeholder pain points is crucial for data leadership success.
Look for low-effort, high-impact wins
You don’t need to boil the ocean, but it helps to deliver a small win early, especially if it saves someone time or fixes something annoying. Examples of quick data leadership wins:
Fixing a broken report used by a customer-facing team
Unblocking a data quality issue that’s been deprioritized for months
Automating a manual reporting task
Implementing simple data quality checks that prevent future incidents
Creating a clear documentation template for common analytics requests
Just make sure these wins don’t distract from your main job: understanding the system. Ask your team or stakeholders what’s been on the backburner for awhile that could be solved in a few hours. Focus on that.
One area I've always found as a quick win, especially with finance, is cloud cost optimization of data infrastructure. Usually there is an easy way to cut down Databricks or Snowflake spend by 10% using smarter queries and strategies. I usually keep this in my back pocket and will often make a change closer to the end of the 30 days if it’s a quick one.
Common pitfalls for new data leaders
Don’t jump into reorgs or big tech changes. You don’t know what you don’t know.
Don’t assume one team’s data challenges are everyone’s challenges
Don’t criticize what exists. Context matters. Ask why decisions were made before suggesting changes. Lift up the existing team and bring them into key decisions, especially if you’ve been hired over an existing leader. It will go a long way in developing a mutual relationship of trust
Don’t over-promise. Focus on listening and mapping before committing to delivery.
Don’t isolate yourself. You’re new: stay visible and vocal.
Don't immediately push for new tools or platforms without understanding current usage patterns
Don't neglect the human side of data leadership - building relationships is as important as technical excellence
Deliverables for your first month
By the end of your first month, you should be able to confidently present:
A 30-day readout to your manager and key stakeholders. Treat it almost like an internal QBR. Invite your #2 on the data team (this one can be controversial) and the heads of other departments. Keep it to 30 minutes and focus on what you want to accomplish and send a pre-read ahead of time.
A high-level data ecosystem map
Early themes and recurring pain points
A short list of potential quick wins
Hypotheses about where to focus next
This doesn’t need to be a slide deck (though it can be). A simple doc or Notion page is enough if it’s clear and shareable.
Consider including a few examples of impact areas:
Metric confusion in product analytics
Manual reporting taking up team bandwidth
Lack of trust in marketing attribution
Framing your learnings in terms of business problems earns credibility. Make sure to set your plan in the context of business plans and OKRs.
Final thoughts
Your first 30 days as a data leader at a new organization are all about curiosity, humility, and context. You’re laying the foundation for trust. Your team and your peers will be watching how you listen, what you value, and whether you understand the business. Successful data leadership transitionshappen when you prioritize learning before action.
Be visible, be helpful, and take great notes. That’s the best way to start strong.
One more tip: write a personal recap of your first 30 days for yourself. Capture what surprised you, what excited you, and what feels unclear. You’ll thank yourself later. Document your data leadership learnings to review as you prepare for your next phase.
Location: New York, New York Industry: Commercial Real Estate Tech Products: Matia ETL, Matia Reverse ETL, Matia Observability Use Cases: AI Pipelines, Data Ingestion/ETL, Data Activation
Lev is building the operating system for commercial real estate financing. The platform connects brokers, borrowers, and lenders in a centralized, intelligent environment that acts as a commercial real estate operation system. At the heart of this experience is real-time data powering AI-driven recommendations.
To make their AI models actionable, Lev needed a pipeline infrastructure that could move data from Databricks to operational systems with speed, precision and confidence.
Challenge
Lev's platform depends on accurate borrower and deal data flowing continuously into Databricks, where machine learning models rank the best-fit lenders for each commercial real estate deal. As the business scaled, their data infrastructure started to show strain.
Costs at their legacy ETL platform were unpredictable and growing exponentially
Syncs from Databricks to external tools were too slow to support AI-powered product delivery
Reverse ETL workflows were manually managed
Engineering time was tied up debugging pipelines instead of optimizing models
On top of that, Lev was leveraging Serverless Databricks as part of their architecture, which, while efficient for scaling compute, added complexity to managing reliable, always-on data pipelines.
“Matia didn’t just help us move data; it made our AI workflows operational. We can now get model outputs from Databricks into our platform fast enough to make a difference for our customers.” - Alberto Sheinfeld, CTO, Lev
Solution
Lev adopted Matia to build and orchestrate the AI pipelines that power their platform from ingestion to observability, activation. Matia introduced Lev to dbt to be able to expedite model deployment. Together with Databricks and dbt, the team now has a modern data stack designed for agility and scale.
With Matia, the team consolidated their fragmented pipeline infrastructure and made reverse ETL seamless. Insights from Databricks and dbt models could now be synced to customer-facing tools in near real time.
Sub 5-minute response times: Lev got white glove treatment from Matia. In the instances where there was development work needed or questions, the Matia team responded within 5 minutes and usually resolved any issues in less than 48 hours
Reverse ETL with reliability: Instead of maintaining scripts to push data into back to PostgreSQL, Matia’s platform automated it all
5x faster syncs: By optimizing how data moved from Databricks and through dbt, Lev ensured brokers could act on AI insights without lag, seeing a 80% decrease in sync times
5x faster syncs from Databricks to operational systems
Lower infrastructure costs on Databricks
AI predictions deployed in real time to customer workflows
Improved pipeline reliability across ingestion, transformation with dbt, and reverse ETL
“The support from Matia has been incredible. We give feedback and see changes almost immediately. It feels like we’re co-building with their team.” - Alberto Sheinfeld, CTO, Lev
Looking Ahead
As Lev grows its footprint across commercial real estate, the need for trustworthy, scalable AI pipelines only increases. With Databricks, dbt, and Matia, their team has the tools to move fast, reduce maintenance, and let data drive every financing conversation.
Time kills good products. Whether you’re building the next big SaaS platform or rethinking internal tools, momentum matters. The longer it takes to get your customer data flowing, the longer users wait, and the slower everyone moves.
Matia Embedded is here to change that.
Today, we're introducing a new integration layer within the Matia platform. Matia Embedded lets product managers & engineering teams embed self-service pipelines directly into their product or application. Your users don’t need to wait on custom ETL jobs or dashboards. They can connect, configure, and move their data where they need it, without leaving your app.
Initially, we had Matia Embedded on our roadmap for 2026, but after launching Matia in late October 2024, we started to see more and more customers come to us requesting embedded data pipeline capabilities, so we accelerated our efforts there.
Today, Matia embedded is being launched with support of over 30 connectors (including Shopify, Amazon Ads, Google Analytics, and Stripe), and will soon be available to all Matia connectors.
What Is Matia Embedded?
Matia Embedded is a way to productize your pipelines. With a few simple clicks, customers can connect their data sources with Matia, without leaving your product interface.
This isn’t just an API wrapper. It enables your customers to run production-grade data flows with a few guided steps, while you retain control over governance, limits, and integrations.
In the diagram below, a customer is using Matia embedded to power payments via stripe, and push the data back into Snowflake.
How embedded data pipelines work (at a glance)
Matia Embedded includes a set of APIs that integrate with any modern web app. You define the sources and destinations your users can connect to, then configure how embedded data pipelines behave.
A key component is our connector cards: visual, embeddable modules that guide users through authenticating and connecting any supported source system such as Salesforce, Postgres, or Slack. These cards offer a familiar, intuitive interface while preserving the full power of the pipeline underneath.
In order to generate the connector card, users can use the following API call:
This will create the connector card and authenticate the connection.
Under the hood, it leverages the same Matia engine used internally. You will still get the same observability capabilities and other platform features you come to expect from Matia.
Embedded data pipelines use cases & capabilities
From Data Engineers to Product Managers, Matia Embedded is designed to help teams move fast.
Accelerate product velocity Eliminate the “build vs. buy” debate. With Matia Embedded, you can empower your product team to launch data features in days. Want to bring payment data into your dogcare business dashboard? We can help with that
Maintain observability standards with control and visibility Embedded pipelines run on the same infrastructure as your internal stack. That means consistent logging, monitoring, alerting, and governance, without extra tooling or new surface area to manage.
Minimize one-off engineering work Put the power in customer’s hands to do the heavy lifting
We designed Matia Embedded for data teams who want to move fast and ship confidently. Capabilities are in line with what users have come to expect from Matia’s Platform:
A developer-friendly API to embed UI components quickly
Fully managed infrastructure with usage-based pricing
Real-time monitoring for early error detection
Enterprise-grade governance and access control
Robust security controls at every level
Ship faster with embedded data pipelines
You don’t need to wait on infrastructure to catch up with product ideas. Matia Embedded helps you deliver faster by putting data control directly in your users’ hands.
If you’re building a data-connected product and want to offer a seamless experience, we’d love to show you what’s possible.
April brought powerful new capabilities across the Matia platform,from tighter integration scheduling and bundles of new ETL & Reverse ETL sources and destinations. Here's a breakdown of everything new and improved last month.
Integrations just got more predictable
Trigger integrations with cron expressions
You can now schedule any integration to run on a custom cadence using cron expressions. Whether you need updates every 15 minutes or weekly, Matia gives you full control over your sync schedule for more predictable and efficient operations.
Export and automate schema management
Need to document or automate your integration setup? You can now export source schemas to CSV with one click. We’ve also added enhanced API support so you can programmatically fetch and update source schemas, ideal for teams scaling automation across workflows.
New ETL source integrations
Driven by customer requests, Matia added a handful of new and expanded ETL integrations in April help power ingestion capabilities.
Outreach
Keep your revenue teams aligned with always-fresh prospecting and engagement data from Outreach. Matia ensures every sales touchpoint is captured and modeled, so your go-to-market motion stays informed and data-driven.
Recharge
Sync real-time subscription and billing data from Recharge into your warehouse. With Matia, finance, product, and support teams get a unified view of customer health—without waiting on batch exports.
Algolia
Bring search behavior and performance data into your analytics stack to better understand how users navigate and convert. Matia makes it easy to connect Algolia to the rest of your data for smarter UX decisions and potential building of AI models based on your user search data.
Google Analytics 4 Export
Capture granular, event-level web and app data from GA4 directly into your warehouse. Matia helps you go beyond dashboards, powering custom attribution models and cross-channel customer insights.
Elastic
Unlock the full value of your logs and search analytics by ingesting data from Elastic into your warehouse. Whether it’s performance monitoring or user behavior analysis, Matia makes observability data accessible and actionable across teams.
These new sources expand the scope of data you can bring into Matia and push to your data lake or data warehouse. Check out the full list of connectors here.
New Reverse ETL destinations and updates
We’ve added support for more Reverse ETL destinations, so your modeled data can power even more of your operational tools. New destinations include:
Google Ads
Fuel high-performing campaigns with real-time, warehouse-modeled audiences. Matia keeps your ad platforms synced with the latest customer segments to drive smarter targeting and higher ROI, without manual uploads.
Improved Amplitude Destination
In February, we added Amplitude as a Reverse ETL definition. Last month, we expanded functionality to include the Cohorts Object. Enrich Amplitude with fresh, warehouse-modeled attributes to unlock deeper product insights and experimentation. Matia ensures your product analytics are always up-to-date and reflective of the full customer journey.
PostgreSQL
Keep your operational and engineering systems in sync by pushing modeled data back into Postgres. Whether powering internal tools or triggering downstream workflows, Matia makes it seamless to close the loop from analysis to action. Due to the parallel syncs, Matia customers have seen up to 9x increase in sync speed with PostgreSQL.
HTTP Request
Unlock any connector (almost). Trigger external workflows in real time with Matia’s flexible HTTP Request destination. Now, you can send data directly to any system that accepts API calls, including CRMs, ticketing systems, internal tools, and no-code platforms.
Whether you’re activating data in marketing platforms or triggering events in real time, Matia makes operationalizing your warehouse faster and more flexible.
Reverse ETL (Extract, Load, and Transform) is the process of syncing cleaned, enriched, analytics-ready data from data warehouses back to operational systems such as CRMs, marketing platforms, and other business applications or databases.
Its emergence has enabled organizations to unlock the value of centralized data by delivering actionable insights directly into the tools used by business teams. By bridging the gap between analytical and operational systems, Reverse ETL supports many use cases including real-time decision-making, workflow automation, and improved customer engagement.
With enriched data accessible in everyday tools, teams can launch personalized marketing campaigns, improve sales efficiency, and create more complete customer profiles.
Use cases of reverse ETL
Reverse ETL pipelines, while structurally similar to traditional ETL/ELT processes, are distinct in that they reverse the flow of data, pushing it from a data warehouse or lake into operational systems like CRMs. This process requires close alignment with business teams, such as marketing, sales, and customer support, because the target systems—like CRMs—have more complex, sensitive schematic rules compared to data lakes, which typically store raw data. Unlike in a data lake, where data is relatively unstructured and serves primarily for analysis, CRMs are live systems with direct implications on day-to-day business operations. As a result, Reverse ETL demands caution, as errors in the data pushed to CRMs can impact sales workflows, customer communications, and other critical operations. This makes Reverse ETL not just a technical challenge, but one that requires deep collaboration with business teams to ensure data integrity and alignment with strategic objectives.
Here’s how various teams leverage and benefit from Reverse ETL across businesses.
Sales: Reverse ETL enables sales teams to work smarter by syncing AI/ML-driven lead scores and enriched firmographic data (e.g., company size, industry, revenue) directly into Salesforce and other CRMs. Additionally, product usage data, web activity, email engagement, and customer profiles can be combined to provide a 360-degree view of each lead’s journey—from initial interest to purchase. This helps sales reps prioritize high-potential accounts, track behavior across the funnel, calculate conversion rates, and identify drop-off points—all from within their CRM.
Marketing: Marketing teams can push behavior-based segments—such as high-intent, dormant, or recently active users—from Snowflake into platforms like HubSpot, Marketo, or Mailchimp for personalized outreach. Reverse ETL also enables the creation of lookalike audiences by syncing high-LTV customer traits to advertising platforms like Facebook and Google Ads.
Customer Success: Customer success teams can use Reverse ETL to sync customer health scores, product usage patterns, and engagement signals into tools like Salesforce or Zendesk. This allows them to proactively identify churn risks, monitor onboarding progress, and tailor support strategies based on real-time user behavior. With enriched customer data available at their fingertips, CS teams can offer more timely, personalized, and effective support experiences.
Method 1: Building your own manual reverse ETL process
In this blog, we’ll walk through building a Reverse ETL pipeline that syncs enriched lead data from Snowflake into Salesforce.
The goal is to equip go-to-market teams (Sales, Marketing and Customer Success stakeholders) with actionable insights that help them prioritize high-value prospects and proactively engage leads throughout the funnel.
For each lead, we’ll push enriched fields such as:
Lead Score
Web Activity Score
Email Engagement Score
Conversion Rate
By delivering this data directly into Salesforce, account managers gain a complete view of user behavior—from website activity to email engagement to product usage. This empowers them to focus on qualified opportunities, drive upsell and renewal efforts, and proactively reach out to at-risk prospects—all from within the tools they already use.
Prerequisites:
To build this Reverse ETL pipeline, you’ll need the following:
Snowflake as the source data warehouse containing enriched lead data
A Salesforce Developer Account to access and test the CRM environment
Salesforce REST API access:
Salesforce provides multiple APIs (REST, Bulk, SOAP, Streaming); for this guide, we’ll use the REST API for simplicity and flexibility
Python and SQL scripts to build the custom integration
Python will handle the API communication with Salesforce
SQL will be used to query and prepare the enriched data in Snowflake for syncing
Step 1: Define the target schema
Create Snowflake Table that follows the schema of Salesforce LEAD Object’s Base Fields
In this example, we also need to generate mock Salesforce lead data using Faker Library.
Now we can insert the leads data by using the snowflake connection we created in step 2, by using the INSERT INTO command in the python script itself.
Go back to your snowflake account, and you will see that the email_engagement_data and web_activity_data table is now populated.
Step 4. Enrich the leads data with engagement metrics
Before we can load this data into Salesforce using its REST API, we need to enrich the leads data by merging with the Web and Email Activity Table to create metrics.
Create Supporting Tables in Snowflake - Web Activity Data and Email Activity Table - create mock data for this and insert it to snowflake.
Enrich the data to calculate lead score table by calculating the following metrics:
Web Activity Score - Shows interest in your product on your website based on clickstream rate and demo requests
Email Engagement Score - Indicates how engaged a lead is your email programs,based on open & click ratesLead Score - Helps GTM teams prioritize their outreach, based on leads most likely to convert
Conversion Rate - Tells you which lead is likely to sign up for a service or make a purchase, and ultimately become customer.
Here's what the code will look like.
CREATE OR REPLACE TABLE DEMO.MATIA.ENRICHED_LEADS AS
SELECT
    l.lead_id,
    l.first_name,
    l.last_name,
    l.email,
    l.company,
    l.industry,
    l.source,
    l.annual_revenue,
    l.lead_status,
    l.is_converted,
    l.created_at,

    -- Web activity metrics
    w.website_visits,
    w.demo_requests,

    -- Email engagement metrics
    e.email_opens,
    e.email_clicks,

--Web Activity Score: visits * 5 + demos * 20 (capped at 100)
    LEAST(
        COALESCE(w.website_visits, 0) * 5 + COALESCE(w.demo_requests, 0) * 20,
        100
    ) AS web_activity_score,

    -- Email Engagement Score: opens * 3 + clicks * 10 (capped at 100)
    LEAST(
        COALESCE(e.email_opens, 0) * 3 + COALESCE(e.email_clicks, 0) * 10,
        100
    ) AS email_engagement_score,

    -- Composite Lead Score (weighted avg)
    ROUND(
        0.5 * LEAST(COALESCE(w.website_visits, 0) * 5 + COALESCE(w.demo_requests, 0) * 20, 100) +
        0.5 * LEAST(COALESCE(e.email_opens, 0) * 3 + COALESCE(e.email_clicks, 0) * 10, 100),
        2
    ) AS lead_score,

    -- Conversion Rate by Industry
    ROUND(AVG(CASE WHEN l.is_converted = 'Converted' THEN 1 ELSE 0 END) OVER (PARTITION BY l.industry),2) AS conversion_rate

FROM DEMO.MATIA.LEADS l
LEFT JOIN DEMO.MATIA.WEB_ACTIVITY_DATA w ON l.lead_id = w.lead_id
LEFT JOIN DEMO.MATIA.EMAIL_ENGAGEMENT_DATA e ON l.lead_id = e.lead_id;

select * from enriched_leads;
Step 5: Set up Salesforce API access
If you have a Salesforce Developer Account and generated an Access Token from the Salesforce’s REST API, you can use a Python Script - using Simple Salesforce and requests library to push the leads table back to Salesforce as an enriched data in the Leads object.
If not, download Salesforce’s REST API CLI - and run the following command:
sf org display --target-org <your_username>6@agentforce.com
This displays your ACCESS_TOKEN and you can save it.
Step 6: Add custom fields in Salesforce
To update the Leads Table with updated columns, you need to create a new custom fields in Salesforce before pushing the Snowflake’s enriched leads table to Salesforce.
“WebsiteVisit” is a new metric added to the Leads Table in Snowflake, so we need to introduce this custom field to Leads Object in Salesforce, and do it for all the metrics introduced to enrich the leads data.
Step 7: Query the enriched leads from snowflake
Next, we can write a python script to read from the Snowflake table.
import pandas as pd
extract = "SELECT * FROM ENRICHED_LEADS"enriched_leads_df = pd.read_sql(extract, conn)
Step 8: Upsert enriched leads table back into Salesforce
The following script will push back the Leads enriched data with metrics we created in step 2.
# Example: mock_leads_df from earlier or from your leads data# Let's loop through it and upsert into Salesforceheaders = {
"Authorization": f"Bearer {ACCESS_TOKEN}",
"Content-Type": "application/json"}
defupsert_lead_record(row): external_id = row["LEAD_ID"]
url = f"{INSTANCE_URL}/services/data/v63.0/sobjects/{OBJECT_API_NAME}/{EXTERNAL_ID_FIELD}/{external_id}"# Prepare the payload for Lead object upsert payload = {
"FirstName": row["FIRST_NAME"],
"LastName": row["LAST_NAME"],
"Email": row["EMAIL"],
"Company": row["COMPANY"],
"Industry": row["INDUSTRY"],
"LeadSource": row["SOURCE"],
"AnnualRevenue": float(row["ANNUAL_REVENUE"] or0),
"LeadStatus__c": row["LEAD_STATUS"],
"CreatedAt__c": pd.to_datetime(row["CREATED_AT"]).strftime("%Y-%m-%dT%H:%M:%SZ"), #Custom field"WebsiteVisit__c": row["WEBSITE_VISITS"], #Custom Field"DemoRequests__c": row["DEMO_REQUESTS"], #Custom Field"EmailOpened__c": row["EMAIL_CLICKS"], #Custom Field "WebActivityScore__c": row["WEB_ACTIVITY_SCORE"], #Custom Field"EmailEngagementScore__c": row["EMAIL_ENGAGEMENT_SCORE"], #Custom Field"LeadScore__c": row["LEAD_SCORE"], #Custom Field"ConversionRate__c": row["CONVERSION_RATE"] #Custom Field }
response = requests.patch(url, headers=headers, json=payload)
if response.status_code in [200, 201, 204]:
print(f"Synced: {row['FIRST_NAME']}{row['LAST_NAME']} ({external_id})")
else:
print(f"Failed for {external_id} -- {response.status_code}: {response.text}")
# Run the upsert for each lead in the mock leads DataFramefor _, row in enriched_leads_df.iterrows():
upsert_lead_record(row)
Here is the output on Salesforce that includes metrics such as Email Engagement Score, Web Activity Score, Lead Score, and Conversion Rate.
This Reverse ETL process activates data stored in Snowflake so GTM teams can leverage it. Sales reps can prioritize their outreach based on the “Lead Score”, and the conversion rate can be beneficial in determining which leads convert best, and the Marketing Team can shape the marketing campaigns for the Leads based on web and email engagement scores.
Automation using Airflow (Optional)
Orchestration tools like Apache Airflow are essential for automating and scheduling reverse ETL pipelines from Snowflake to Salesforce. Using PythonOperators, Airflow executes custom scripts to extract, transform, and push enriched data to Salesforce, with task sequencing, retries, and monitoring built in. Challenges arise when the Snowflake schema changes—for example, with added or removed columns—which can cause DAG failures. To handle this, a cleanup task can be added to delete or truncate existing Salesforce data before replication, ensuring safe reprocessing. As pipelines shift to incremental loads, complexity increases, Airflow’s flexibility allows for robust, scalable workflows that adapt to evolving data needs.
Potential challenges and complexities with manual reverse ETL pipelines
Setting up a manual Reverse ETL process (Extract, Transform, Load) using the REST API and a Python script seems relatively simple, but there are several technical issues that may arise that are worth pointing out.
Managing API Permissions and Access Control When working with the Salesforce API, you must ensure ] the data conforms to the API specification, manage the permissions that may involve complex role based access controls (RBAC), and implement secure authentication and authorization mechanisms. This includes handling access tokens, which must be periodically to maintain systems connectivity.
API Rate Limits Salesforce imposes strict API rate limits (e.g., 15,000/day per org or 1,000/day per user), which makes syncing data updates from Snowflake to Salesforce in real time challenging. If you trigger an API call for every minor update (like a lead status change), you'll quickly hit these limits—especially if you're syncing records one at a time via the REST API. Bulk API has higher daily limits, and could be used for periodic syncs for high volume data operations.
Logging, Monitoring & Incremental Syncing Tracking successful and failed syncs from Snowflake to Salesforce is critical but can become inefficient at scale. A structured logging system—such as a Snowflake table or dashboard—helps monitor sync status, record counts, and timestamps. While Snowflake and Salesforce offer basic logging, tools like Matia provide built-in monitoring.
To improve efficiency, use incremental syncing instead of full reloads. Implement a last_synced_at field or delta logic to sync only new or updated records, reducing API calls and simplifying monitoring.
Schema Drift Schema drift occurs when the structure of source data changes, causing potential sync failures if not addressed. As we saw on the earlier example, when syncing to Salesforce, custom fields must be created to match your data model. If field types don't match, Salesforce’s API will reject the request.
To manage this, monitor schema changes and maintain a metadata store for both systems. Since Salesforce APIs don’t support true upserts, you must track whether records should be created or updated—adding complexity to the pipeline. Validating data types between systems is essential, but without automation, it can be time-consuming and error-prone.
Automation with Orchestration Tools Automating a manual Reverse ETL process can be significantly improved by using orchestration tools like Apache Airflow or Prefect. These tools automate scheduling, monitoring, and execution of Python scripts, reducing manual intervention and enhancing pipeline efficiency. Automation allows for incremental data syncing by tracking last_synced_at fields, ensuring only updated records are sent to Salesforce and minimizing unnecessary API calls. Airflow also supports data validation tasks to maintain consistency and prevent schema drift errors. However, setting up Airflow, defining tasks, and managing dependencies can be time-consuming and would require the engineering team to manage as well.
Method #2: Reverse ETL as a managed solution with Matia
Managed solutions offer a more seamless and scalable way to activate your data. Once you’ve created your first pipeline, each additional one is increasingly easier and faster to set up.
We’ll walk you through how streamlined this process is on Matia.
Step 1: Navigate to the Integrations page and click Add Integration
Step 2: Select your data warehouse provider and connect it to Matia
Matia includes detailed documentation embedded within the product .
In this case, we’ll be using Snowflake to mirror the example above.
Step 3: Select your chosen destination and grant Matia permissions
Grant Matia Write permissions. Most destinations support OAuth authentication, reducing the connection process to a single click.
Step 4: Configure the Integration
To configure the integration, follow the following steps:
Select the trigger type. In this case, we're going to use dbt Cloud as a trigger and we'll select the specific dbt Job we want to use as a trigger.
Configure the source model. We’ll paste a prepared SQL model which would serve as a source for the data we’re looking to push into Salesforce.
Select the destination object. Find the specific object in Salesforce you'd like to push data into.
Select a sync mode. Matia supports various sync modes, allowing you to customize the way you want to push data into your destination. In this case, we’ll go with Mirror mode which syncs inserts, updates, and deletions.
Configure the mapping. We’re going to select the source primary key and any additional field mapping we’d like to use to customize the destination object.
Step 5: Validate your setup
Select ‘Run Test’ and Matia will select 1 random row from your model and push it into your destination.
And you're done. Watch your data flow into Salesforce.
Building a manual vs managed reverse ETL pipeline
Implementing Reverse ETL requires making a key decision: should you build and maintain a pipeline in-house or use a managed solution? This choice impacts everything from development time and engineering resources to scalability and reliability. While a manual approach may seem like a simple choice, it also comes with significant maintenance and operatiional overhead. On the other hand, a managed solution abstracts away complexity, enabling teams to focus on leveraging data rather than moving it.
Let’s break down the trade-offs between these two approaches.
Feature
Manual Reverse ETL
Managed Reverse ETL (e.g. Matia)
Setup Time
Longer – requires custom scripting and API integration
Fast – drag-and-drop UI, prebuilt connectors
Engineering Effort
High – engineers must have technical expertise in SQL and storage systems
Must be manually implemented (e.g., updated_at, hash)
Built-in incremental sync logic
Error Handling & Logging
Manual logging required (e.g., store sync errors in Snowflake)
Automatic logging, monitoring, and alerting
API Rate Limit
Limited Time Access Tokens, timeout limit is 10 minutes for REST/SOAP APIs in Salesforce
Built-in batching, throttling, and retry mechanisms
Maintenance Overhead
High – requires constant updates as schema changes
Low – auto-adapts to schema drift and tool upgrades
Cost
Lower (infra only), but higher in dev time
Upfront investment, but faster time to value and more scalability
Trigger on dbt success/run
Possible with multiple manual queries
Automated and easily configurable, for both dbt core & dbt cloud
Automation
Requires leveraging Airflow and other orchestration tools to run scripts / mimic automations
Built-in functionality to run and scale
Building a manual Reverse ETL pipeline gives you control over how your data flows from your warehouse to operational tools like Salesforce. While this approach can move your data from A to B, or in our case, warehouse to end tool, it also comes with challenges around API management, schema drift, error handling, and maintenance overhead.
For organizations looking to move fast, reduce engineering burden,and ensure reliability at scale, managed Reverse ETL platforms like Matia offer a more streamlined and scalable alternative. You can get started with a free trial of Matia here to test it out for yourself.
Whether you build or buy, the end goal remains the same: to activate your data and make it actionable where your teams work.
Snowflake’s driver plays a crucial role in optimizing query performance, particularly when dealing with complex joins. Many users experience slow query execution times without realizing that proper constraint definitions can significantly improve performance. When dealing with customers trying to get data to Snowflake, this increased execution time leads to increased costs in Snowflake, which can artificially balloon warehouse costs.
This article explores how the Snowflake driver operates and provides practical techniques for optimizing joins using constraints.
How the Snowflake driver operates
The Snowflake driver is responsible for executing SQL queries efficiently by leveraging Snowflake’s cloud-native architecture. It optimizes query execution through several mechanisms:
Query Compilation – The driver translates SQL statements into an execution plan
Pruning and Micro-Partitioning – It minimizes the data scanned by leveraging metadata
Query Caching – Frequently executed queries benefit from result set caching
Join Optimization – The optimizer determines the best strategy based on available constraints and statistics.
Among these mechanisms, join optimization is critical, particularly when working with large datasets.
Join optimization techniques
Join operations can become performance Obottlenecks if not handled correctly. Snowflake uses various join algorithms:
Broadcast joins – When one table is small, it is broadcast to all nodes processing the query.
Merge joins – Used when both tables are sorted on the join keys.
Hash joins – Suitable when the tables are large and not sorted.
Nested loop joins – Applied when no indexes or optimizations are available.
The optimizer automatically selects the best join type, but users can provide hints or structure data appropriately to improve performance.
Using constraints for optimization
One of the most effective ways to improve join performance is by enforcing constraints on tables. Snowflake does not enforce constraints like traditional relational databases, but defining them helps the optimizer make better decisions.
Primary and Foreign Key Constraints
Even though Snowflake does not enforce foreign keys, defining them provides optimization hints. To demonstrate their impact, let’s consider a large-scale scenario with an orders table and a customers table containing millions of records.
Step 1: Creating Large-Scale Tables Without Constraints
SELECT o.order_id, o.order_total, c.customer_name
FROM orders o
JOIN customers c ON o.customer_id = c.customer_id;
Since no constraints are specified, the optimizer does not assume referential integrity and may perform unnecessary checks, leading to slower query execution.
Step 4: Adding Primary and Foreign Key Constraints
SELECT o.order_id, o.order_total, c.customer_name
FROM orders o
JOIN customers c ON o.customer_id = c.customer_id;
By adding these constraints, the optimizer can safely assume referential integrity, potentially reducing join processing time.
Step 6: Measuring Performance Impact on Large Data
To compare query execution times, use Snowflake’s QUERY_HISTORY view:
SELECT query_id, total_elapsed_time
FROMTABLE(INFORMATION_SCHEMA.QUERY_HISTORY())
WHERE query_text LIKE'%JOIN customers c ON o.customer_id = c.customer_id%'ORDERBY start_time DESC;
Running this before and after adding constraints provides insight into the performance improvement. Typically, queries leveraging constraints execute significantly faster at scale, particularly when tables contain millions of records.
Unique Constraints and Performance Impact
Defining uniqueness constraints helps Snowflake optimize certain operations, particularly lookups and join optimizations.
Step 1: Running a Query Without Unique Constraints
SELECTDISTINCT customer_id
FROM orders;
Since Snowflake does not assume customer_id is unique, it scans all rows to find distinct values, which can be slow on large datasets.
With the unique constraint in place, Snowflake optimizes the query execution by leveraging metadata, reducing the need for full scans.
Step 4: Measuring Speed Improvement
SELECT query_id, total_elapsed_time
FROMTABLE(INFORMATION_SCHEMA.QUERY_HISTORY())
WHERE query_text LIKE'%SELECT DISTINCT customer_id FROM orders%'ORDERBY start_time DESC;
This allows users to compare execution times before and after enforcing the unique constraint. Typically, queries leveraging uniqueness constraints execute faster due to improved indexing and reduced redundant scans.
Clustering Keys
Clustering keys improve data locality and optimize join operations.
ALTERTABLE orders CLUSTER BY (customer_id);
By clustering on the join key, related data is stored together, reducing the need for expensive scans.
Optimizing Specific Join Scenarios
Joining Large Fact Tables with Dimension Tables
When joining large fact tables with smaller dimension tables, using a broadcast join can be beneficial.
SELECT f.order_id, d.customer_name
FROM fact_orders f
JOIN DIM_customers d
ON f.customer_id = d.customer_id
USING BROADCAST;
The optimizer can take advantage of the smaller dimension table and distribute it across all compute nodes.
Using Materialized Views for Join Performance
Materialized views can precompute joins and store results for faster retrieval.
CREATE MATERIALIZED VIEW mv_customer_orders ASSELECT f.order_id, d.customer_name
FROM fact_orders f
JOIN DIM_customers d
ON f.customer_id = d.customer_id;
Subsequent queries against this view avoid expensive recomputation.
Leveraging Result Set Caching
If joins involve frequently accessed data, Snowflake’s result caching can significantly boost performance. Ensure the same queries are reused to benefit from caching.
SELECT*FROM mv_customer_orders;
Since Snowflake caches query results for 24 hours, repeated executions are near-instantaneous.
Driving Optimization in Snowflake
Understanding how the Snowflake driver operates and applying optimization techniques can significantly improve query performance. By leveraging constraints, clustering, and optimized join strategies, users can minimize query execution times and improve overall efficiency. With these techniques, Snowflake users can ensure they are getting the most out of their cloud data platform.
When evaluating total cost of your data movement platform, it’s important to take into consideration Snowflake costs and how you can optimize it to lessen total cost of ownership of their data stack. But optimizing queries is just one part of the bigger pictures. Matia can help data teams works smarter by ensuring data consistency, reducing operational friction, and providing better visibility into how data is used.
Subscribe to Sync or Swim
By clicking Subscribe you’re confirming that you agree with our Terms and Conditions.


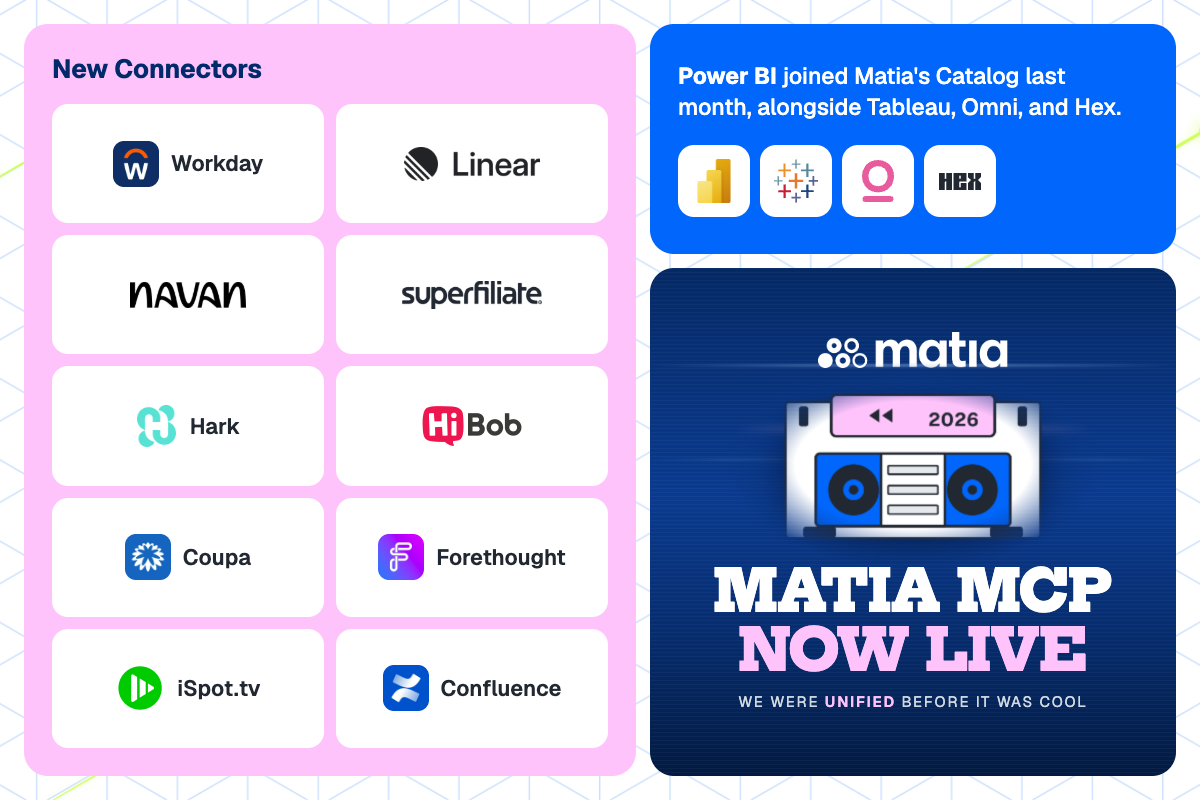
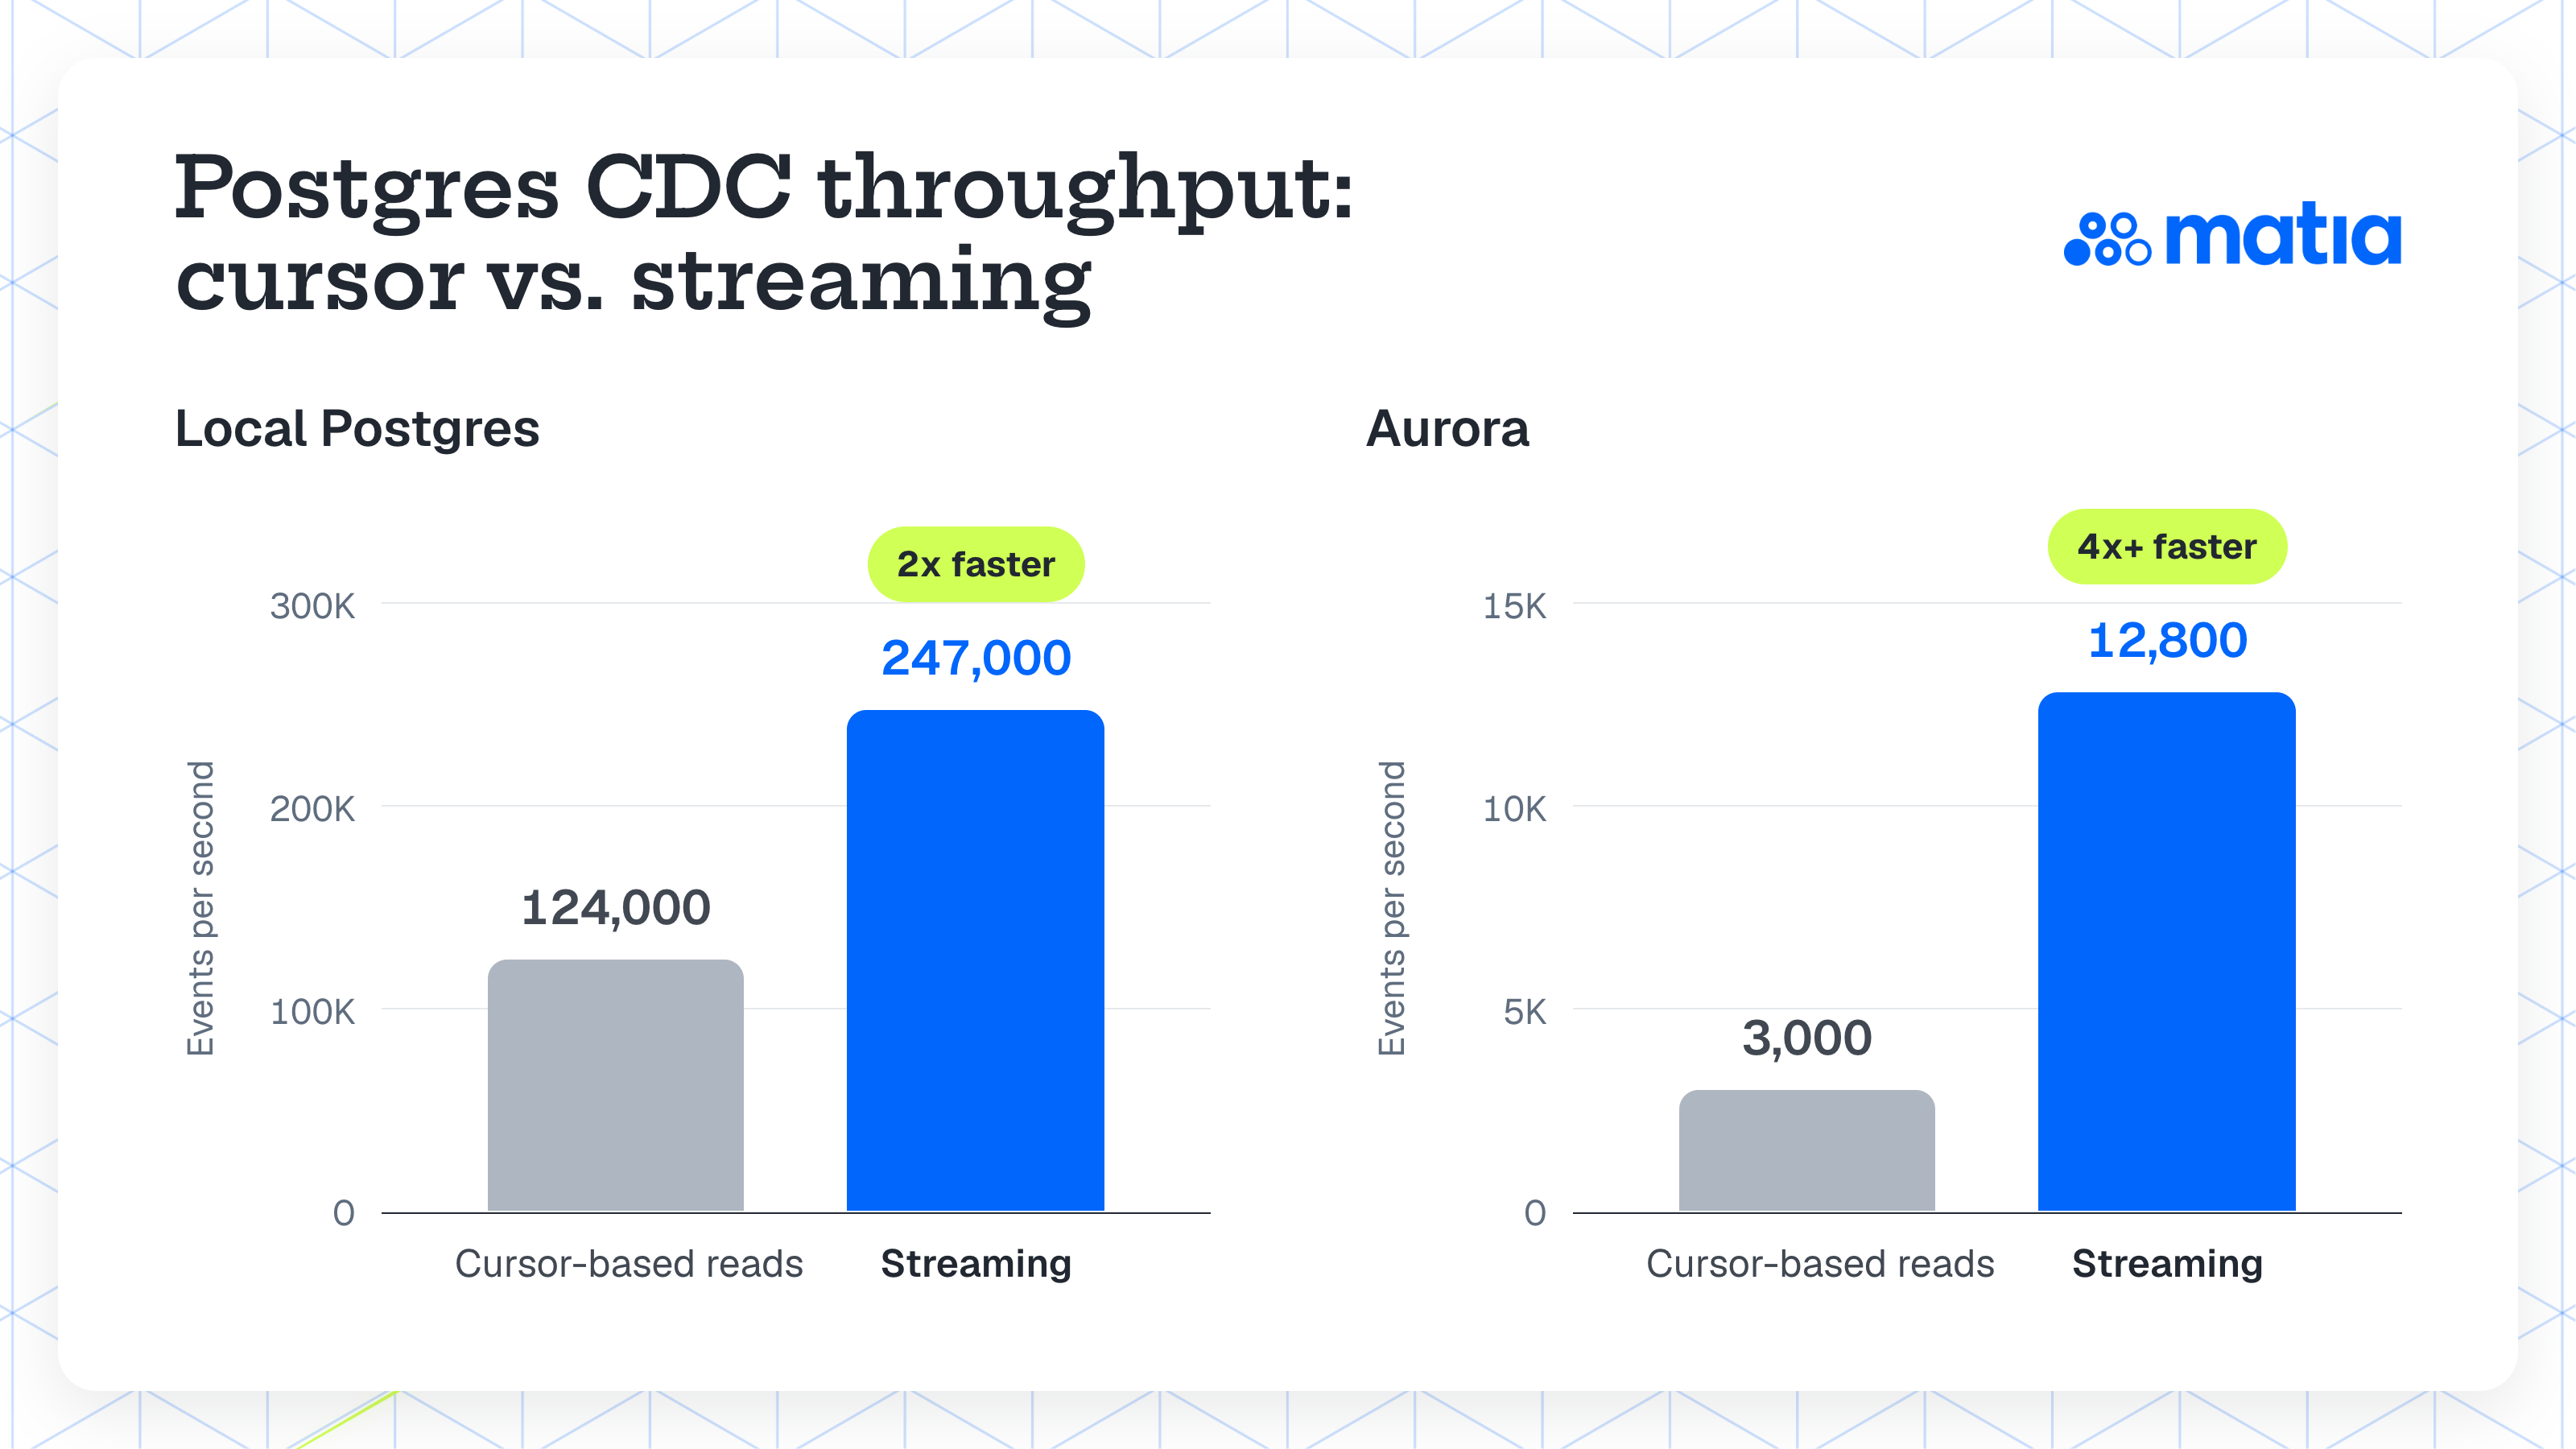
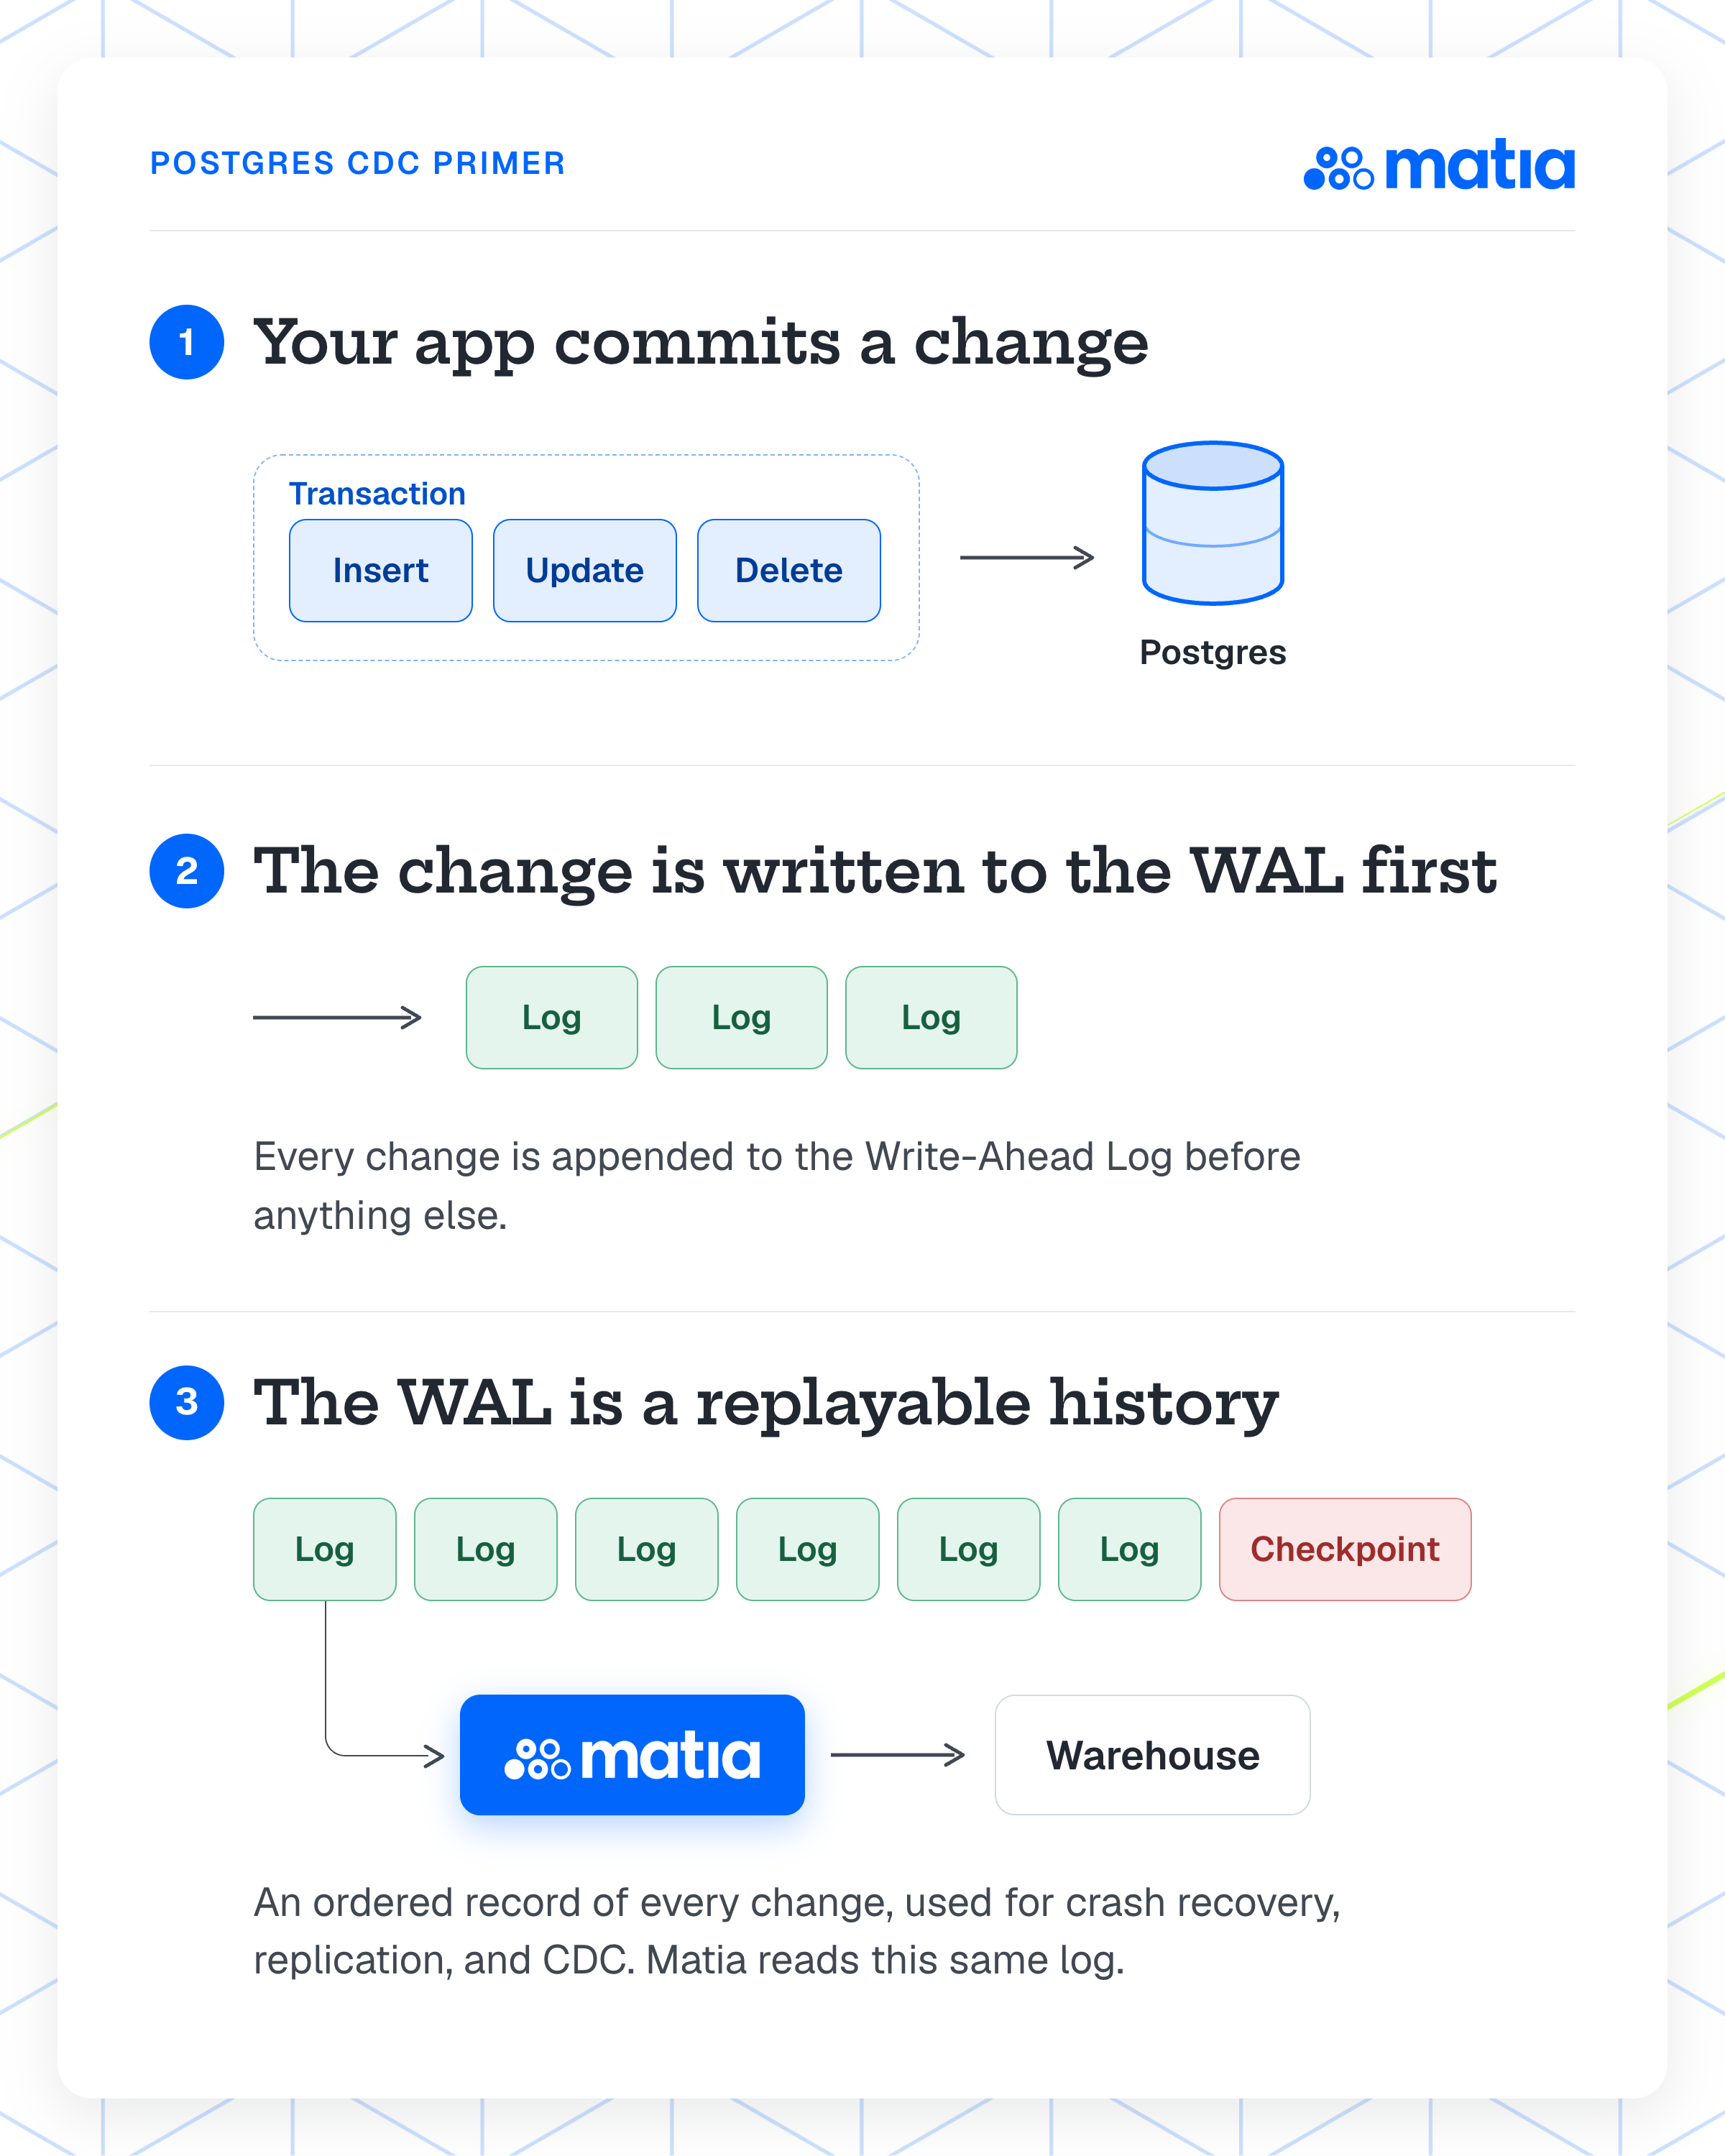
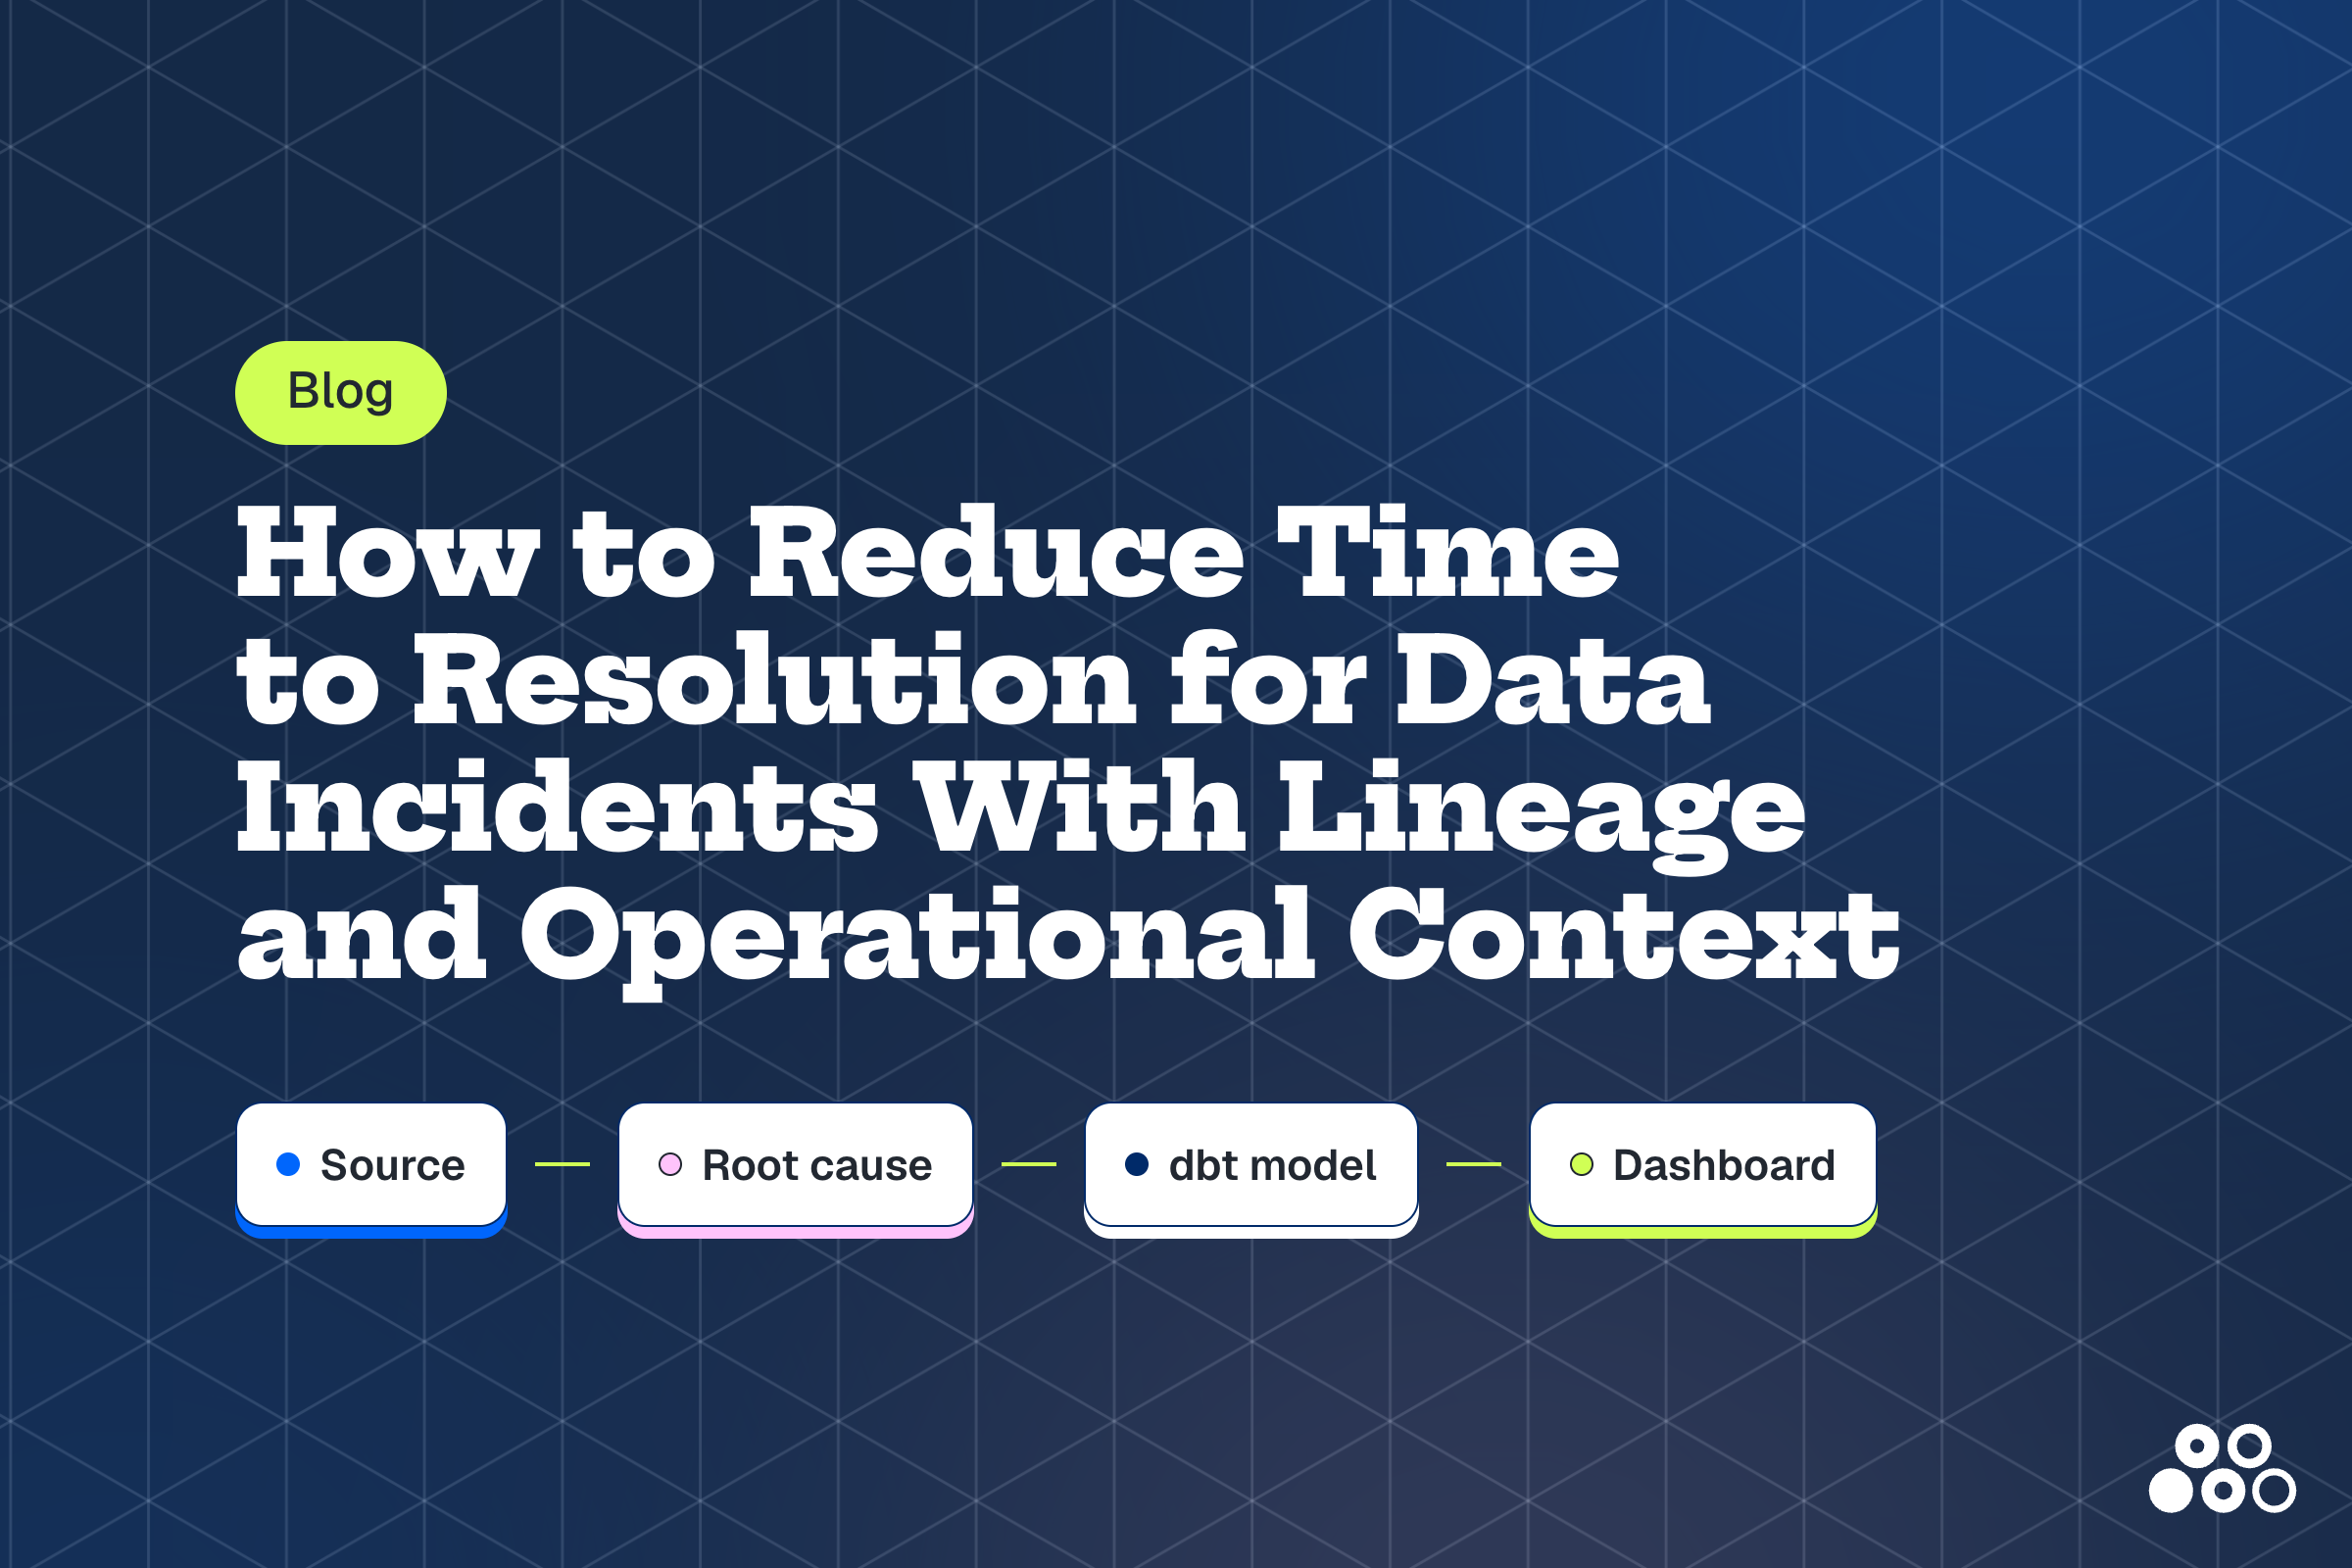
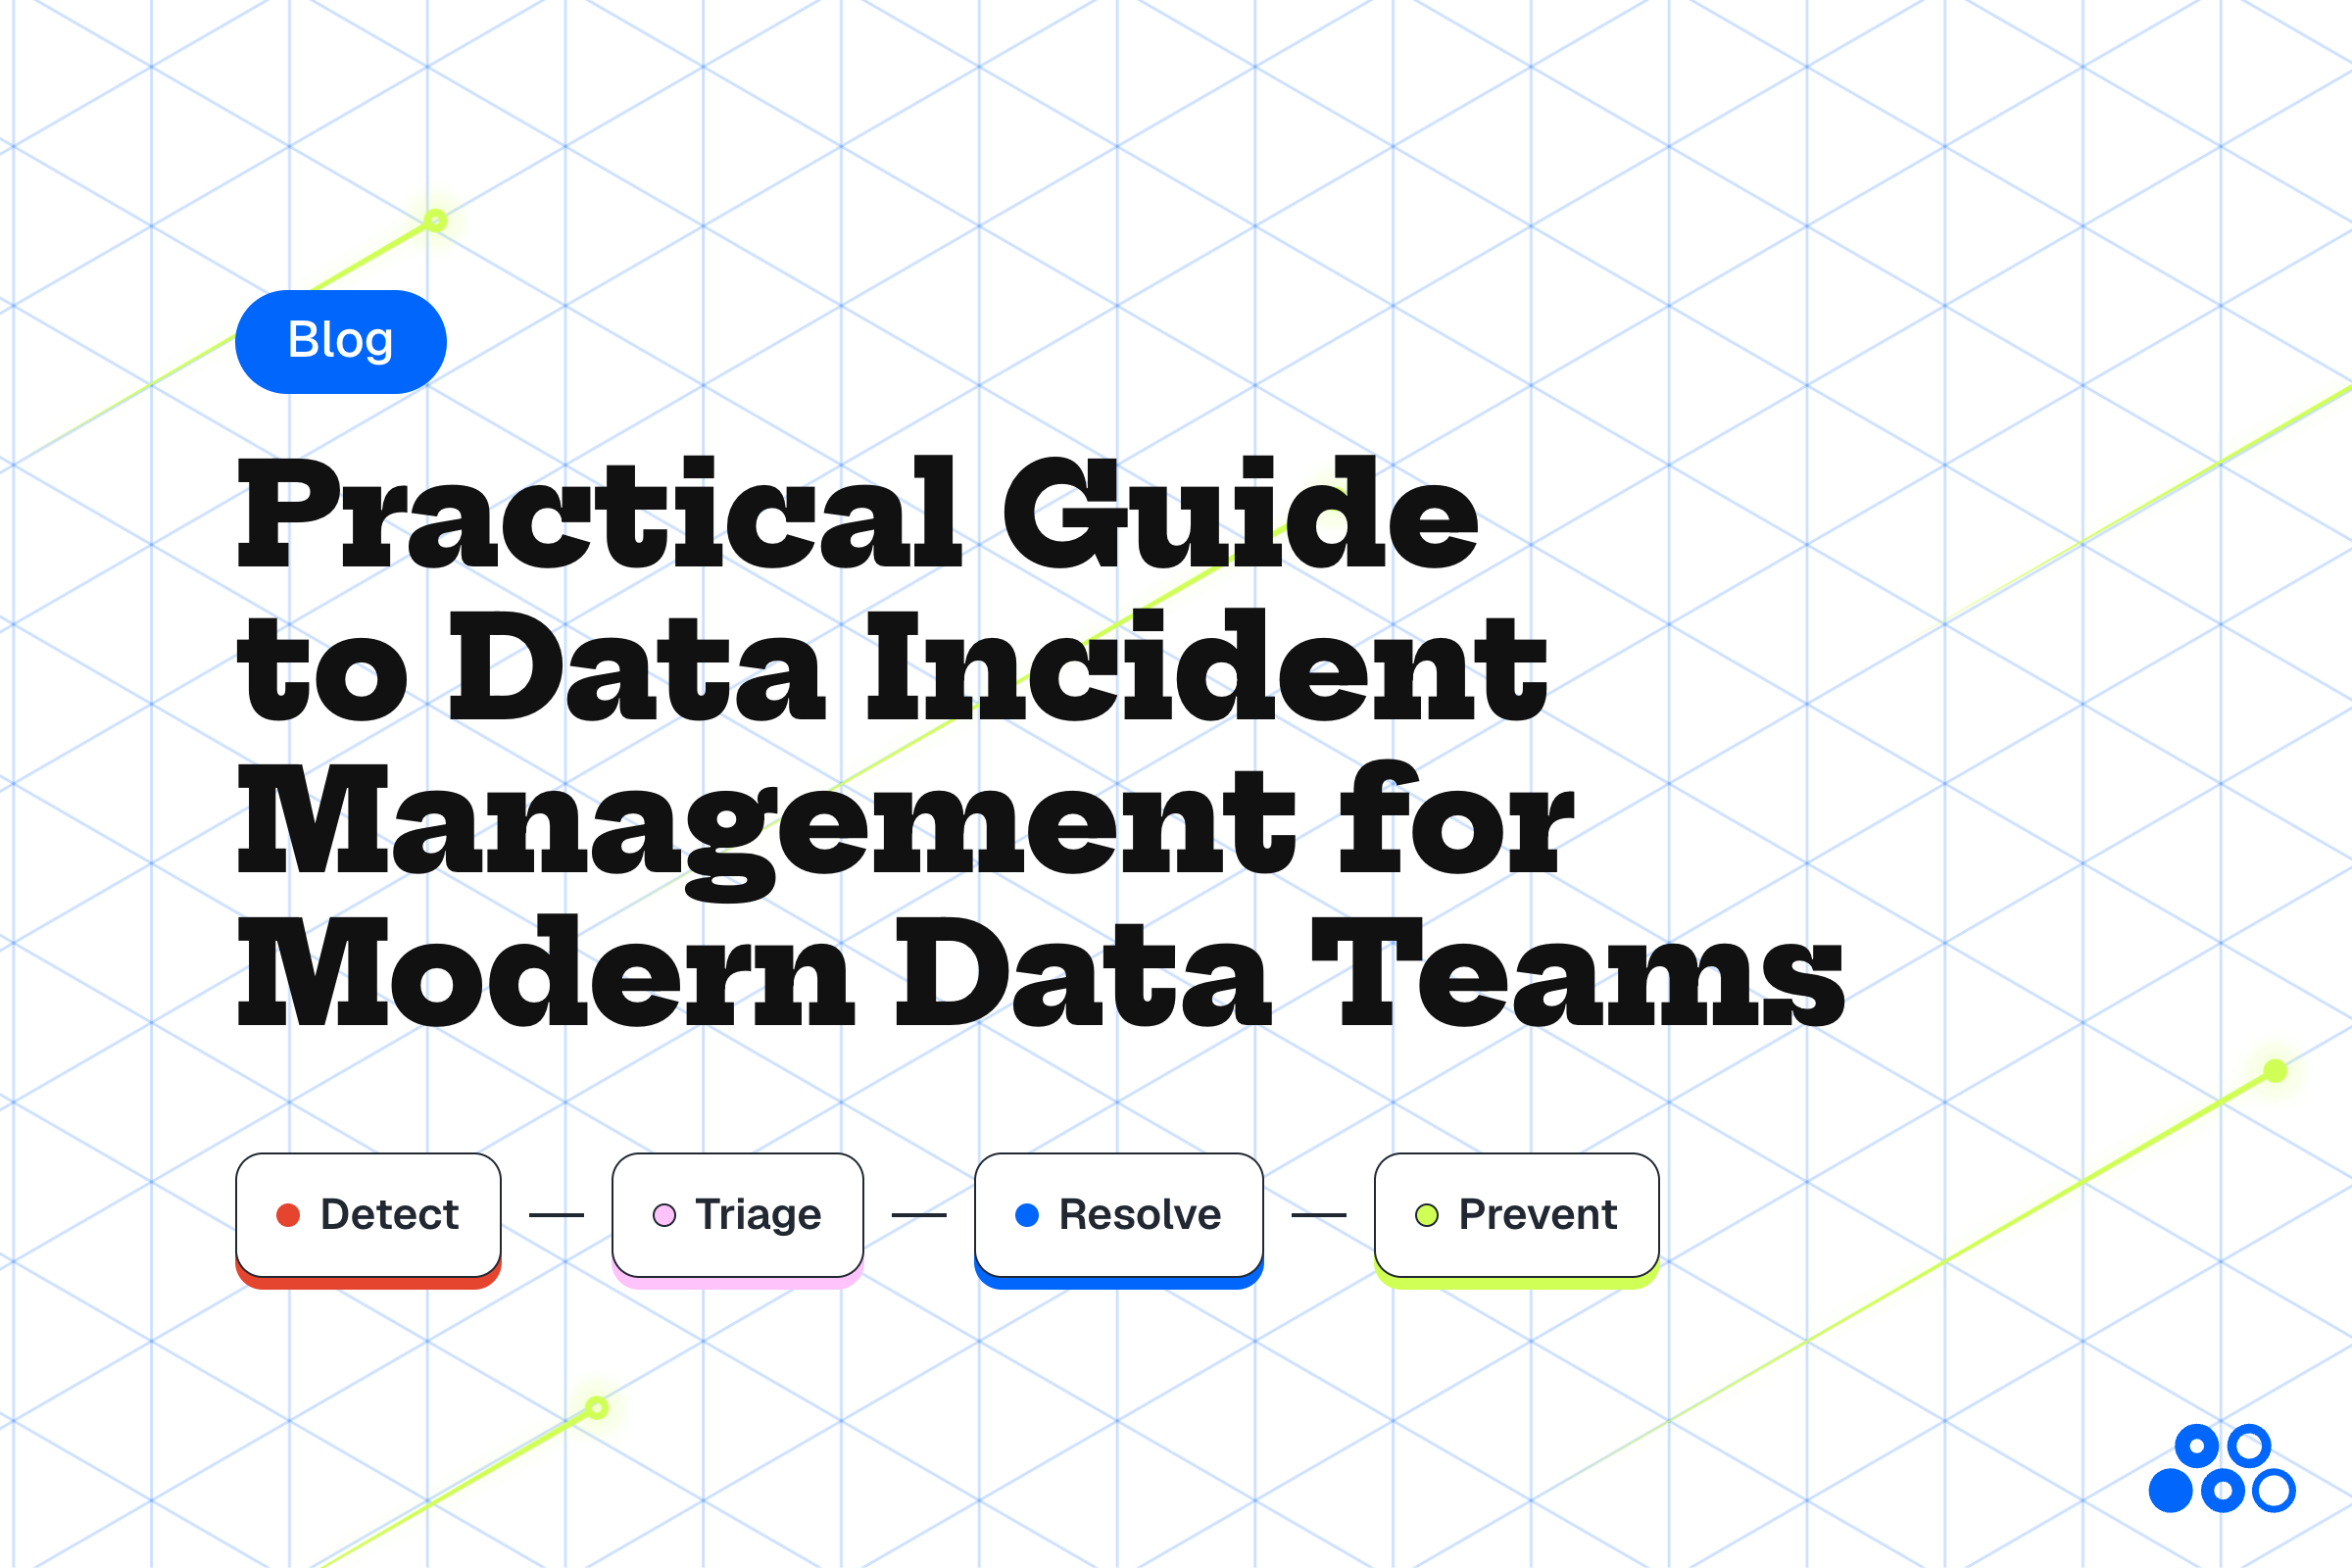
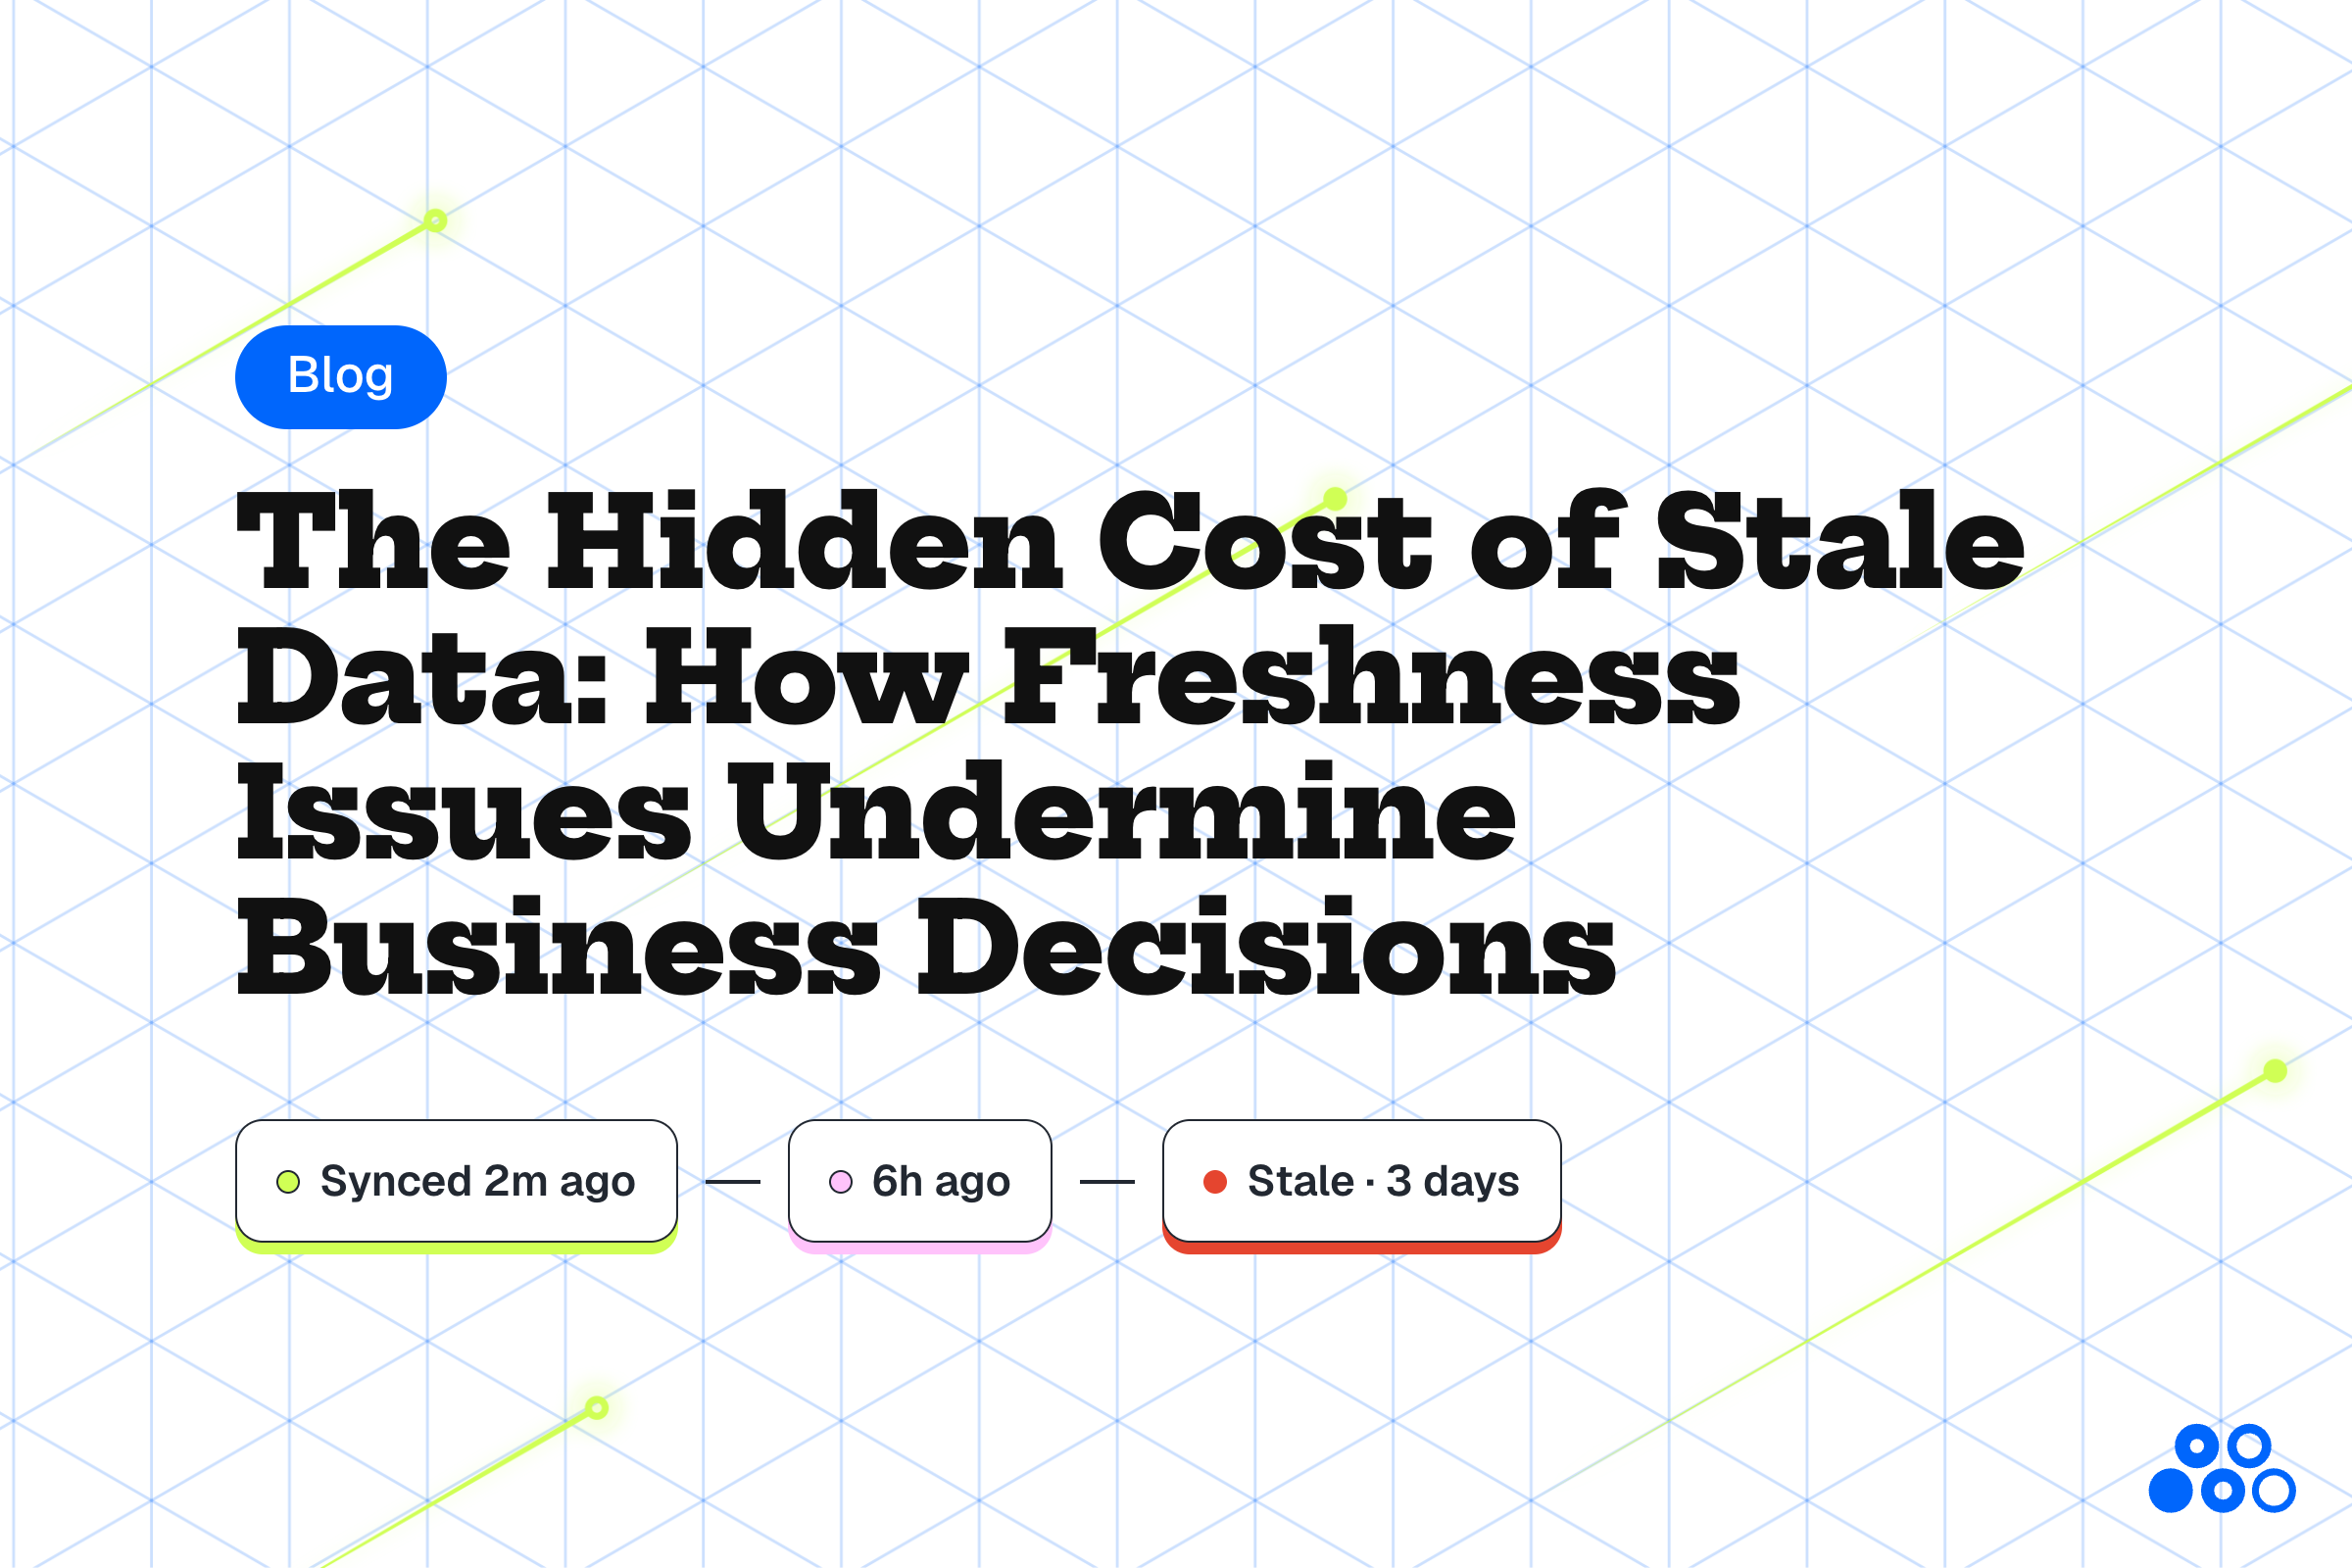
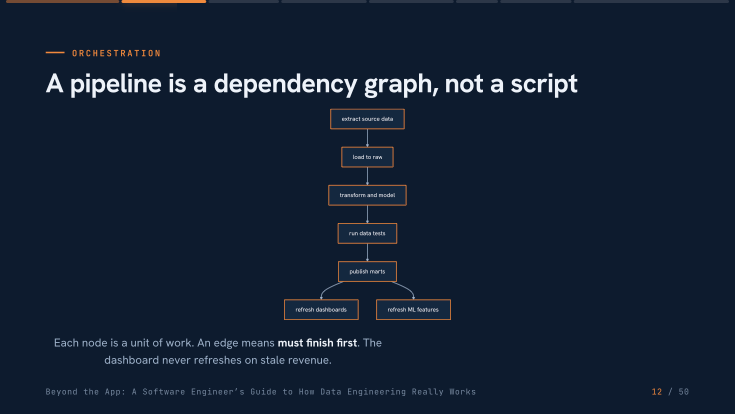
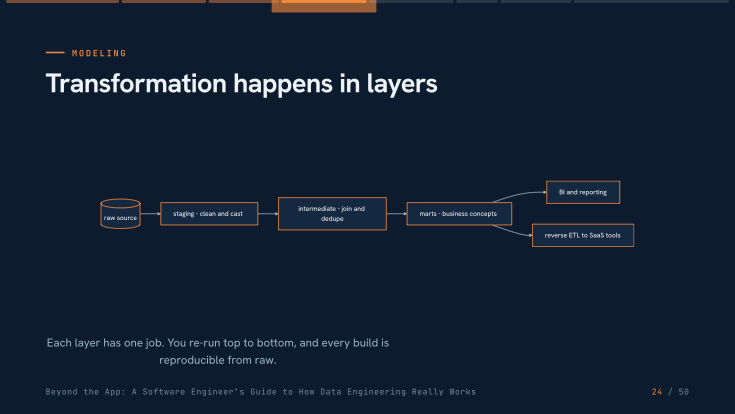
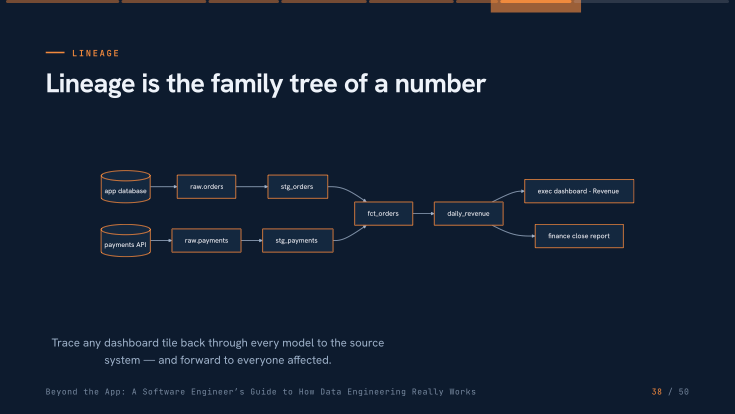
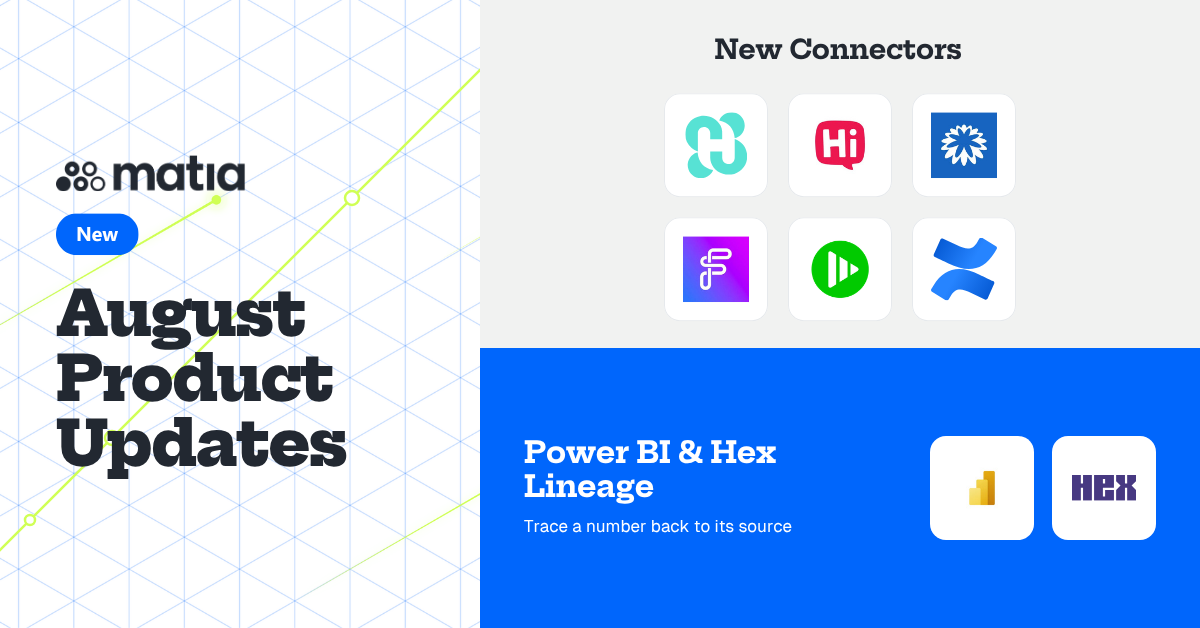
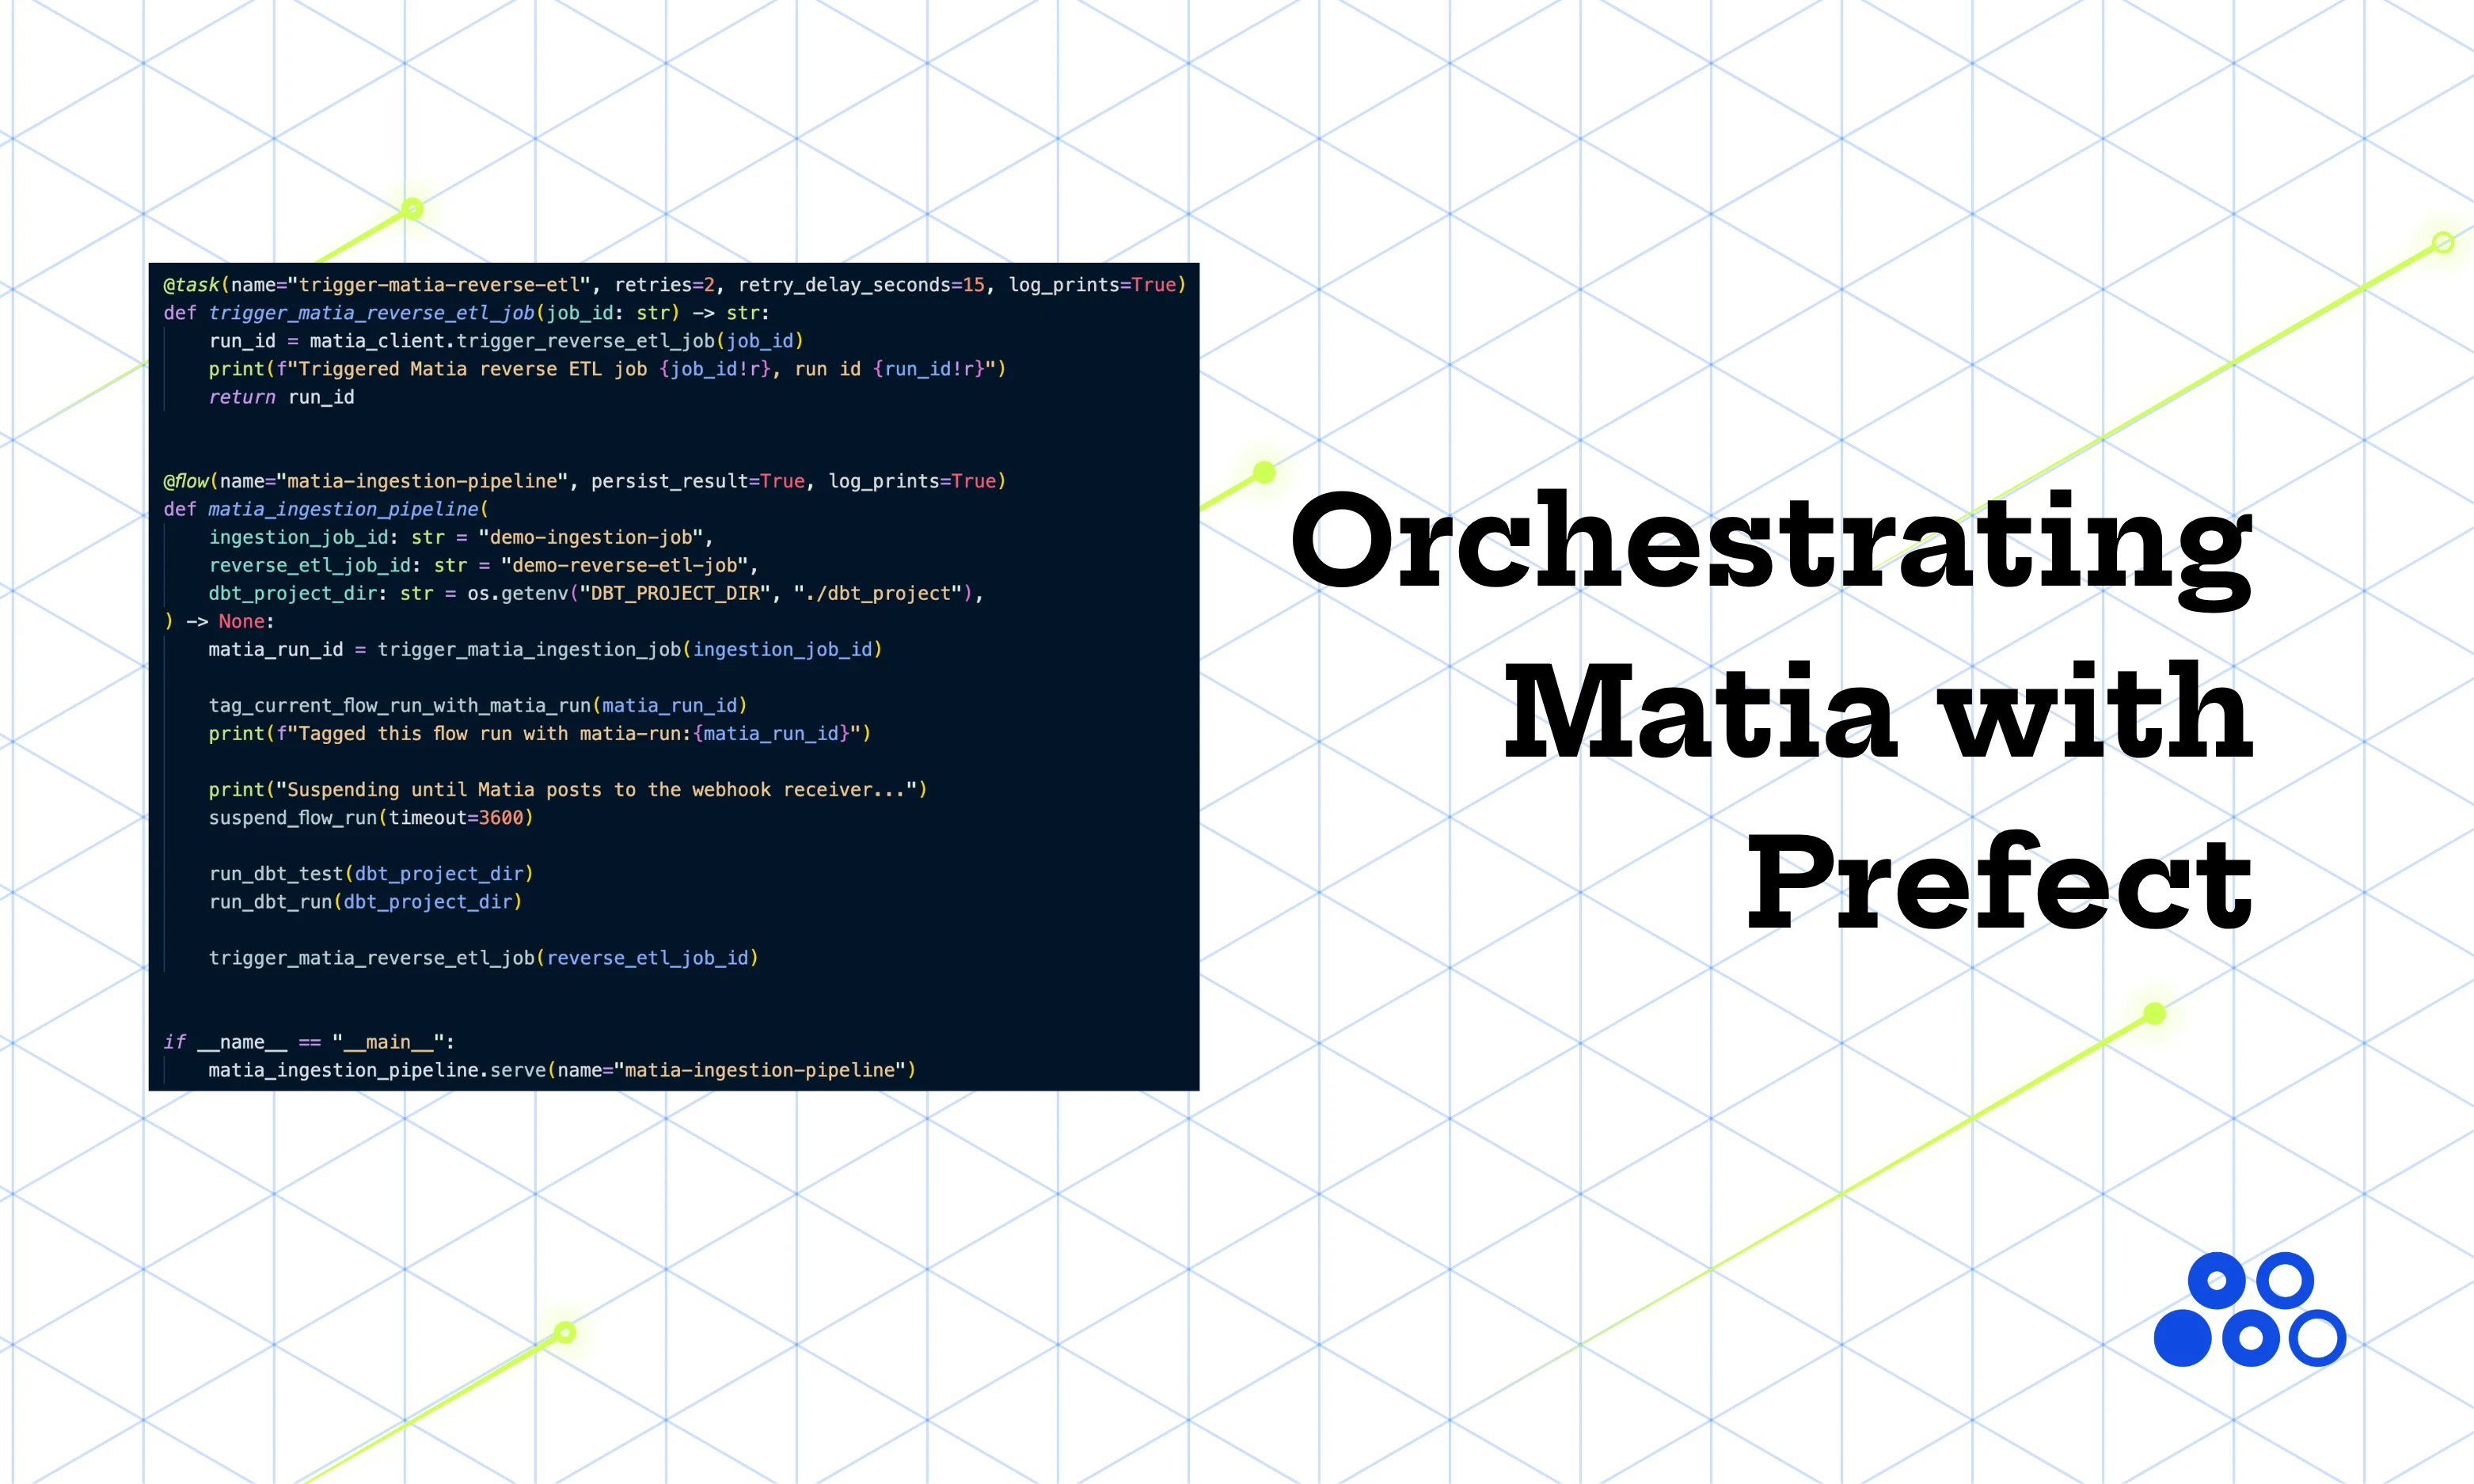
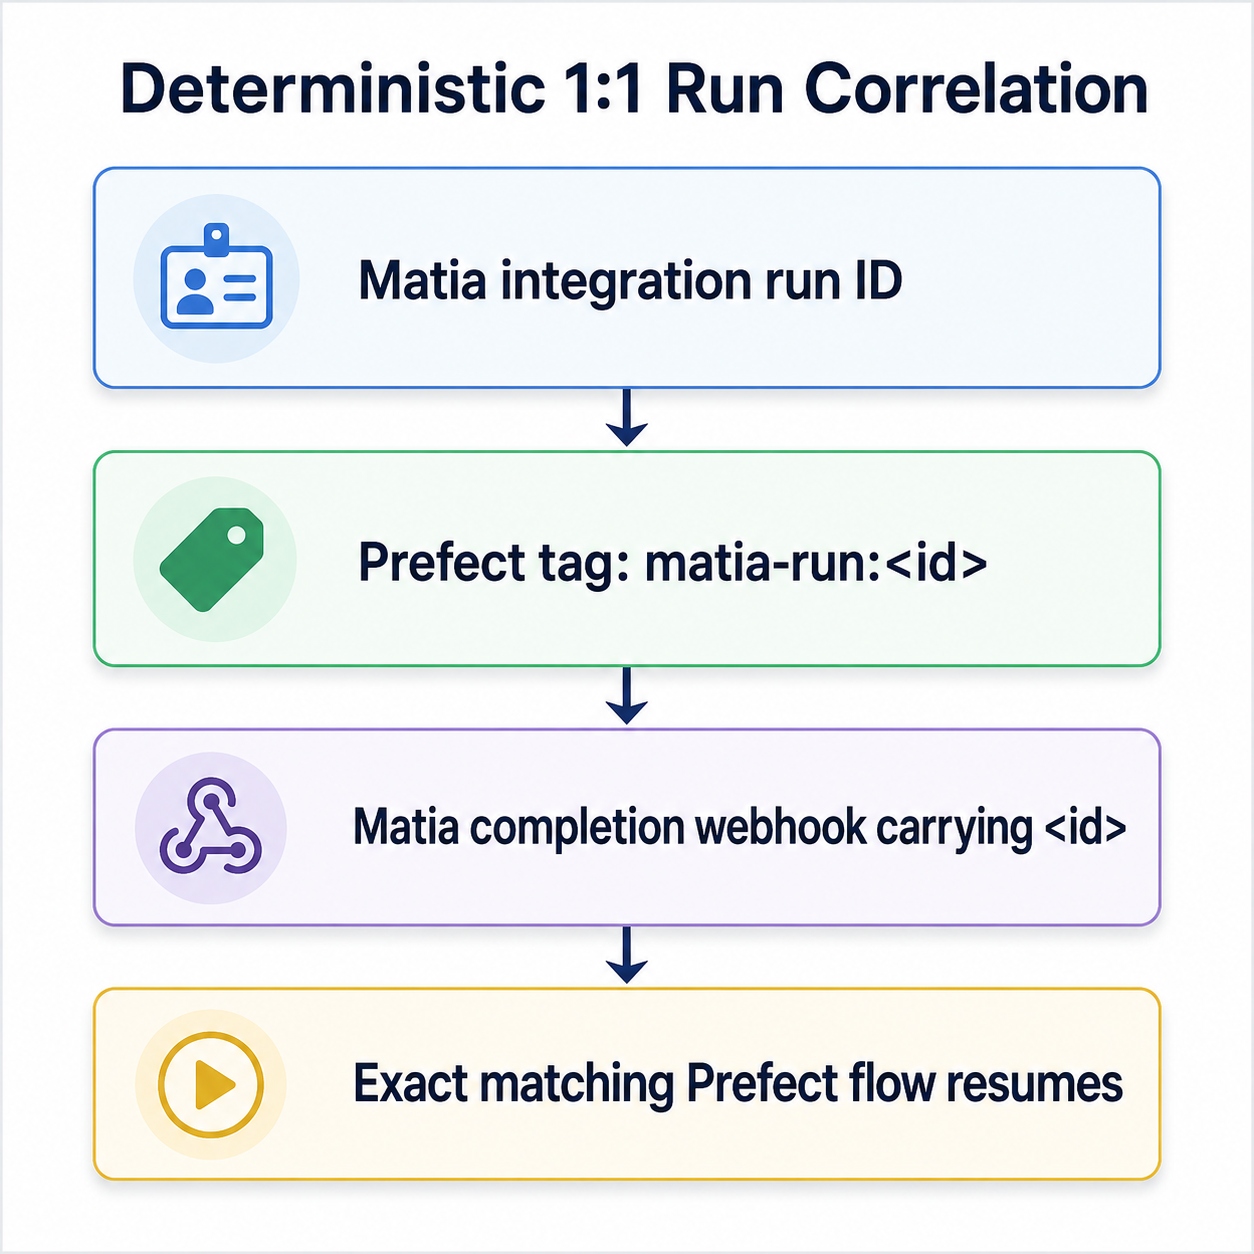
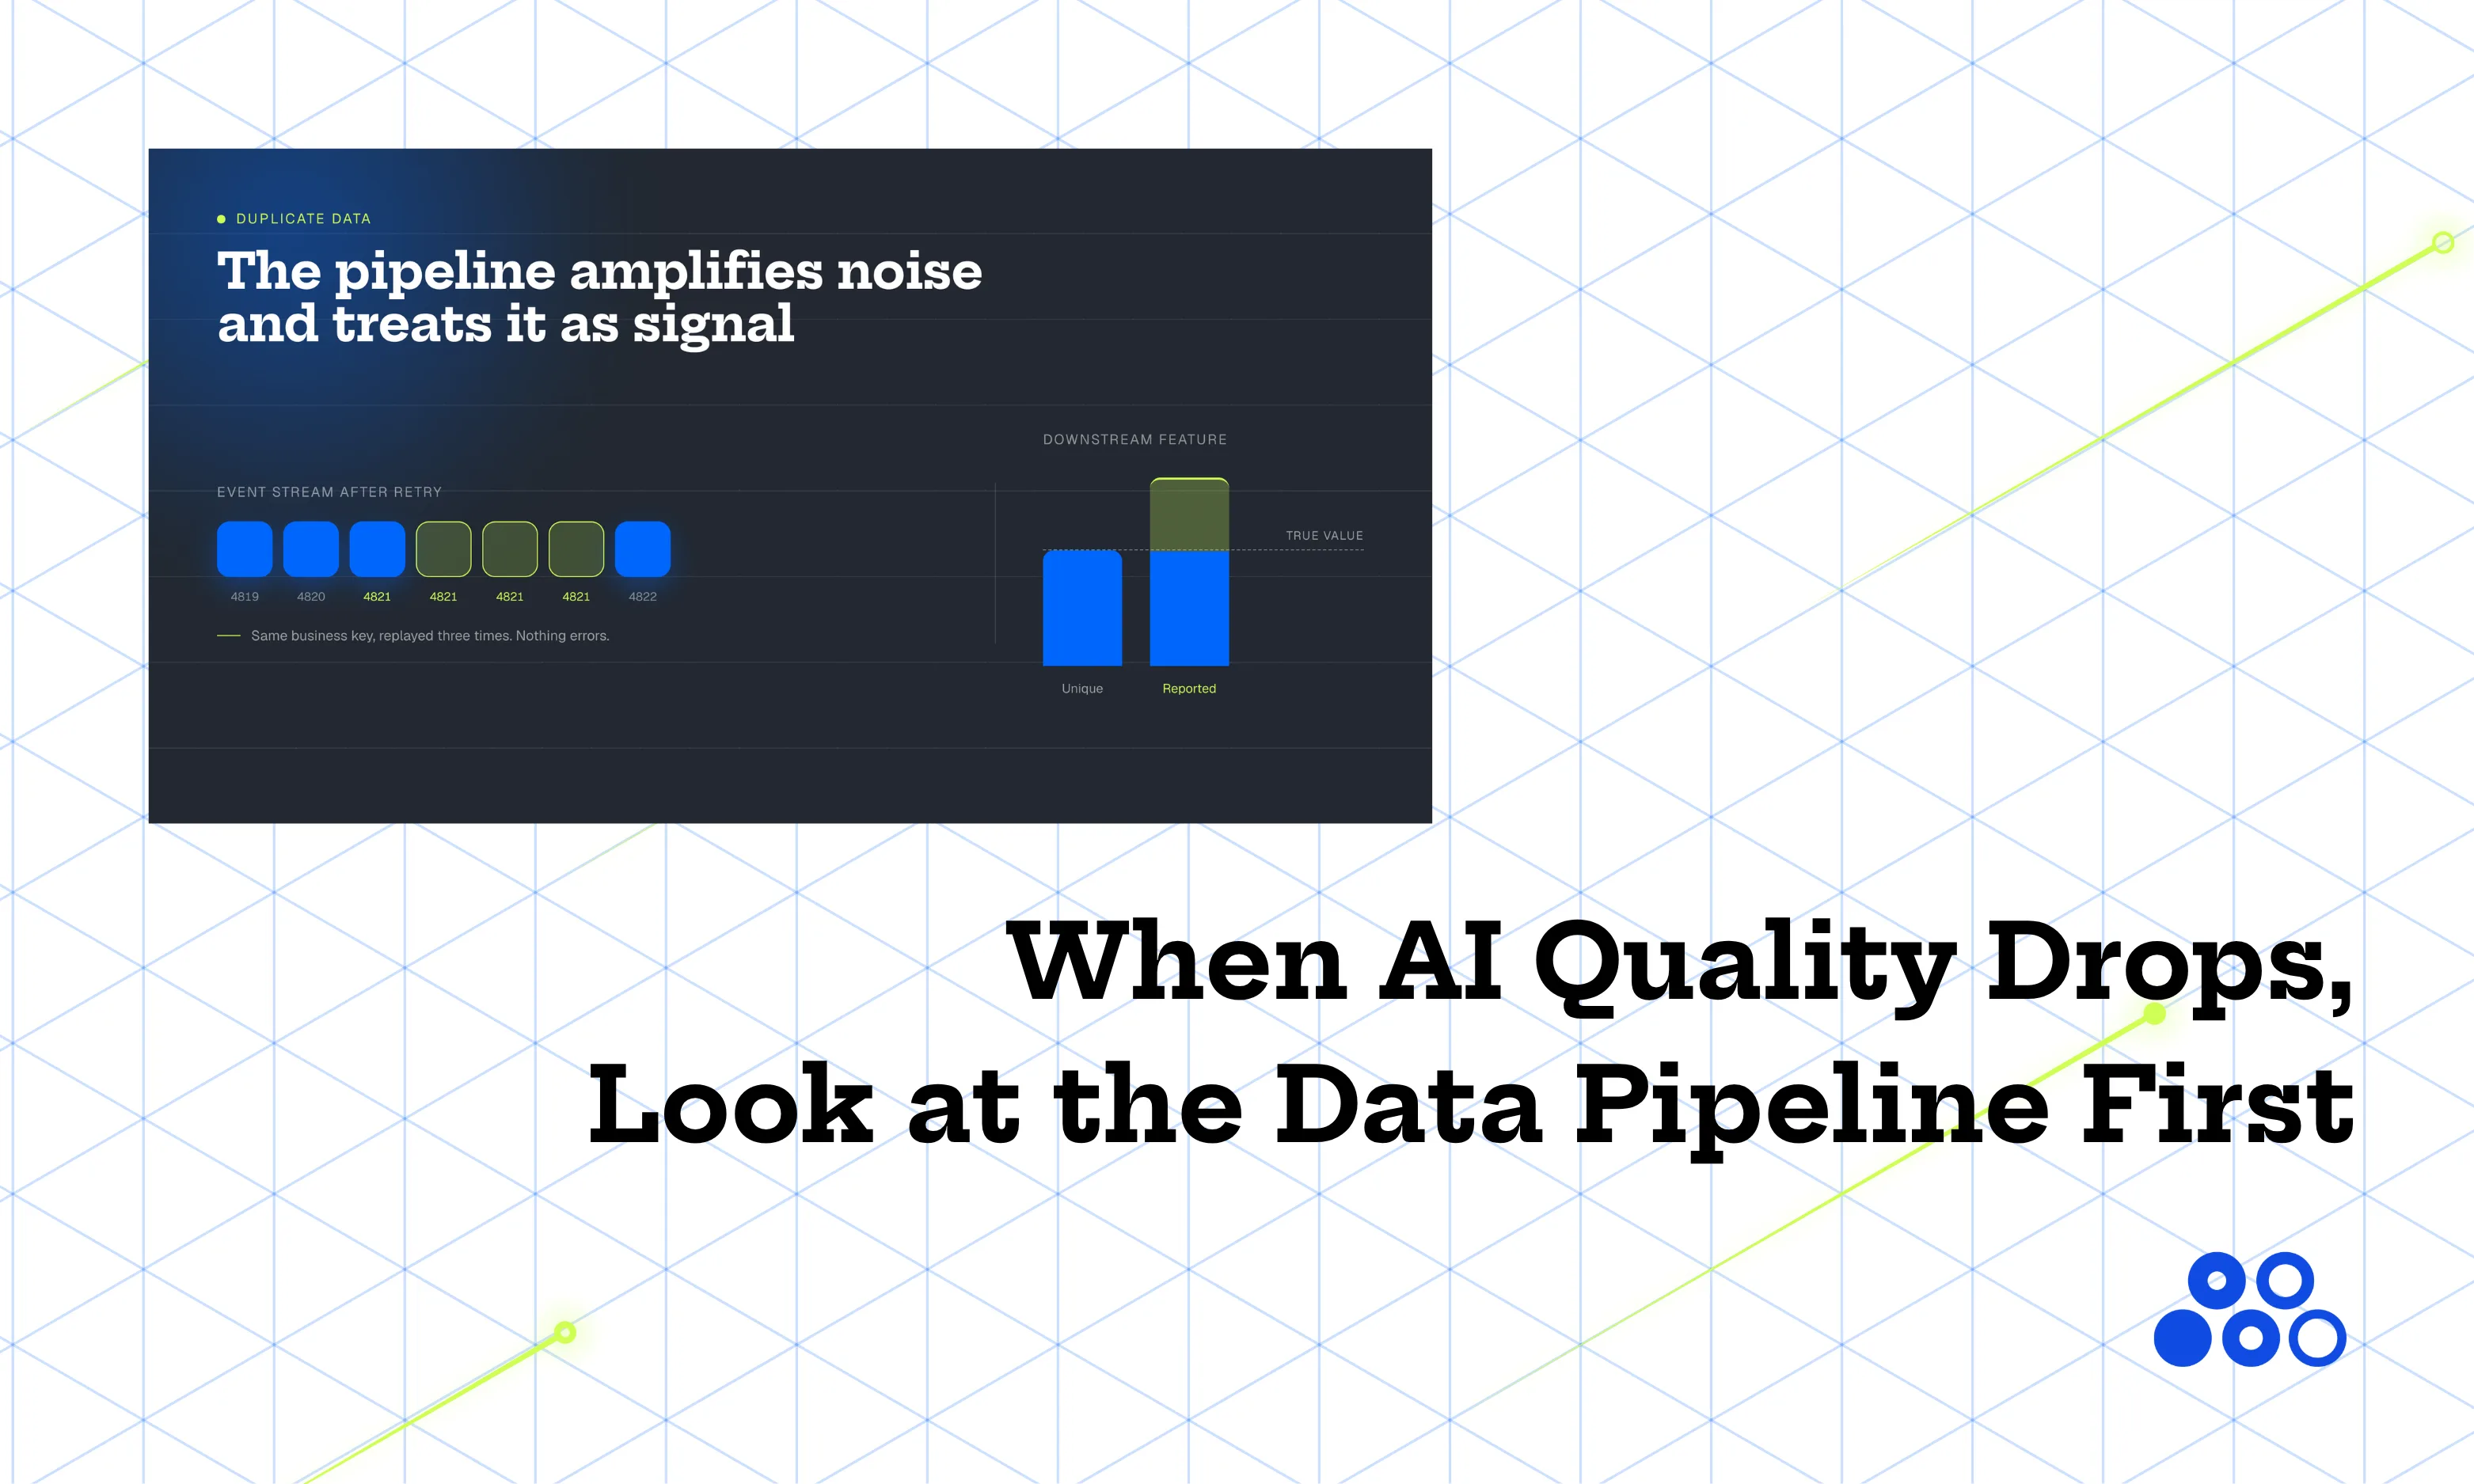
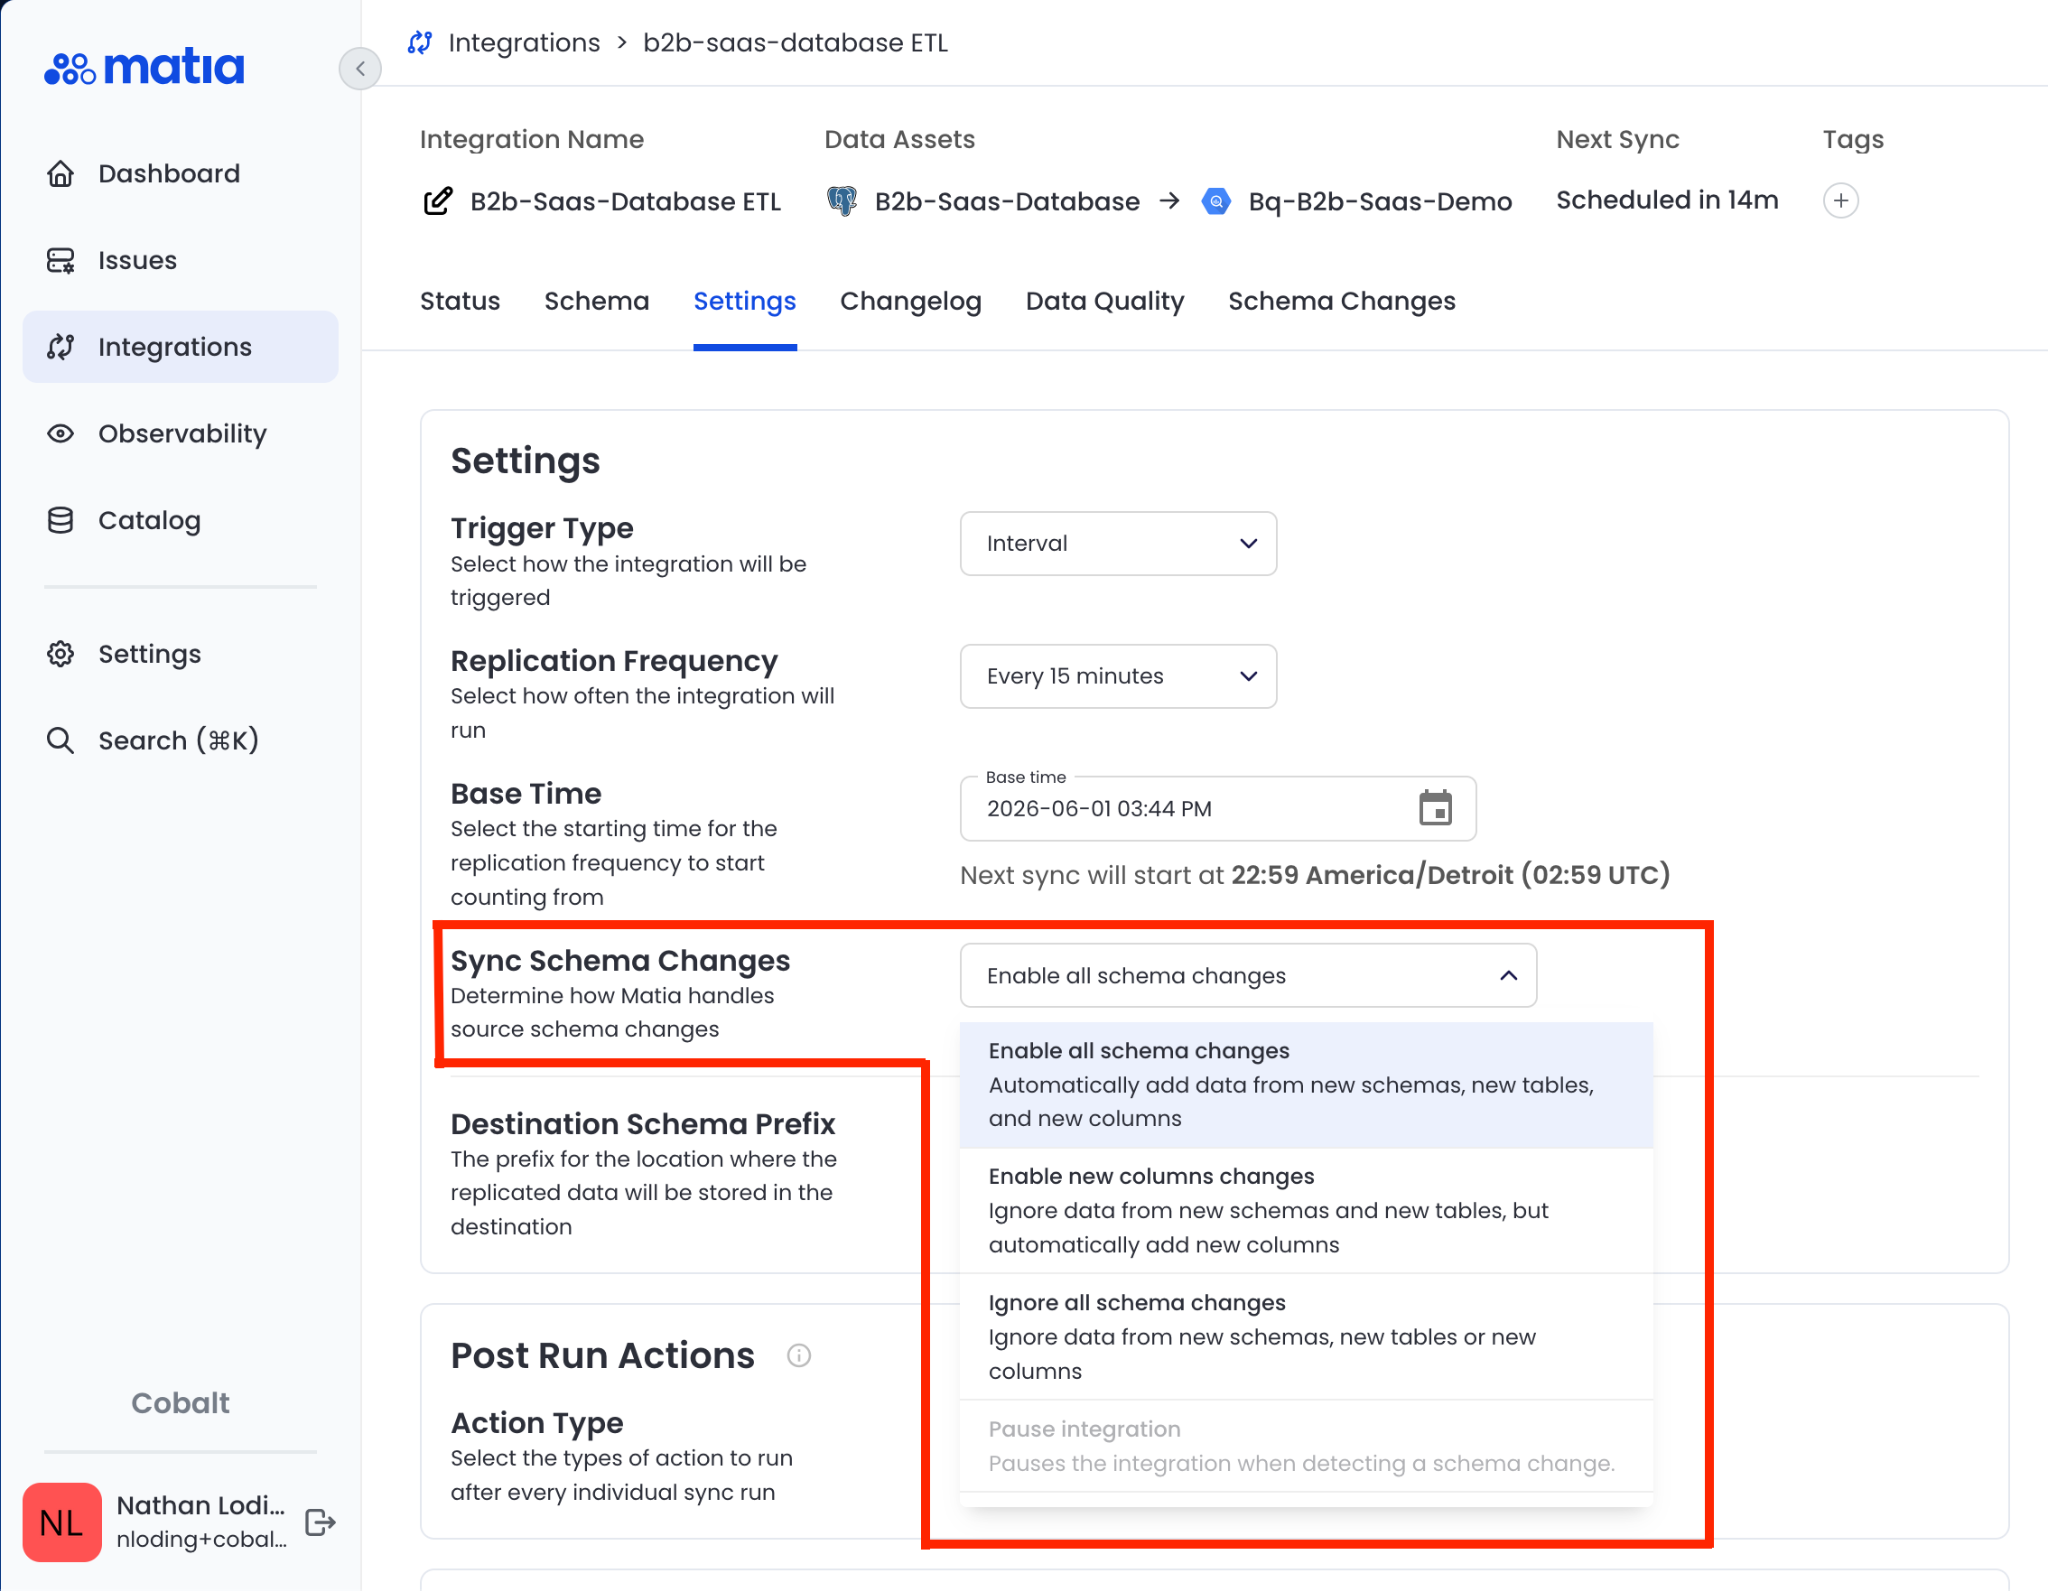
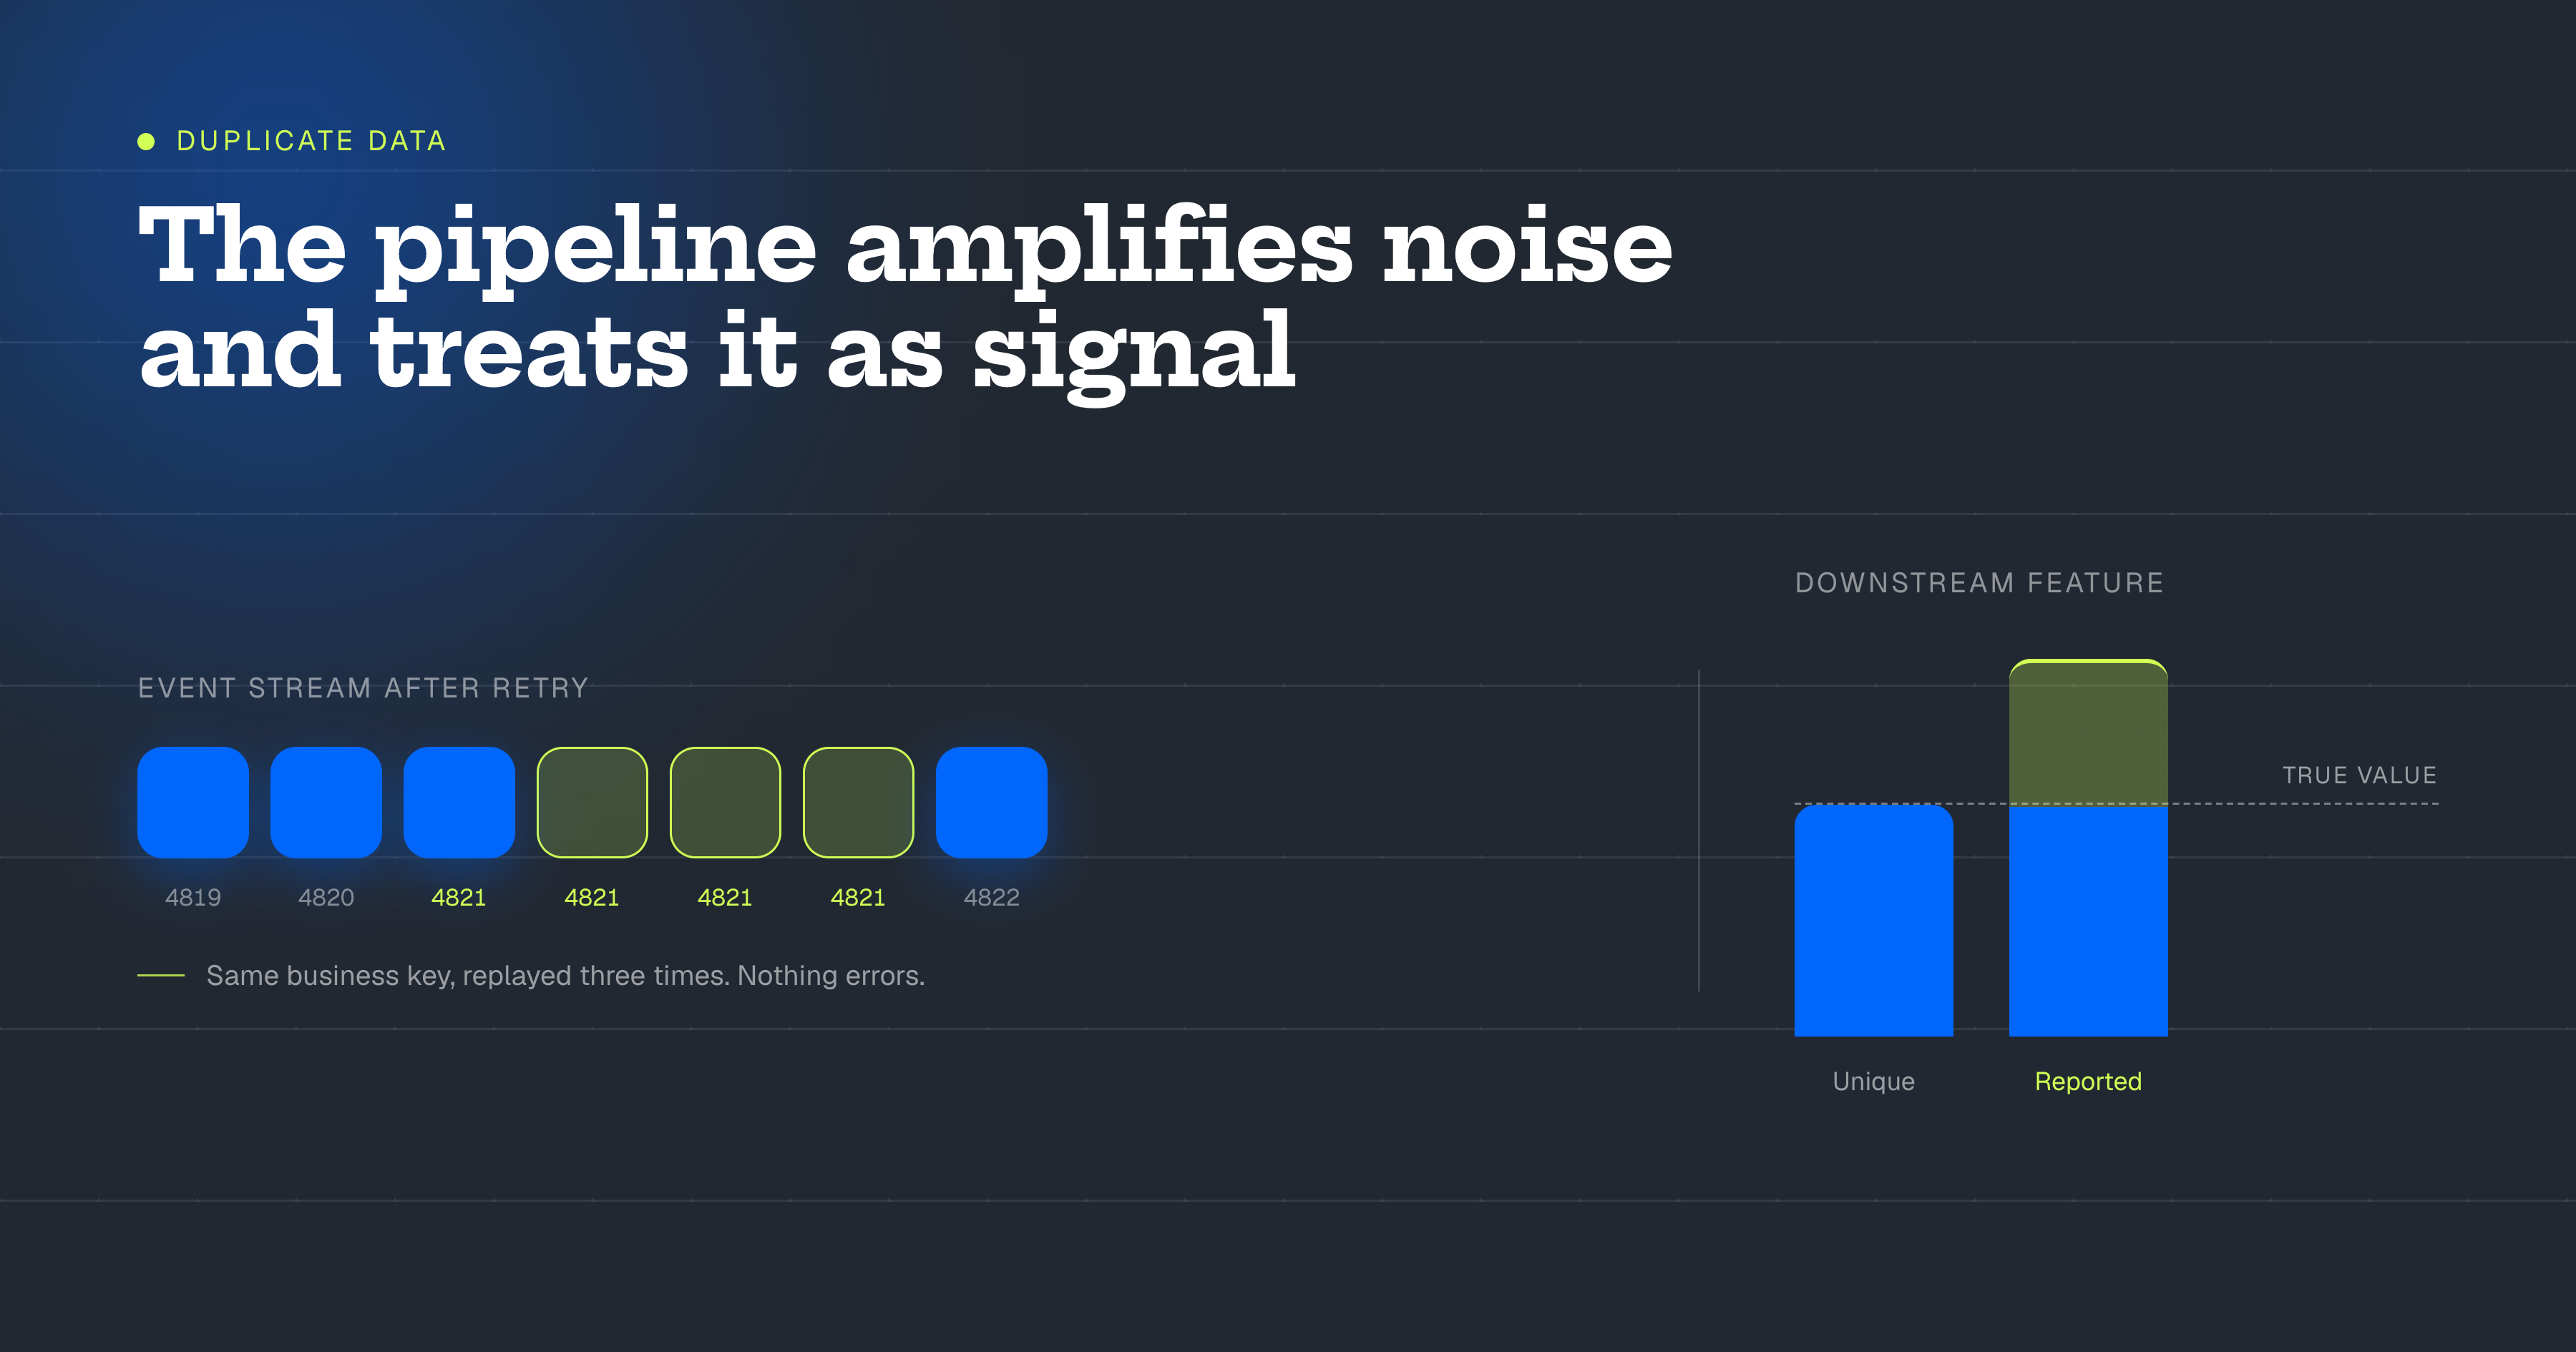
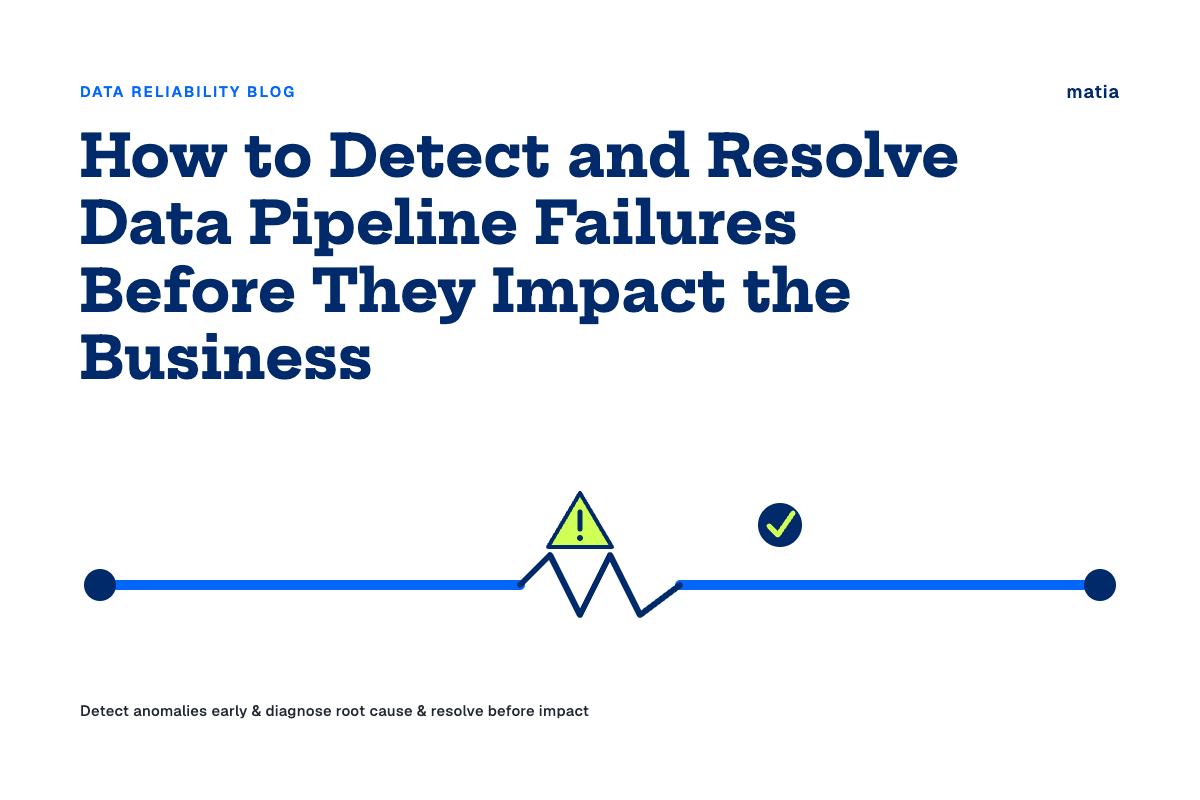



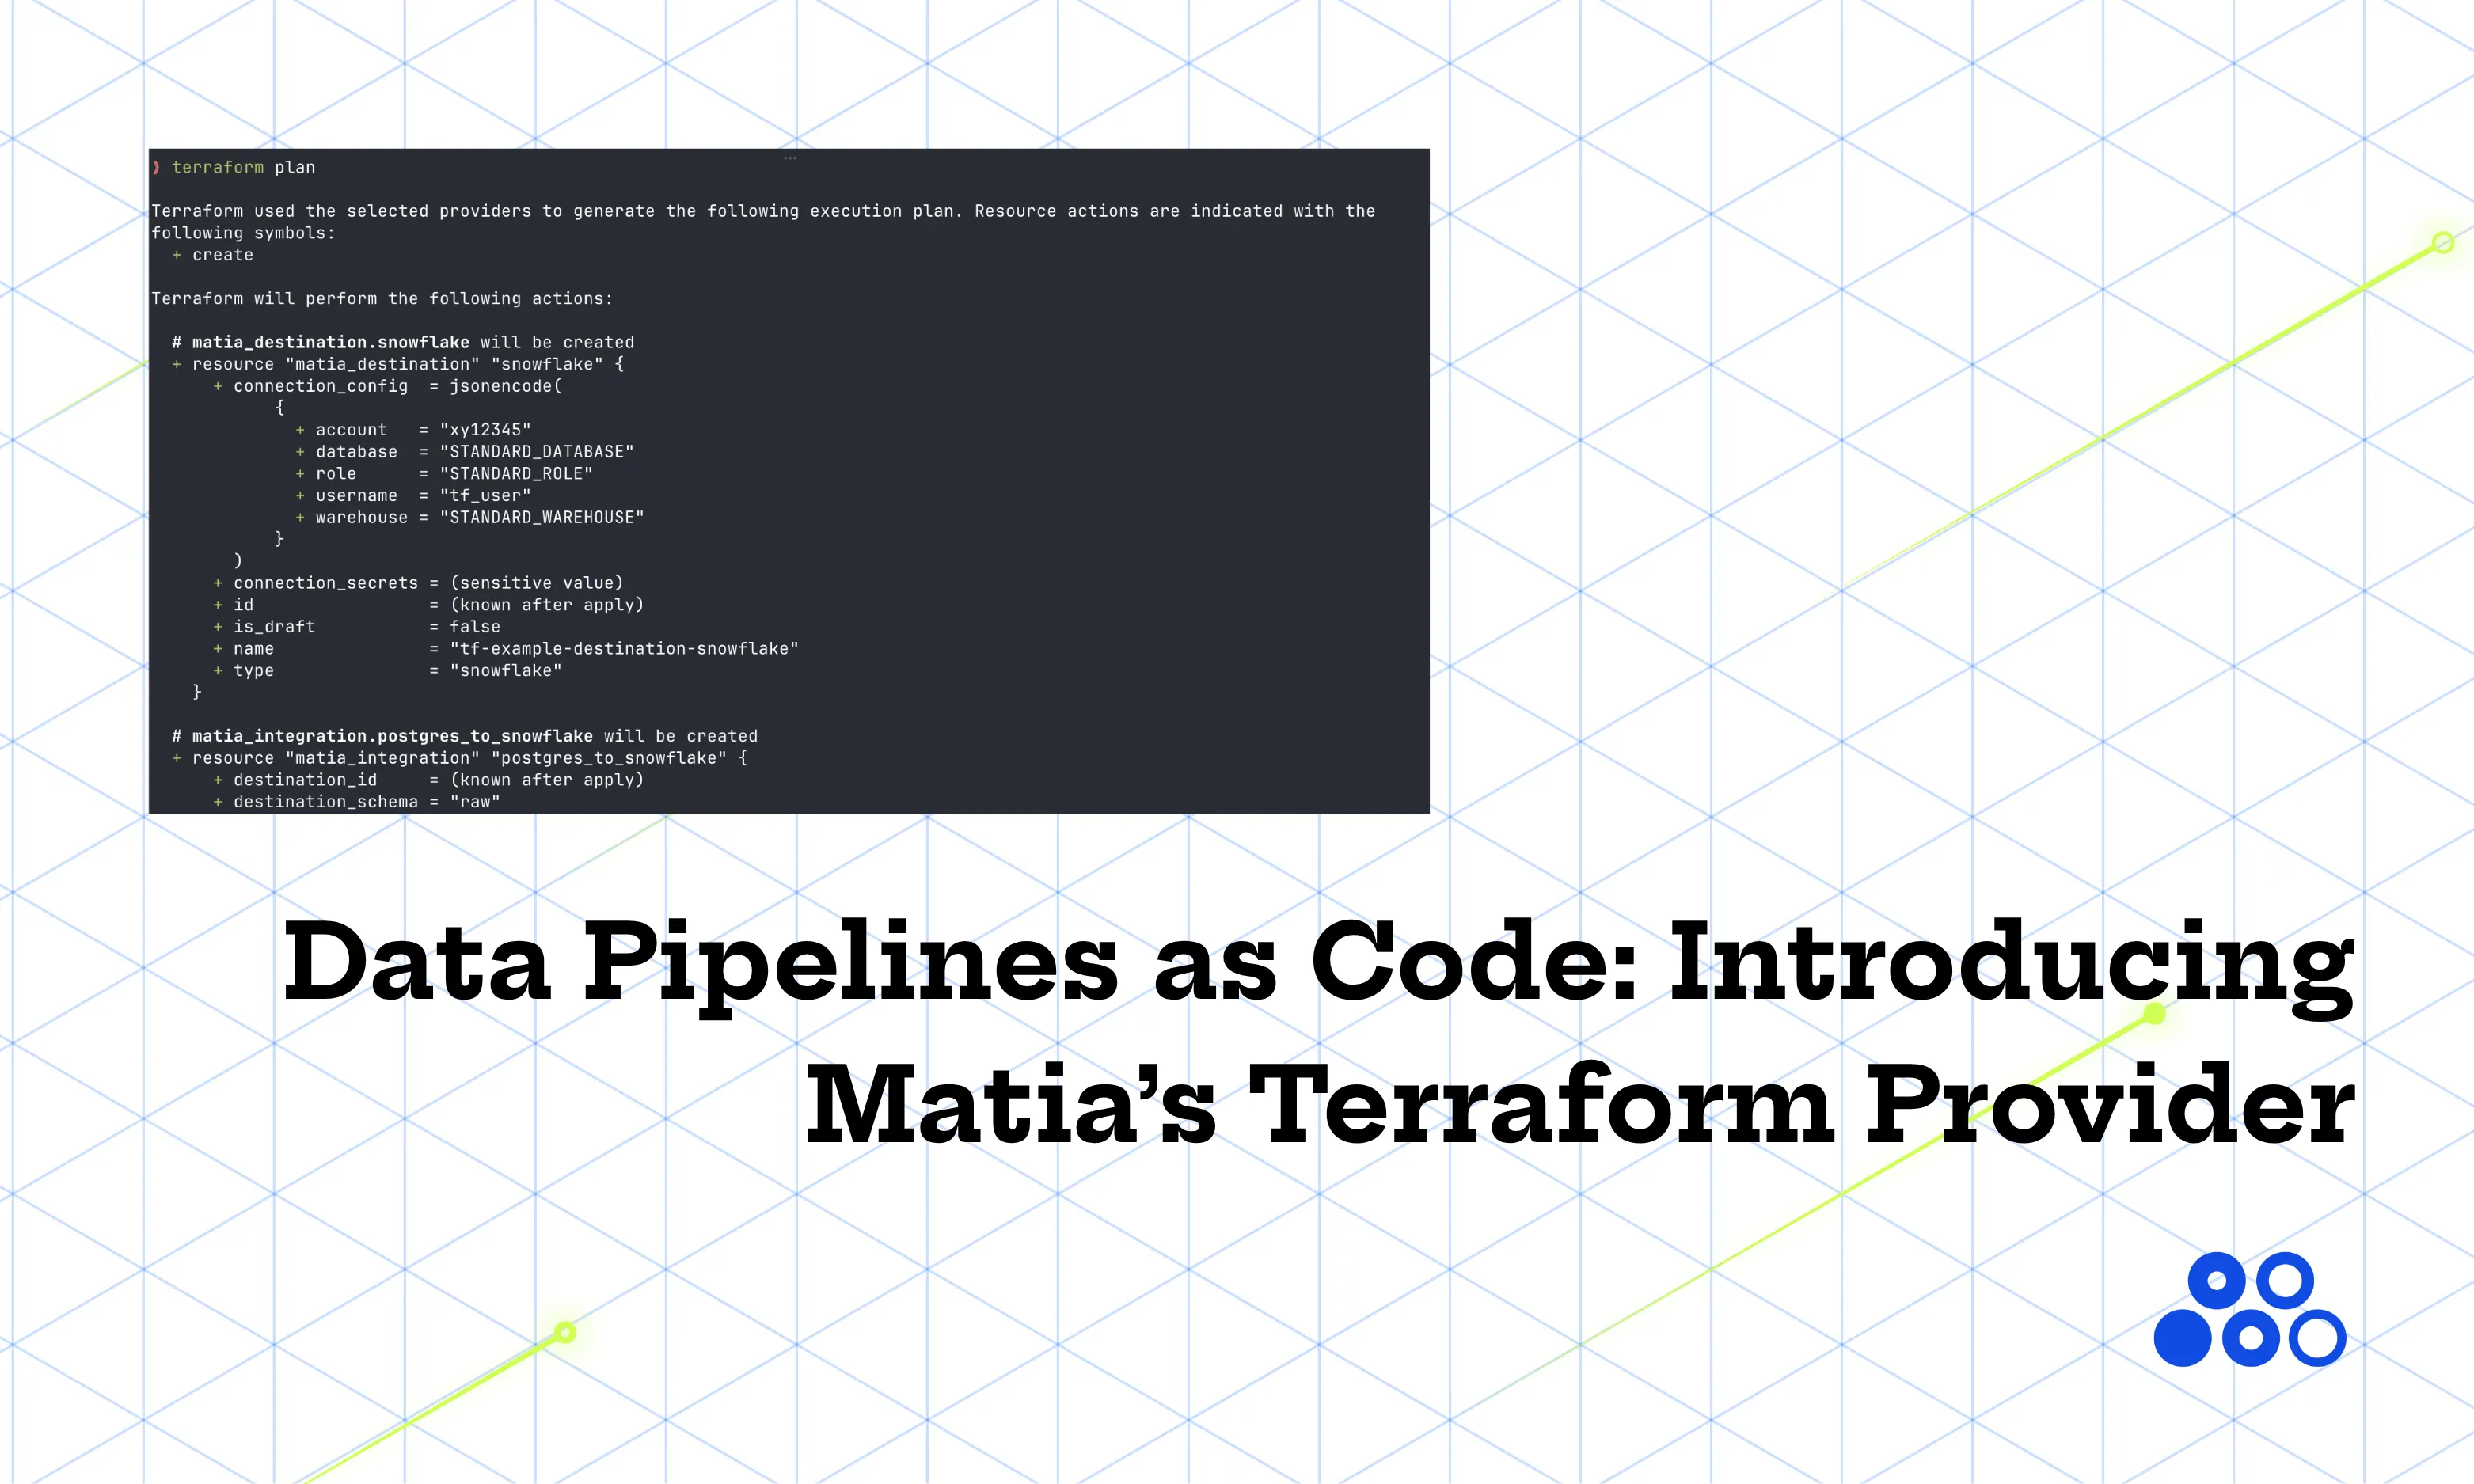
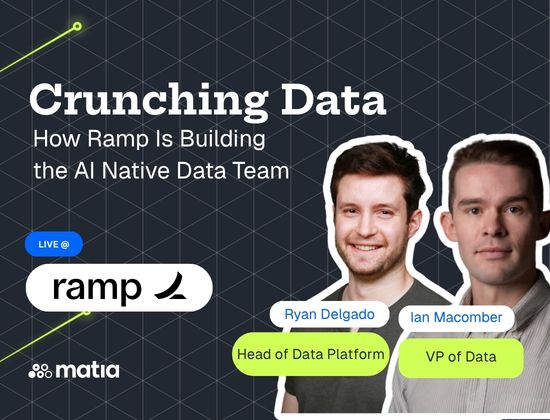



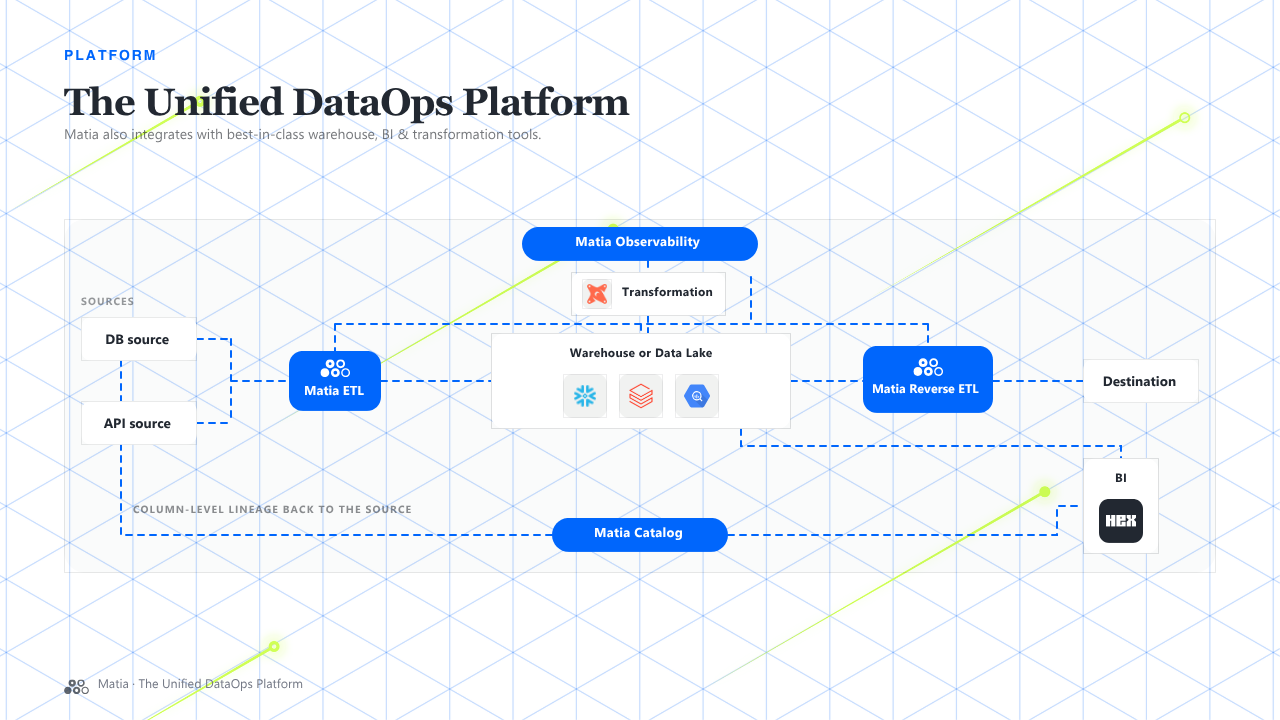
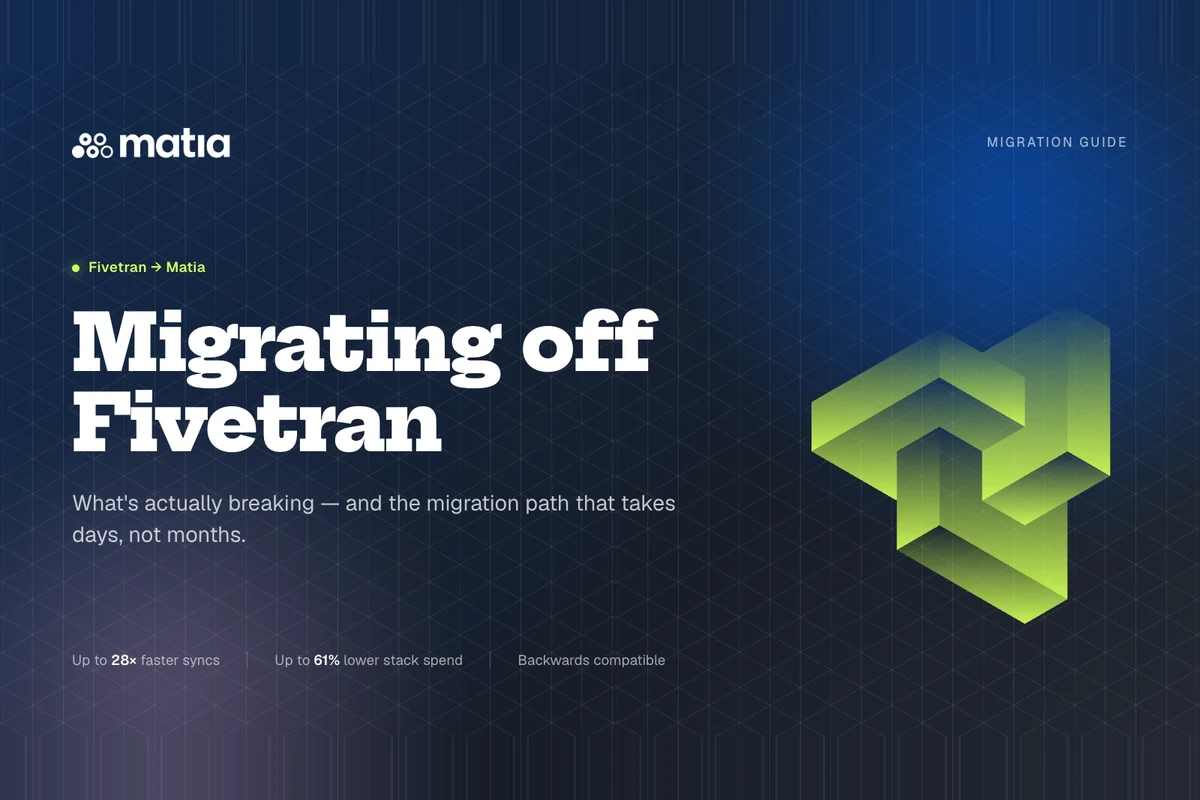


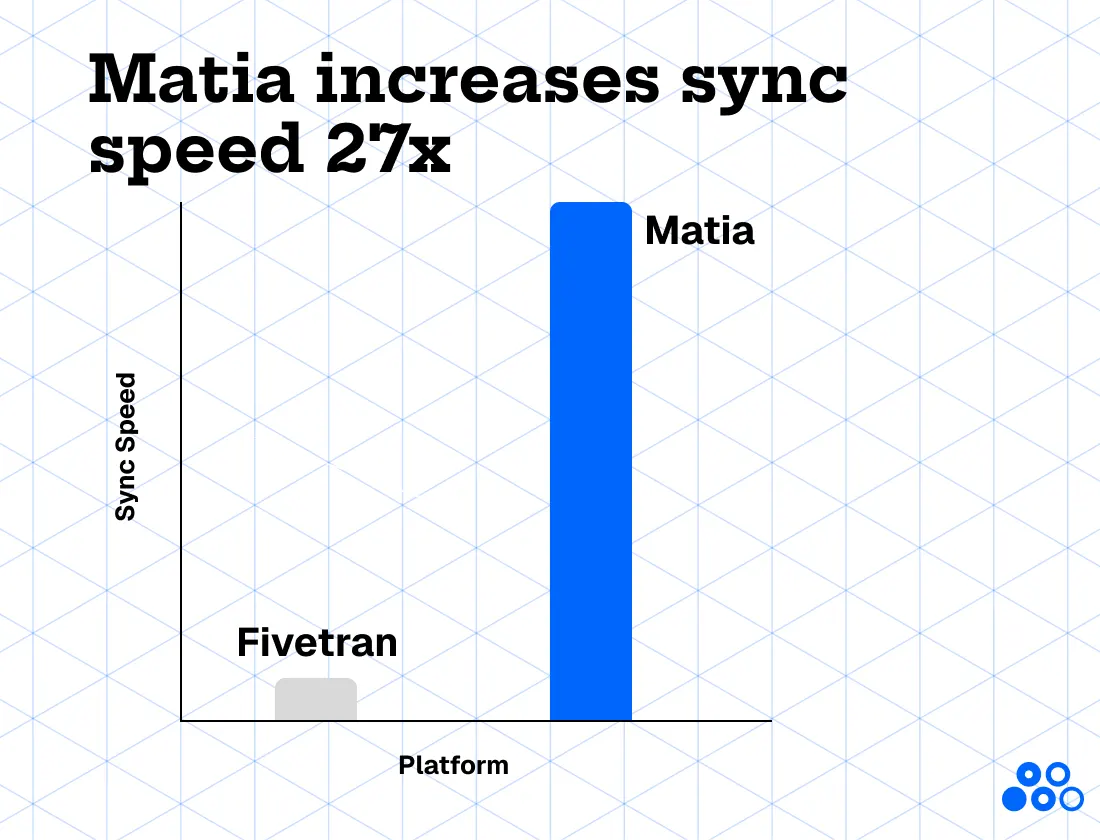
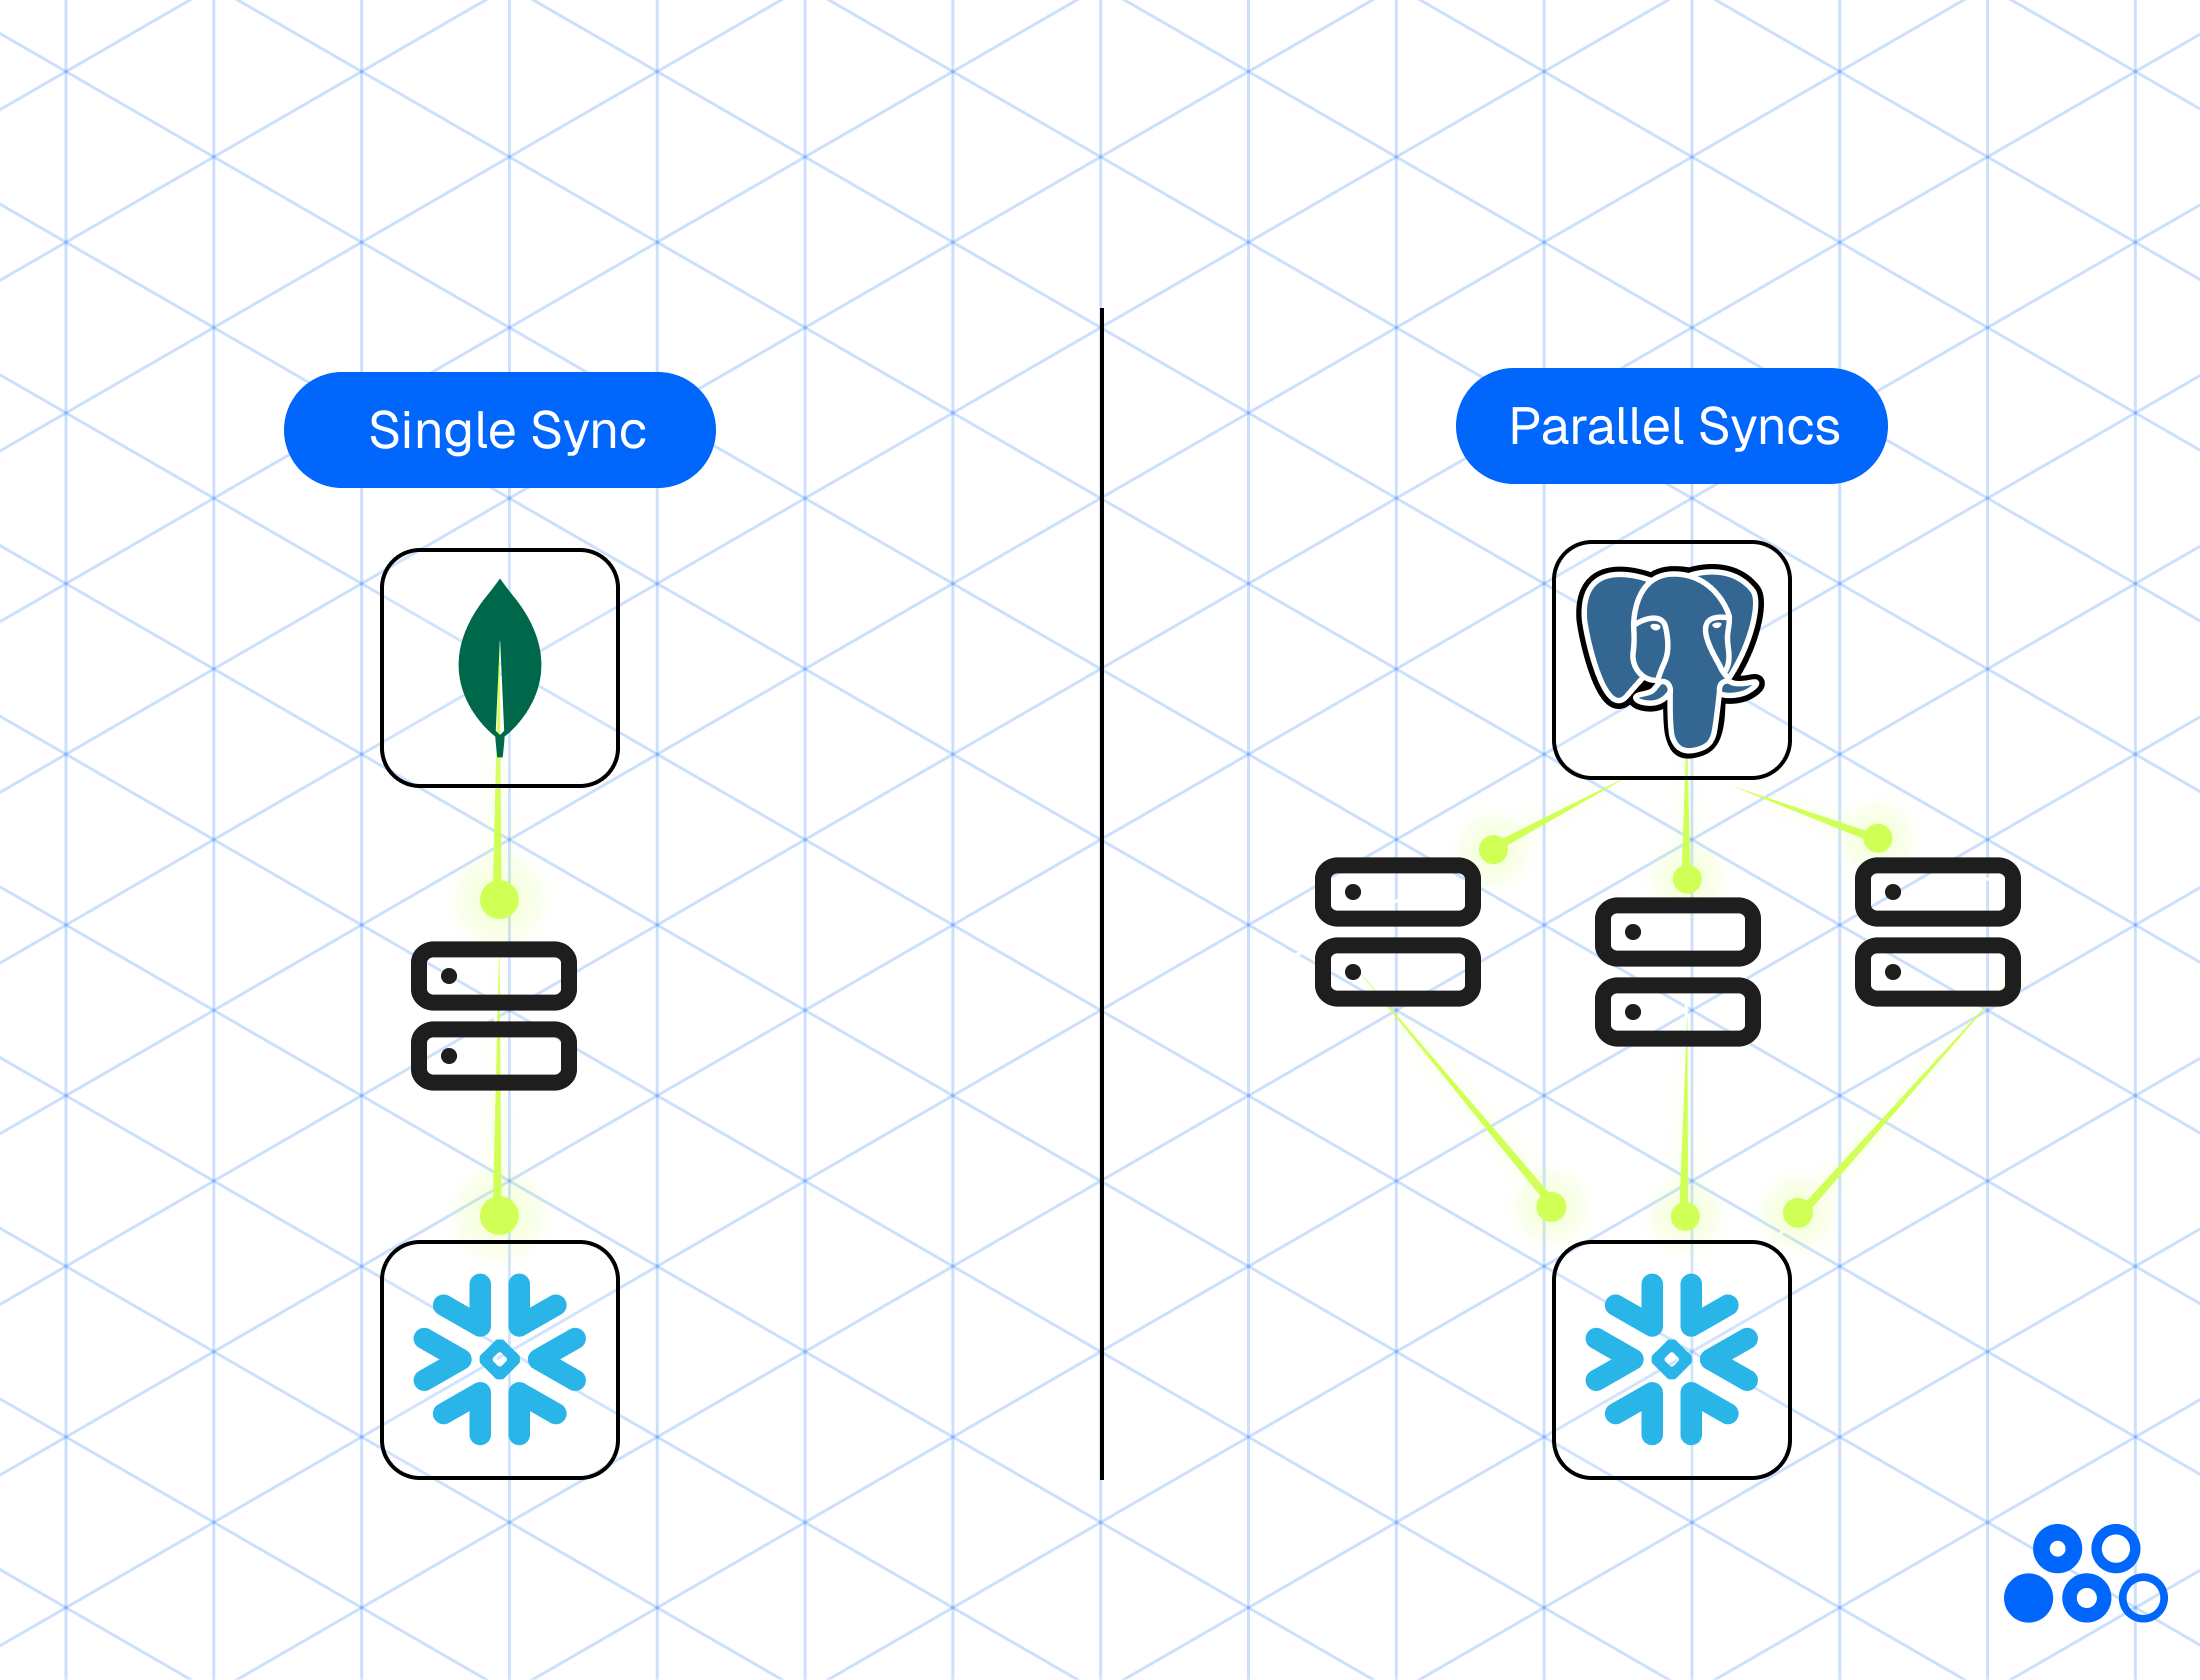
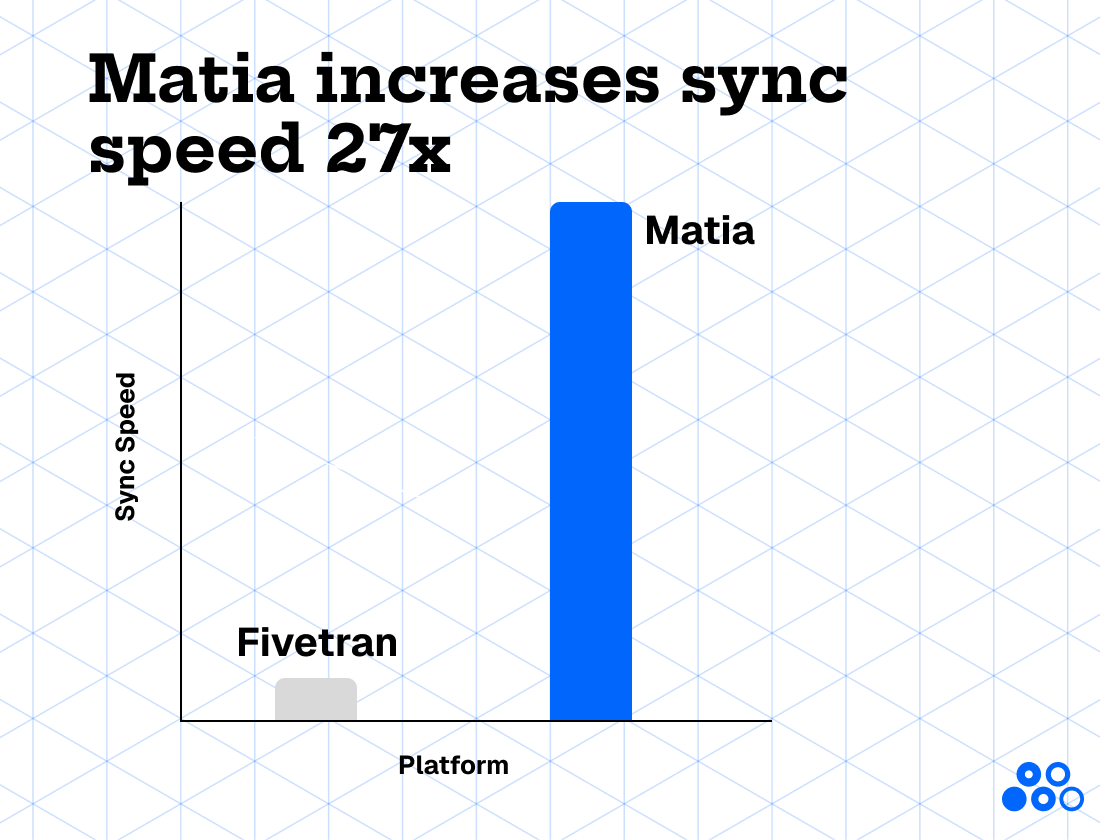
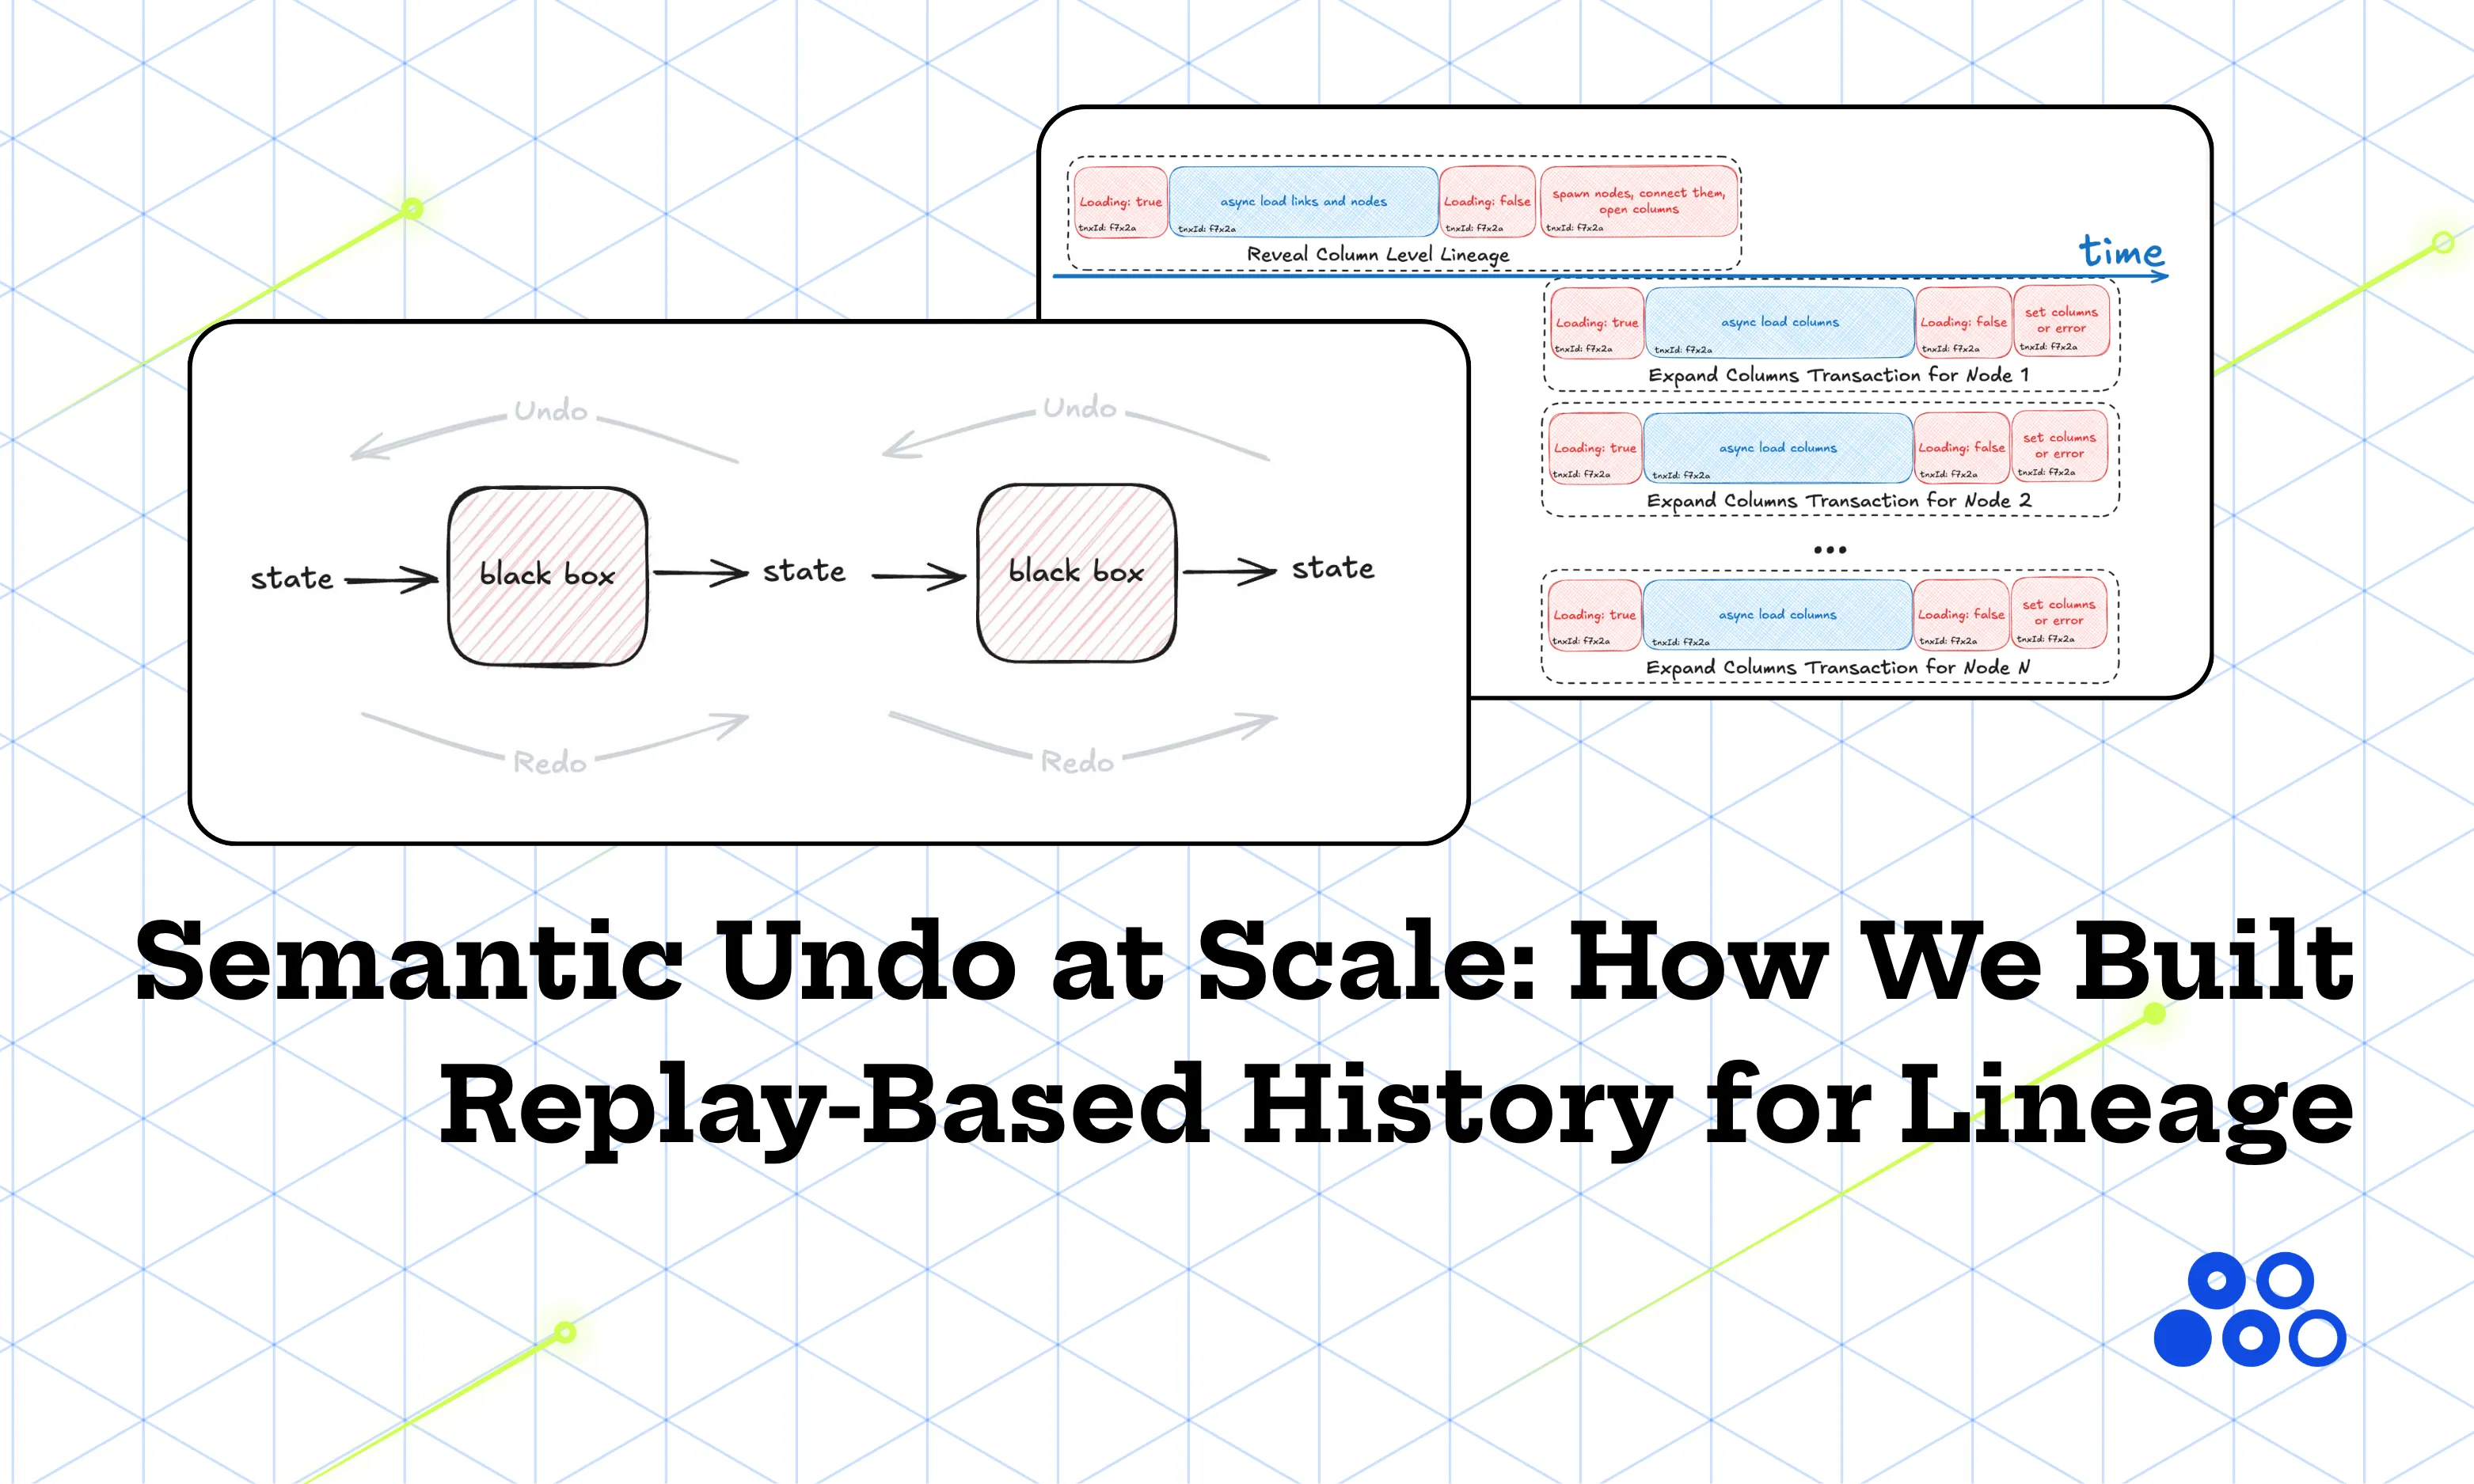
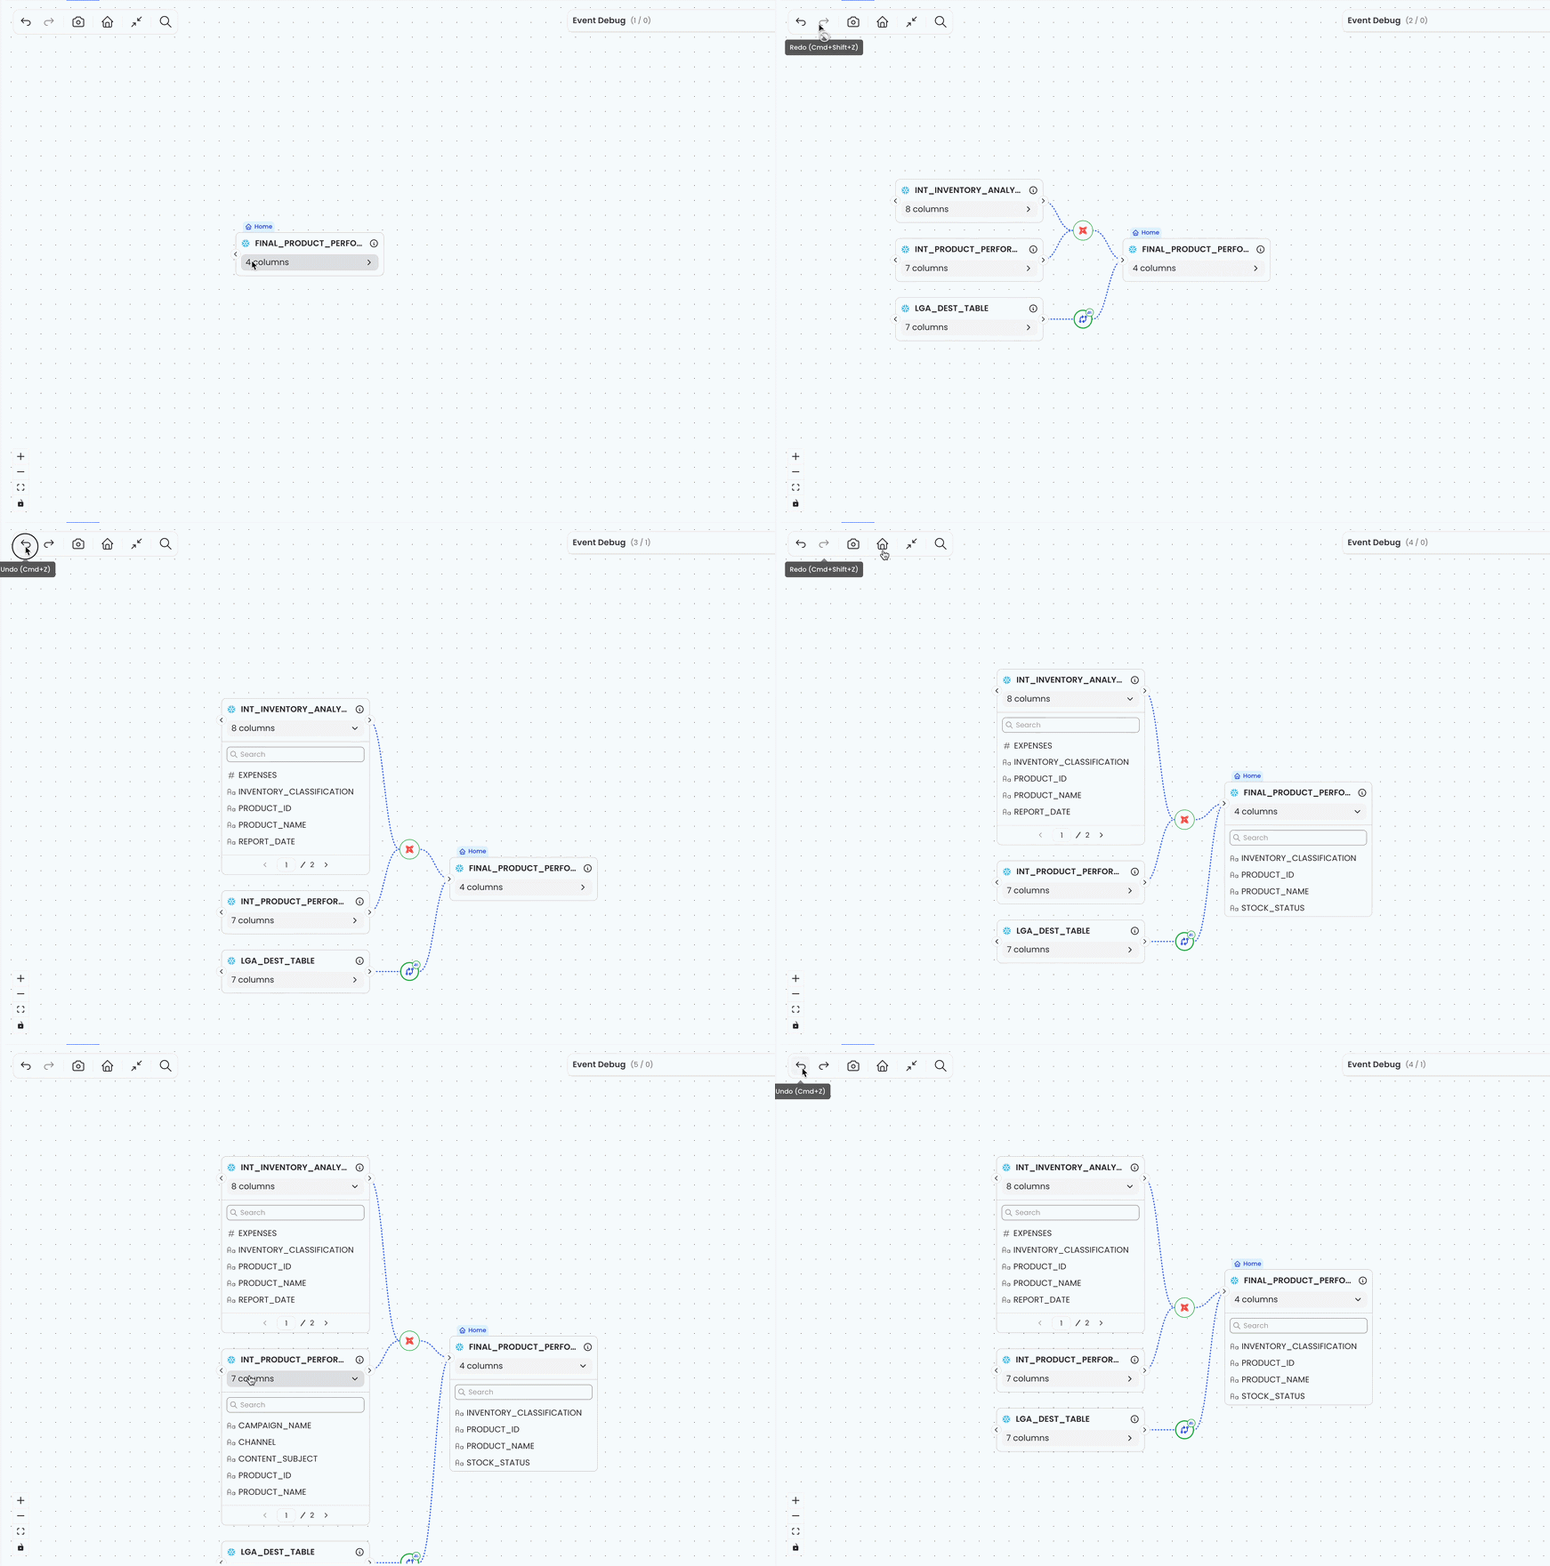
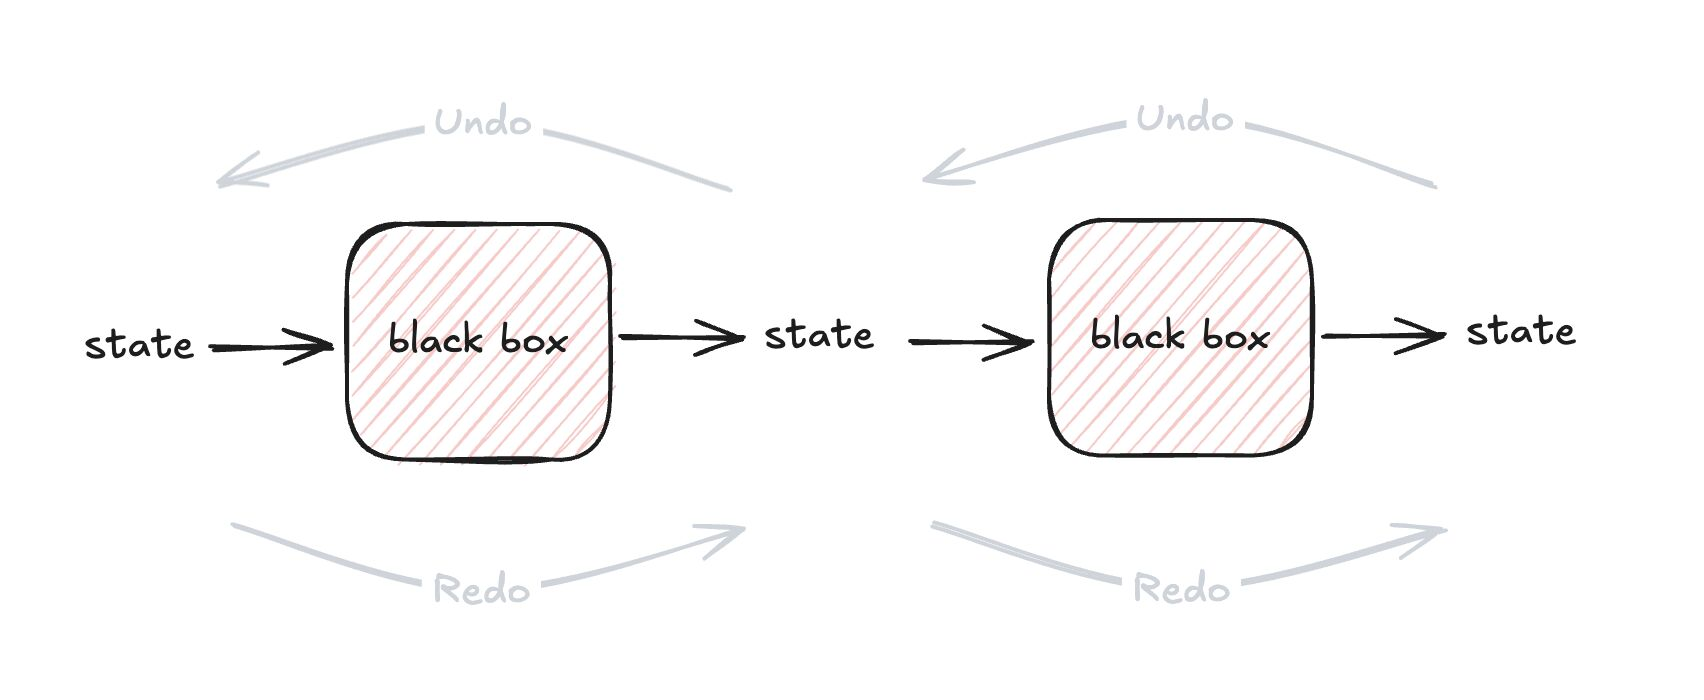
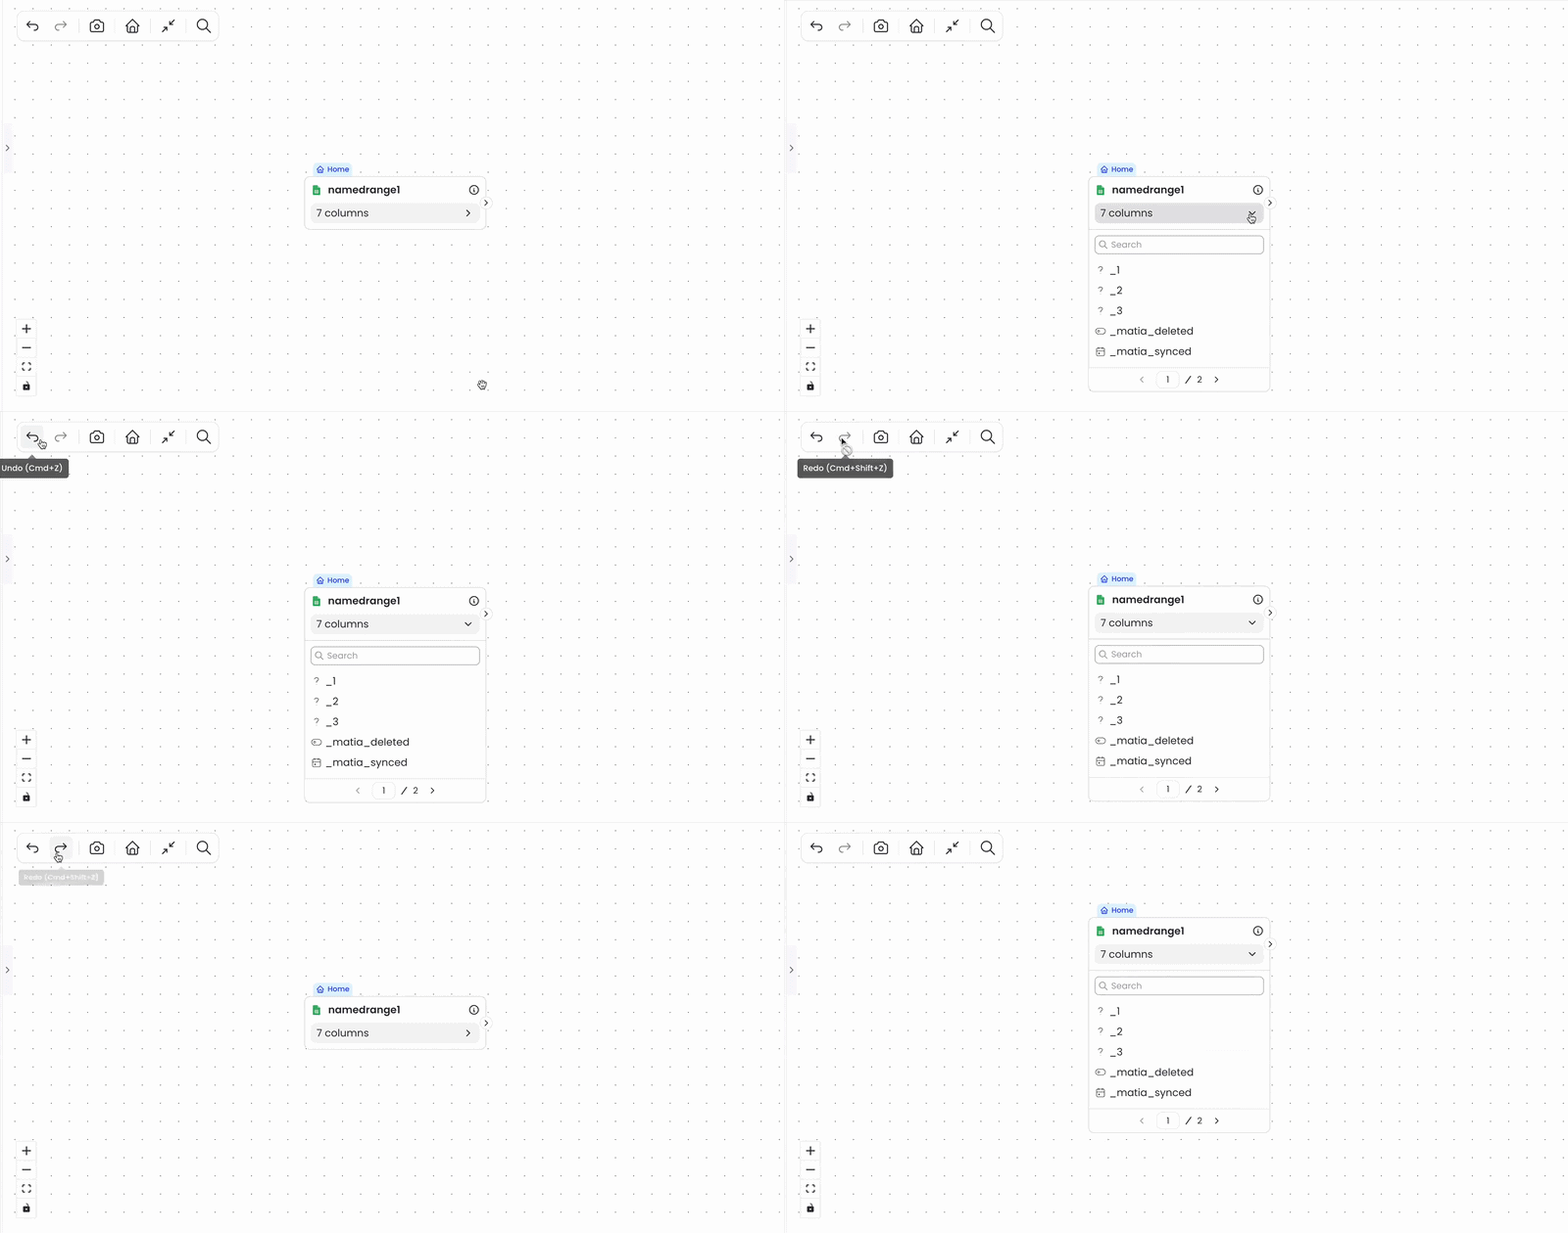
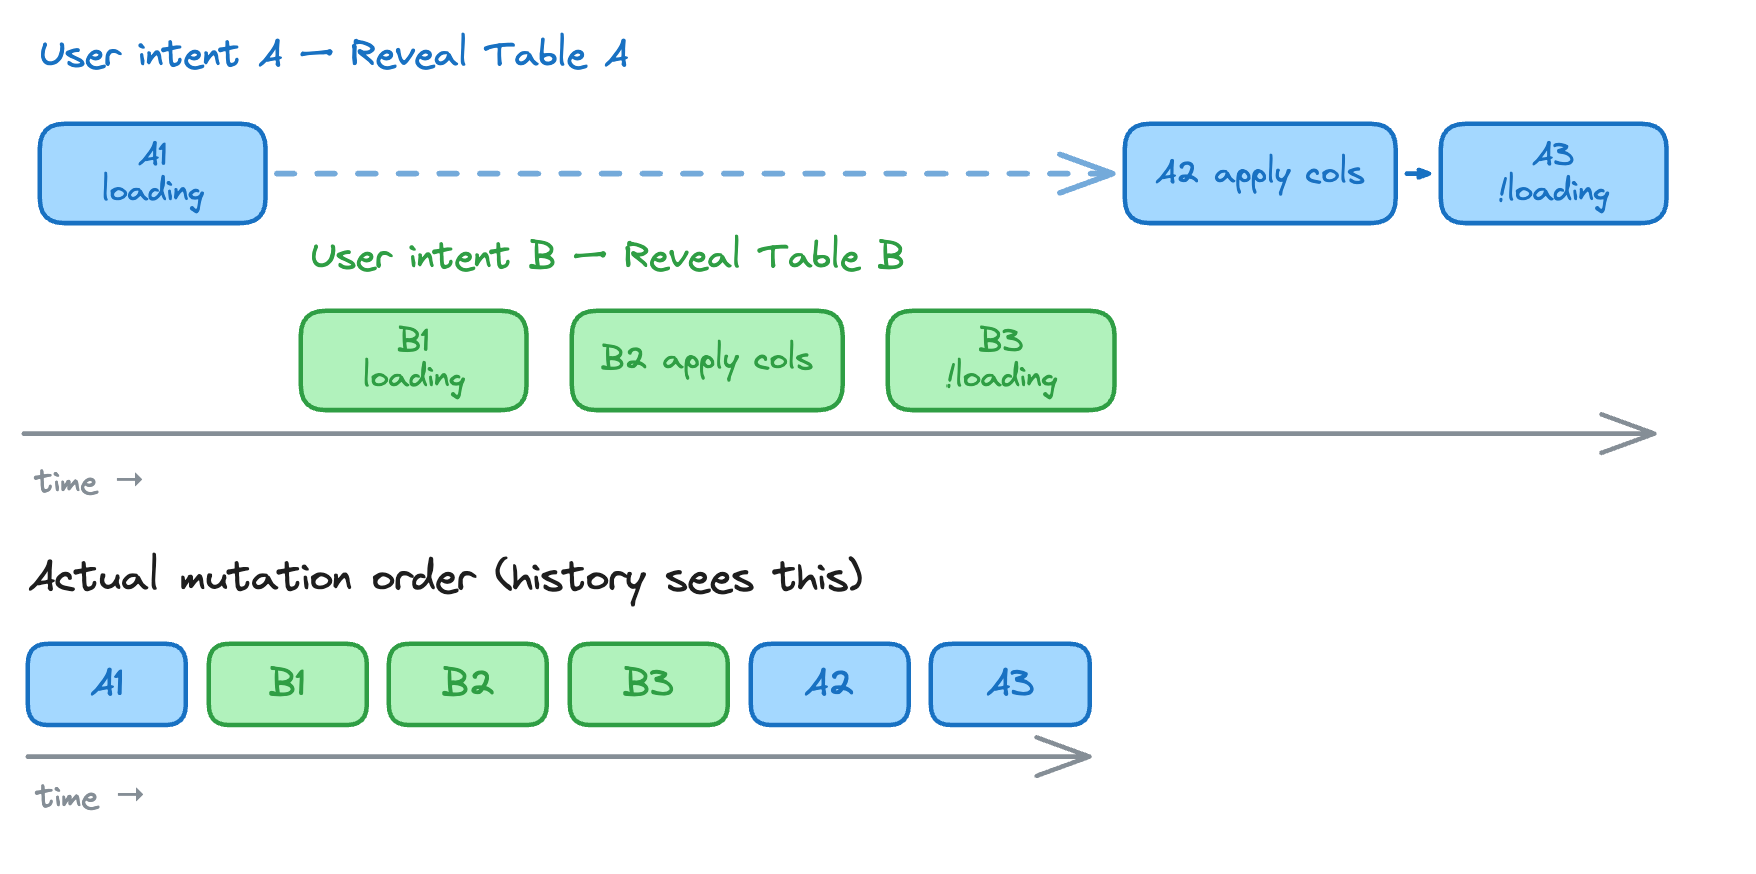
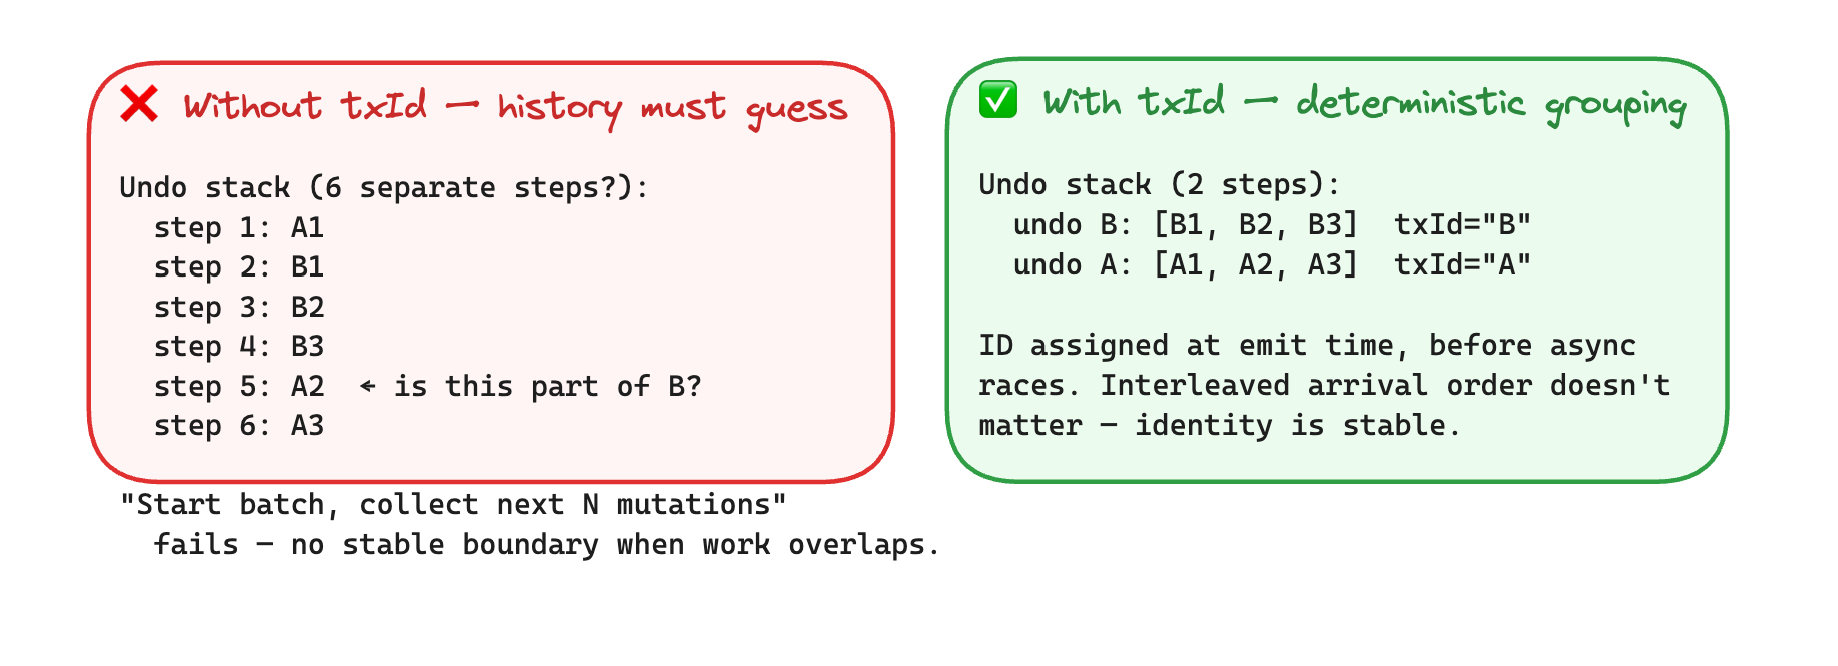
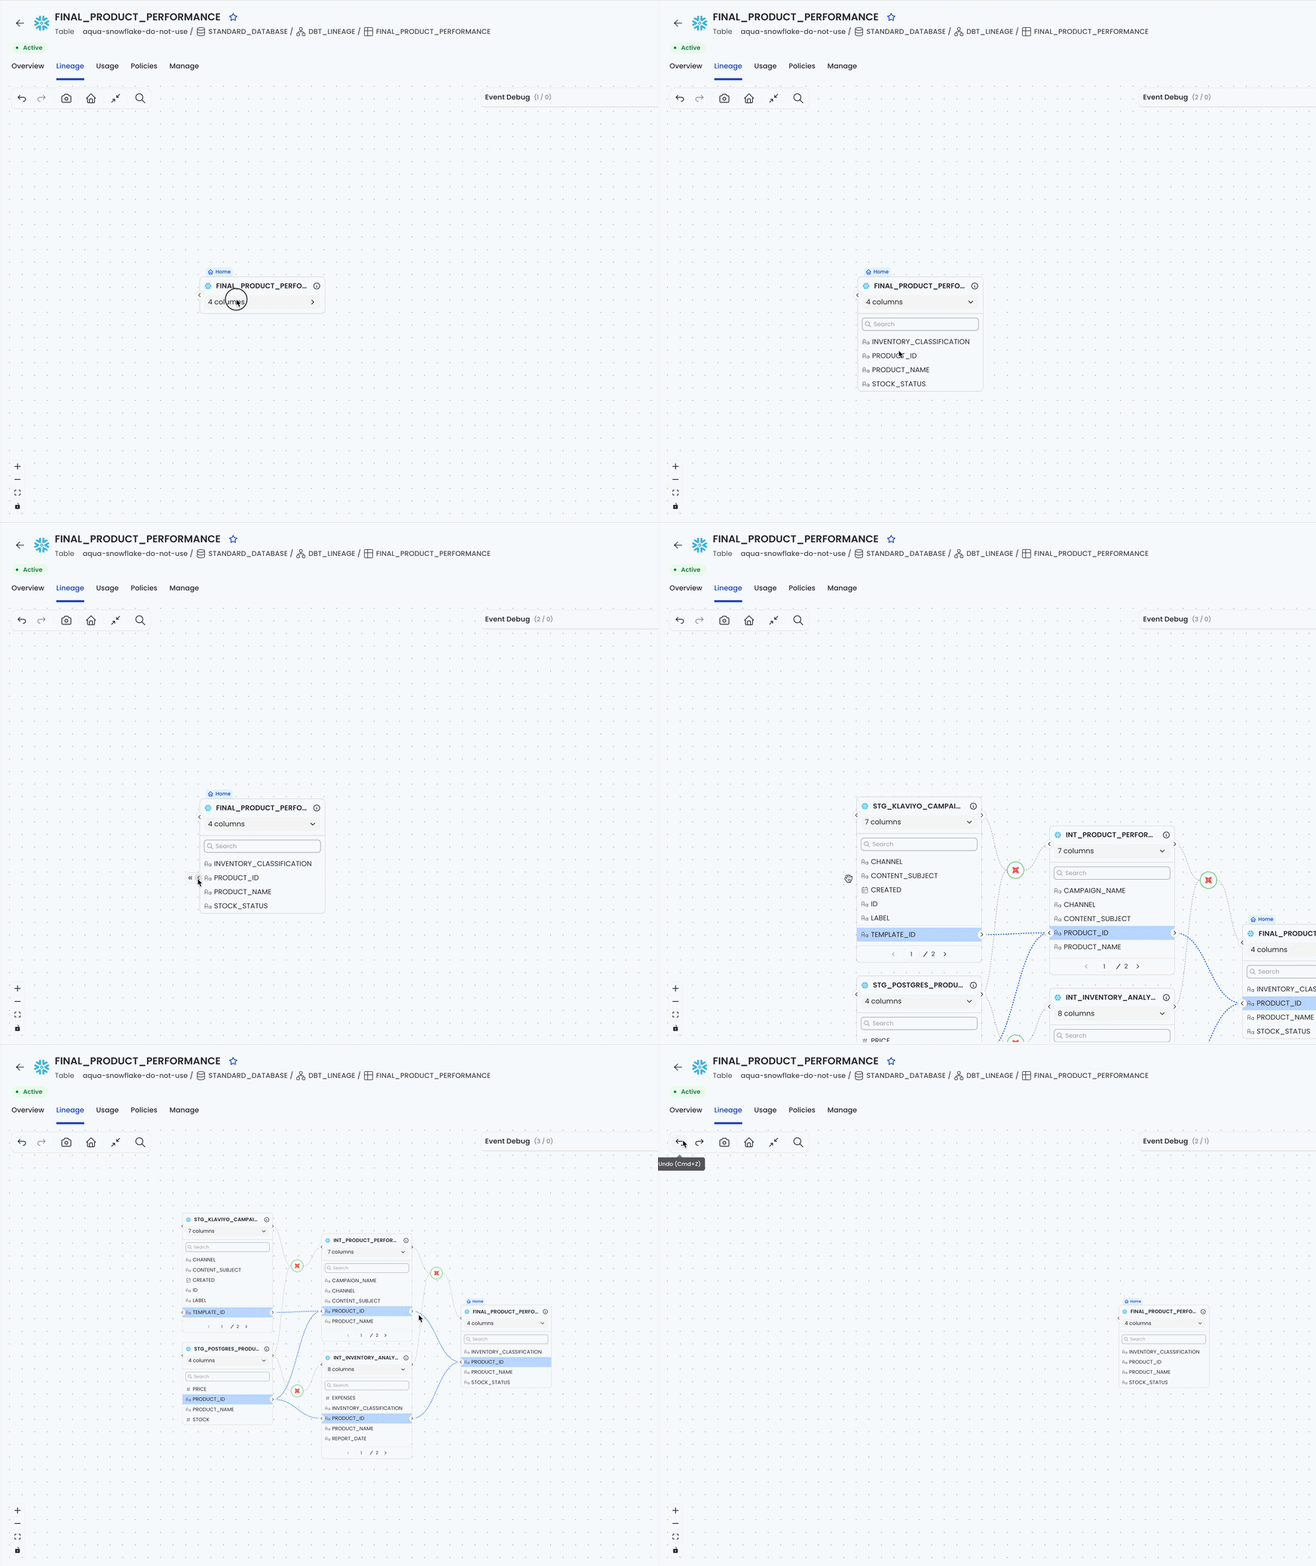
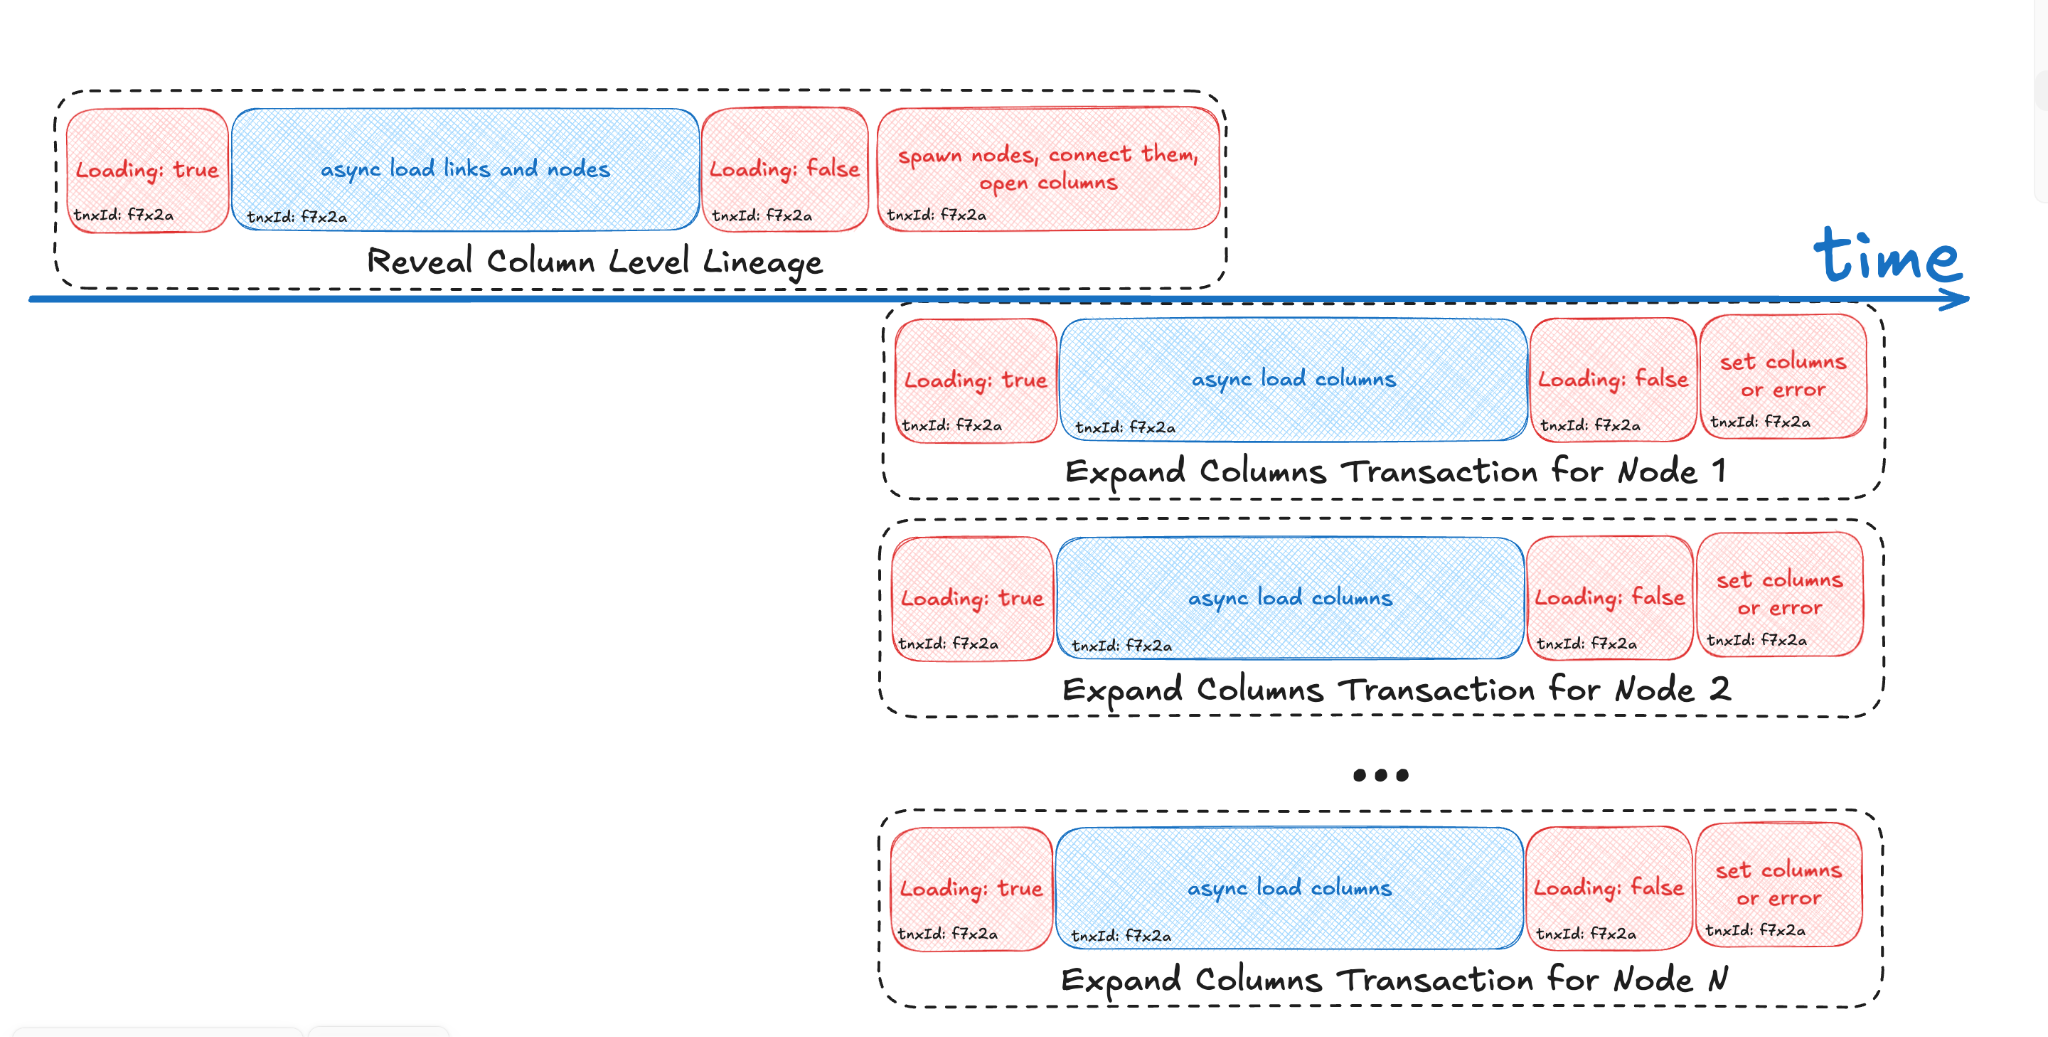
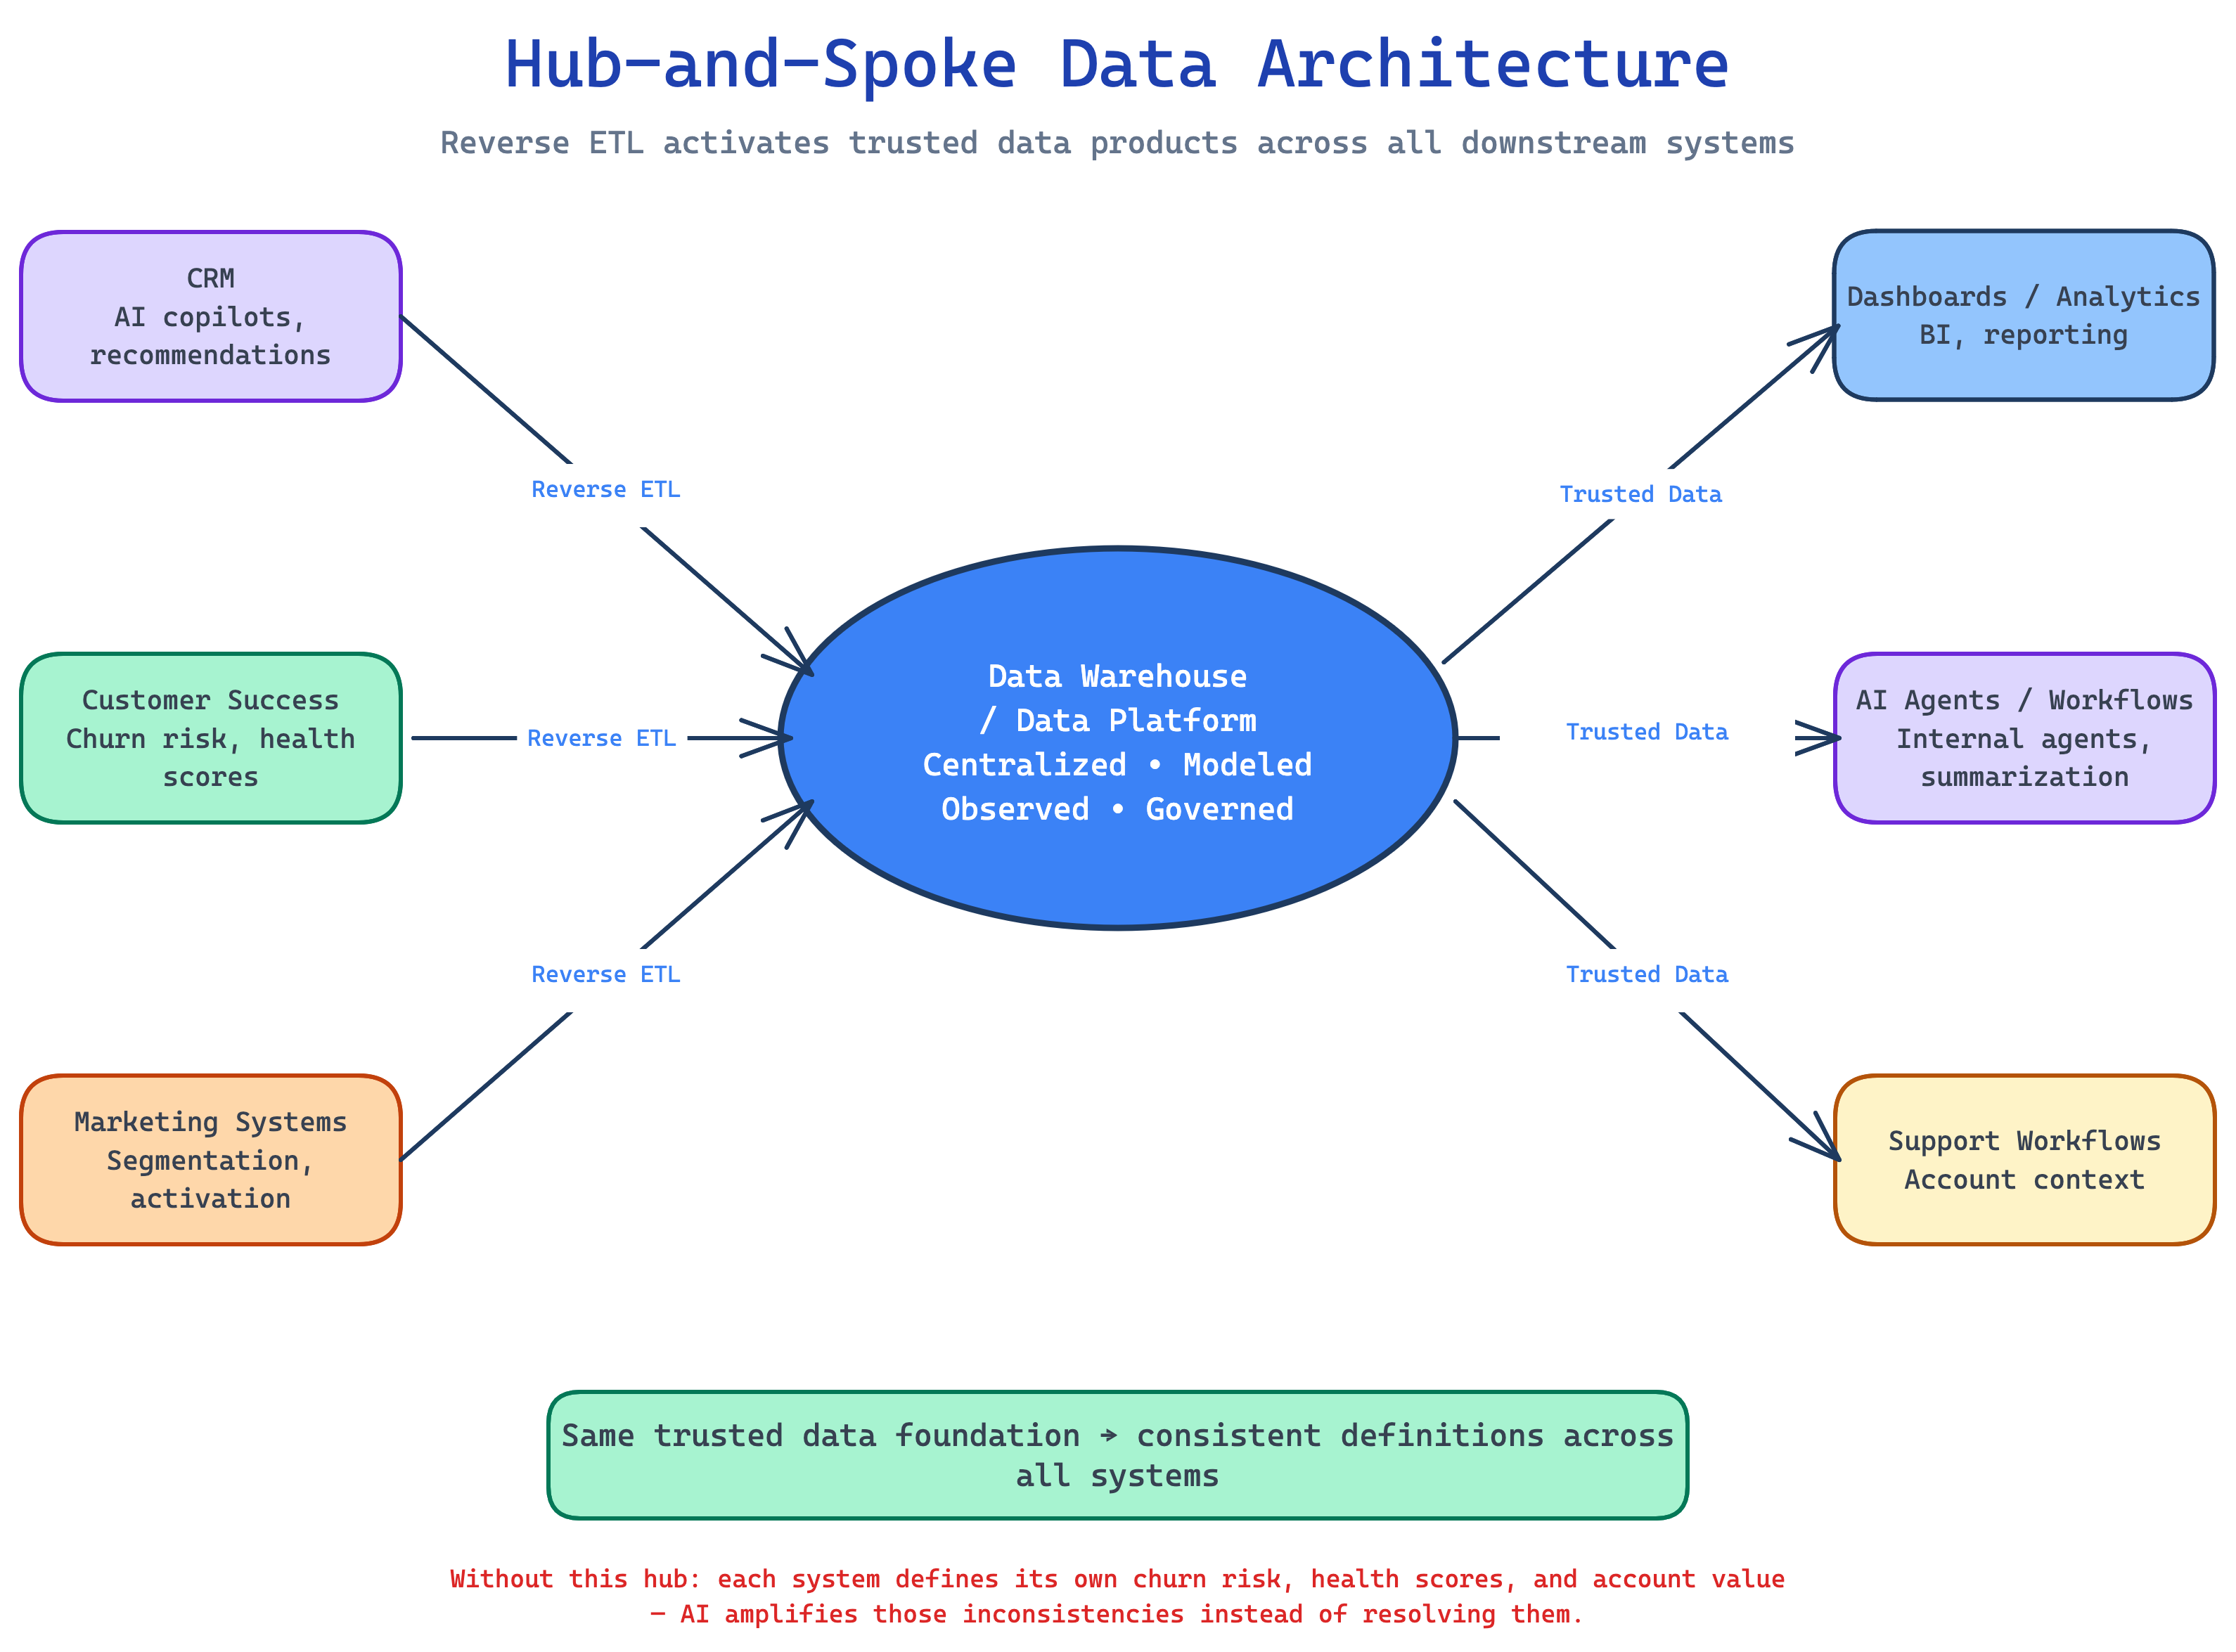

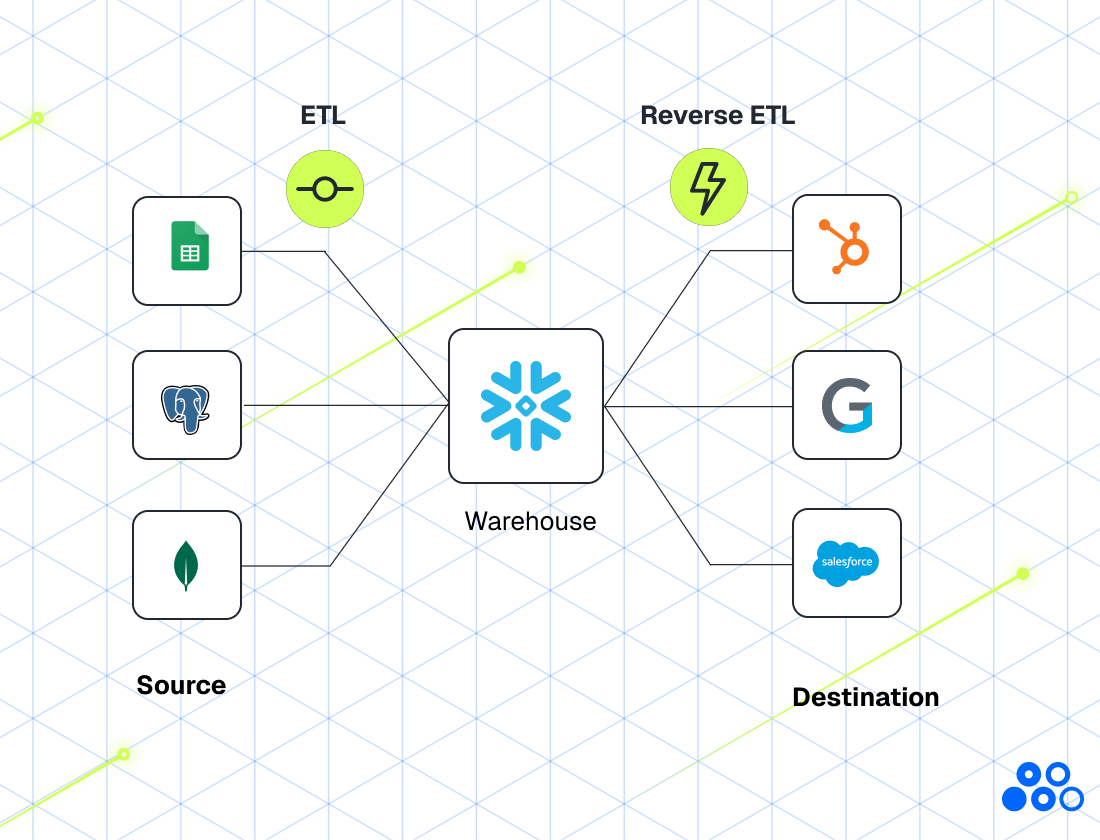

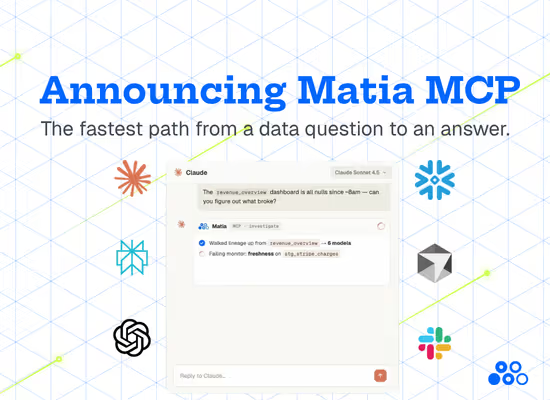


.png)